


The effect of Dysprosium concentration has been studied in glasses of the system 30 SiO2+30 Li2O+(40−x) B2O3+x Dy2O3 glass system where x=0.5, 1, 2.5, 5 and 10mol%. FT-IR studies were performed to understand the functional groups of the network involved in the host glass. The optical band gap is found in the range of 3.84–3.5eV. From the absorption spectra, the experimental data were compared with the theoretical data computed by Judd–Ofelt theory. Nephelauxetic ratio (β) and bonding parameters (δ) computed using the absorption spectrum. The Judd–Ofelt parameters (Ω2, Ω4, and Ω6) obtained demonstrates the covalent and asymmetric nature of dysprosium ions. From the visible emission spectra, the intensity ratios were calculated from yellow to blue and the relative differences were discussed based on the concentration of Dy3+ ions. CIE chromaticity coordinates were calculated for all glass samples. A CIE chromatogram shows a glass containing 0.5mol% Dy2O3 with color coordinates X=0.32 and Y=0.33 with the highest emission intensity. These glasses have great potentials for lasers and white LEDs (Light-Emitting Diode) applications.
Se ha estudiado el efecto de la concentración de disprosio en vidrios del sistema 30SiO2+30Li2O+(40-x) B2O3+x Dy2O3, donde x=0,5%, 1%, 2,5%, 5% y 10% en moles. Los estudios de FT-IR se realizaron para investigar y entender los grupos funcionales de la red que compone el vidrio. La banda prohibida óptica se encuentra entre 3,84 y 3,5eV.
Observando los espectros de absorción, los datos experimentales se compararon con los cálculos teóricos computados con la teoría de Judd-Ofelt. El nephelauxetic ratio (β) y los parámetros de unión (δ) se calcularon utilizando los espectros de absorción. Los parámetros (Ω2, Ω4 y Ω6), obtenidos mediante Judd-Ofelt, demuestran el carácter covalente y asimétrico de los iones de disprosio. A partir de los espectros de emisión visible se calcularon las relaciones de intensidad desde amarillo hasta azul, y se discutieron las diferencias relativas, basándose en la concentración de iones Dy3+. Se calcularon las coordenadas de cromaticidad CIE para todas las muestras de vidrio. El cromatograma CIE correspondiente a un vidrio que contiene 0,5% en moles de Dy2O3 muestra coordenadas de color X=0,32 y Y=0,33, con la mayor intensidad de emisión. Este conjunto de vidrios tiene un gran potencial para su posible uso en aplicaciones como láseres y LED blancos.
With the industrial progress that mankind is moving into, the frequent use of lighting and luminous devices such as phones and laptops, and the reduced exposure of humans to solar radiation, have negatively affected human health [1]. Moreover the usages of lightning in the optical fiber communication [2]. This attracted attention to the manufacture of a luminous material that had color-balance properties [3].
The shielding around 4f shell of RE (rare-earth) by the outer 5S and 5P shell caused the sharp fluorescence in the ultraviolet (UV), to infrared (IR) regions [4]. From all the RE elements Dysprosium Dy was chosen as it excited under UV wavelength and emitted two intense emission peaks [5], in the blue B region (4F9/2→6H15/2) at 484nm and yellow Y region (4F9/2→6H13/2) at 574nm. The combination between two peaks formed white light investigated by the Y/B ratio. The Y/B ratio can be changed and adjusted by changing the chemical composition, pumping of wavelengths, and Dy3+ ion content [5].
Better emission properties with long durability it is achieved using the host selection. Borosilicate glasses provide a wide range of composition, lower thermal expansion, high chemical stability, and good rare earth solubility [4,6].
The incorporation of alkali or alkaline earth metals to borosilicate glass system form non-bridging oxygen (NBOs) that decreases the connectivity of melts [6].
Moreover many studies carried on the production of white color as, D.D. Ramtek et al. studied the physical and optical properties of lithium borosilicate glasses doped with Dy3+ ions and found the two concentrations 1.5mol% and 2mol% Dy have the value (0.34, 0.35) chromaticity could be reached to a pure white light [7]. Dy3+ doped lithium aluminum borate glasses for W-LEDs studied by P.P. Bauer et al. [4]. It was found that the glass sample containing 0.5mol% Dy2O3 had the highest emission intensity with color coordinates X=0.34 and Y=0.38.
D.D. Ramteke et al. [8] studied the Sm3+/Dy3+ doped lithium borosilicate glasses and found that the emission intensity increased with increasing Dy3+ content.
The aim of this work to study the effect of substitution a former like boron with rare earth Dy in the presence of a constant alkali silicate concentration on optical white emission.
ExperimentalGlass compositions 30 SiO2+30 Li2O+(40−x) B2O3+x Dy2O3 where x=0.5, 1, 2.5, 5 and 10mol% were fabricated via the melt quenching technique. The samples were melted in a porcelain crucible at 300°C for half an hour and 1050°C in an electric muffle furnace (LENTON) and poured it immediately between two copper plates.
The samples were examined by using Philips Analytical X-ray diffraction system, type PW3710 based on Cu tube anode of wavelength Kα1=1.5406Å and Kα2=1.54439Å. The starting angle was 10° and the end angle 70°. The step size was 0.05° and the time per step was 2.5s. XRD showed no evidence of crystals in all glass samples.
The room temperature glass density (ρ) was determined using an Archimedes method with toluene (99.99% purity) as the immersion liquid. The density yield:
where Wa and Wb are the weight of glass samples in air and toluene respectively, and 0.865gcm−3 is the density of toluene at room temperature.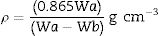
The FTIR absorption spectra of the prepared samples were measured at room temperature in the range 2000–400cm−1 by an infrared spectrometer (type JASCO FTIR-4100, Japan) using the KBr disk technique.
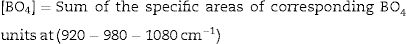
The comparative changes in both BO3 and BO4 units can be verified from the calculation of the appreciable fraction of [BO4] and [BO3] units can be calculated by the following equation:
The optical absorption spectra were measured in the range from 190 to 2500nm using a computerized recording spectrophotometer (type JASCO, V-570).
The emission measurements were carried out using (JASCO-FP-6300) Spectrofluorometer in the wavelength range (200–800nm).
Results and discussionThe importance of FTIR is concentrated in studying the groups formed in the glass network. Fig. 1 indicates the FTIR of borosilicate glass samples with different concentrations of Dy2O3. From fig. 1 observed that the presence of broadband indicates the homogeneity of the glass and overlapped the borate groups with silicate. The borate groups identified with three region 1200–1600cm−1[9–11], the region 800–1200cm−1[9,10] and at 600–800cm−1[12]. The possible silicate groups in the glass network are Q4 (4 bridging oxygen) (1200cm−1), Q3 (3 bridging oxygen and one non-bridging) (1075cm−1), Q2 (2 bridging oxygen and 2 non-bridging) (1000cm−1), and Q1 (1 bridging oxygen and 3 non-bridging) (900cm−1). Besides these silicate groups, the broadband also contains a range of stretching vibrations for the SiOSi bonds [13,14] and the bending vibrations of bridging oxygen between boron atoms (BOB bonds) in BO3 triangles [17]. The presence of silicate in the glass structure can be overlapped with borate groups in their region and formed the band from 830 to 1109cm−1. Intended for asymmetric stretching vibrations of SiOSi of [SiO4] [10,11,15]. The band at 688cm−1 attributed to the symmetric SiOSi stretching vibrations of the silicon tetrahedral group [12].

The silicate and borate groups could be connected as BOSi in the range 1105–1118cm−1 and in 718cm−1[16,17]. The bands in the low wavenumber nearly at 460–550nm represent the metallic cations vibration such as Dy3+ and Si4+ peak [9,11,12,15].
The FTIR spectra are also used to determine the BO3and BO4 concentrations from the deconvolution method.
FTIR spectra are used in determining the borate area, as seen in Fig. 1. From Fig. 2 it observes that the BO3 and BO4 have an opposite trend. It observes the destruction of the BO3 vibration group into an asymmetric BO4 vibration group associated with non-bridging oxygen. This glass consists of two former components, namely, SiO2 and B2O3 with structural units [BO3], [BO4], and [SiO4] attached to each other to form stable structural groups [12].

Density is an important tool to explain the structural modification in glass formation. Besides, the molar volume Vm plains the oxygen dispersion in the glass lattice [18].
Fig. 3 shows the variation of density and Vm (Vm=M/ρM is the molecular of sample composition) with the increase of Dy2O3 at the expense of B2O3. The density increases as the substituting the lower molecular weight B2O3 with the higher molecular weight Dy2O3 and formation of BO4 that has a higher density than BO3[7,10]. The molar volume decreases up to 1mol% Dy2O3 and then increases. The molar volume increases with Dy2O3 concentration due to it enters the glass network as the modifier occupies the interstitial position. As a result, the glass network expands. Or another explanation, the addition of Dy2O3 to glass samples change in the ratio of boron to oxygen and silicon to oxygen, which increases the cross-links of a group of borates and silicates, which leads to the expansion of the glass network, which causes an increase in the molar volume [7].

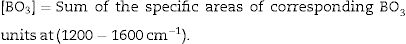
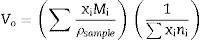
The compactness comparison of the prepared samples could be explained from the calculation, excess volume (Ve) and oxygen molar volume (Vo) by the following equations [12] and the obtained results drawn in Fig. 4.
where Vmi is the molar volume of each oxide (MWt/ρ of each oxide), xi is molar concentration of each oxide, Mi is molecular weight of each oxide (MWt), and ni. is number of oxygen in each oxide.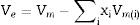
 and oxygen molar volume (Vo) of glass samples.")
Fig. 5 illustrates the scanning electron microscope (SEM) images of Dy3+ doped lithium borosilicate glass samples (1 and 10mol% Dy2O3) and the percentages of the elements present in the studied glass samples obtained using the Energy Dispersive X-ray spectra (EDS). The morphologies of these glass samples do not show any grains, confirming the amorphous nature of the glass sample. The formation of crack results from the strain. This information agrees with the XRD results. It is indicated that the prepared glass samples are purely amorphous in nature.
 images of Dy3+ doped lithium borosilicate glass samples (1 and 10mol% Dy2O3) and the percentages of the elements present.")
The UV–Vis–NIR absorption spectra of all glass samples are shown in Fig. 6. Fig. 6 clears the intensity change of bands in the range in visible and NIR that characterize the Dy2O3 concentration, assigned for the transitions between the levels in 4f9/2 electronic configuration from 6H15/2 ground state to excited levels of Dy3+ ions [13,19].

The electronic structure from the optical absorption is used in determining many parameters as optical band gap, Nephelauxetic ratio (β), bonding parameter (δ), and the oscillator strength that is used to know the radiative properties.
A differentiation method is used to determine the optical band gap Eg by relationship [20].
where α(v) is the absorption coefficient, hν is photon energy, and r is the type of transition.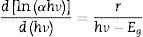
The calculated Eg drew in Fig. 7.

From Fig. 7 it is observed that the optical band gap increase with the Dy2O3 concentration up to 2.5mol% and then decreases. The change in the Eg values with concentration could be explained from the view of the structure change. From the results obtained, it was observed that the change of BO4 and the molar size of both have an opposite behavior to the gap of the light beam with increasing the proportion of samples. It increases bonding and does not bridge the oxygen imbalance. This leads to an increase in the degree of localization of the electrons and thus an increase in the donor center in the vitreous matrix [12,21–24].
The nature of bonding between ligand around Dy determined from the nephaulextic ratio B, which evaluated from the ratio between the transition energy in the glass sample to the energy in the aqueous solution according to the relation B=υc/υa. The type of bonding (covalent or ionic) could be determined from the sign given from bonding parameter relation δ=(1−B′)/B′ where B′=∑B/number of transition (n). The calculated values tabulated in Table 1, the negative sign that represents the iconicity nature of Dy3+ ligand bond in any hosts [19,25].
The band positions (nm) of (the prepared glass samples and the aqua ion) and bonding parameters (β and δ) of the Dy3+ doped lithium borosilicate glasses.
| λnm | 10 Dy2O3 | 5 Dy2O3 | 2.5 Dy2O3 | 1 Dy2O3 | 0.5 Dy2O3 | Aqua ion |
|---|---|---|---|---|---|---|
| 1254 | 7974.48 | 7936.5 | 7936.5 | 7961.7 | 7898.8 | 7700 |
| 1084 | 9225.09 | 9208.1 | 9174.3 | 9225.09 | 9107.4 | 9100 |
| 892 | 11,210.76 | 11,235.95 | 11185.6 | 11235.9 | 11086.4 | 11000 |
| 800 | 12500 | 12500 | 12468.8 | 12531.3 | 12500 | 12400 |
| 770 | 12987 | 12987 | 13157.89 | – | – | 13250 |
| 476 | 21008.4 | 21008.4 | – | 21097 | – | 21100 |
| 454 | – | – | – | – | 22026.4 | 22100 |
| 428 | 23364.48 | 23474.17 | 23364.48 | 23474.17 | 23474.1 | 23400 |
| 388 | 25773.2 | 25906.73 | 25906.73 | 26,041.66 | – | 25,800 |
| 362 | 27,624.3 | 27,624.3 | 27,624.31 | – | 27,503 | |
| 348 | – | – | 28,901.73 | – | – | 28,551 |
| B′ | 1.006 | 1.0066 | 1.008 | 1.013 | 1.007 | |
| δ | −0.006 | −0.0065 | −0.008 | −0.013 | −0.007 |
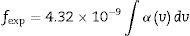
The spectral strength (fexp) of absorption bands of glass composition doped with rare earth (Dy2O3) calculated from the integrated area under the peaks according to the relation
With the Judd–Ofelt theory, the spectral strength calculated theatrically according to the relation
where Ωλ is the Judd–Ofelt intensity parameters and h is Plank constant, n is the refractive index, m is the mass of electron, c is the speed of light and v is frequency of transition. ‖Uλ‖ are the reduced matrix elements due to J–J′ transition of Dy3+.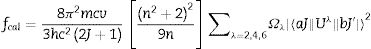
The quality fit between the results obtained experimentally and theoretically obtained from the root mean square equation according to the relation
where N is the number energy level.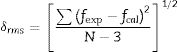
The lower root mean square values δrms represent the agreement of the experimental values fexp with the calculated values fcal (Table 2).
The experimental spectral strength (fexp) and calculated (fcal) of absorption bands of glass composition and the values of root mean square (δrms) of absorption bands of the glass composition.
| 10 Dy2O3 | 5 Dy2O3 | 2.5 Dy2O3 | 1 Dy2O3 | |||||
|---|---|---|---|---|---|---|---|---|
| λ nm | fexp | fcal | fexp | fcal | fexp | fcal | fexp | fcal |
| 1258 | 58.5 | 58.4 | 51.8 | 51.6 | 58.2 | 58.1 | 62.6 | 61.8 |
| 1086 | 12.6 | 12.6 | 11 | 10.8 | 11.6 | 11.3 | 12.2 | 11.2 |
| 892 | 8.89 | 8.82 | 7.79 | 8.40 | 8.19 | 9.43 | 8.60 | 12.3 |
| 800 | 3.84 | 3.74 | 5.07 | 3.79 | 6.94 | 4.44 | 13.6 | 6.51 |
| 770 | 0.2177 | 0.686 | 0.288 | 0.713 | 0.149 | 0.835 | – | – |
| 476 | 0.08 | 0.655 | 0.072 | 0.63 | 0.104 | 0.712 | 0.102 | 0.945 |
| 428 | 0.134 | 0.303 | 0.130 | 0.304 | 0.149 | 0.353 | 0.204 | 0.115 |
| 388 | 1.31 | 1.27 | 1.09 | 1.20 | 0.953 | 1.39 | 0.612 | 1.77 |
| 362 | 0.404 | 1.67 | 1.09 | 1.69 | 0.342 | 1.98 | 0.102 | 2.90 |
| δrms | 0.89 | 0.324 | 1.29 | 0.39 | ||||
The importance of Judd–Ofelt parameters derived from the absorption spectra, refractive index summarized in predict the glass structure and the fluorescence intensity of the transition [19,26].
The Judd–Ofelt parameters [27] indicate the glass structure, the Ω2 indicate the short-range parameter as the covalence and asymmetry around Dy, while Ω4 and Ω6 show the long rang parameters as the rigidity and viscosity of glass samples.
Fig. 8 shows the relation between the Judd Ofelt parameters and the intensity of Dy2O3 concentration.
 and the bonding parameters (δ).")
Fig. 8 generally shows higher values of Ω2 which represent a higher covalent around Dy, high disorder around Dy3+ and the host [28]. And it gradually decreases as the concentration of Dy ions increases. Fig. 8 demonstrates the opposite behavior between the decrease in covalency represented from Ω2 value and the increase of ionicity represented from δ value that coincidence with the increase in BO4− shown in fig. 2. Also, find that the parameter Ω2, as well as the nephelauxetic (Table 1), has asymmetric behavior confirming that the increase in the coordination of BO4 reduces the asymmetry around Dy ions in the prepared glass [25].
The stimulated emission [29,30] of glass sample doped with Dy3+ characterized by the quality factor (Ω4/Ω6), which is important in explaining the behavior of laser transitions [17] tabulated in Table 3 matrix. It was found that the values of Ω4/Ω6 in Table 3 increased with increasing Dy3+ concentration to reach a value larger than 1 in the 10mol% Dy2O3 as it predicts the possibility of laser emission. Judd–Ofelt parameters and Ω4/Ω6 ratio for glass samples under study compared to other glass systems as shown in Table 3.
The spectroscopic quality factor (Ω4/Ω6), Y/B ratio, (x, y) chromaticity and CCT at the excitation λexc=350, 370, 390nm.
| Glass | Ωλ (λ=2, 4 and 6)Ω*10−20cm2 | Trend | Reference | Ω4/Ω6 |
|---|---|---|---|---|
| Lithium borosilicate 1.0Dy | 52.8, 0.775, 10.6 | Ω2>Ω6>Ω4 | P.W. | 0.073 |
| Lithium borosilicate 2.5Dy | 46.6, 5.33, 7.26 | Ω2>Ω6>Ω4 | P.W. | 0.734 |
| Lithium borosilicate 5.0Dy | 37.0, 5.62, 5.69 | Ω2>Ω6>Ω4 | P.W. | 0.988 |
| Lithium borosilicate 10.0Dy | 40.7, 7.9, 5.55 | Ω2>Ω4>Ω6 | P.W. | 1.423 |
| Tellurite | 1.46, 2.32, 3.60 | Ω6>Ω2>Ω4 | [31] | 0.64 |
| (Tellurite) | 16.0, 2.39, 3.75 | Ω2>Ω4>Ω6 | [3] | 0.64 |
| (Borate) | 23.02,12.86,12.17 | Ω2>Ω4>Ω6 | [32] | 1.06 |
| (Germanate) | 3.65, 0.65, 1.57 | Ω2>Ω6>Ω4 | [30] | 0.41 |
| Aluminoborosilicate Dy 0.1 | 12.59, 0.45,17.52 | Ω6>Ω2>Ω4 | [6] | 0.03 |
| Molybdenum borosilicate | 0.98, 0.23, 0.69 | Ω2>Ω4>Ω6 | [33] | |
| Silicate | 8.32, 2.14, 2.75 | Ω2>Ω6>Ω4 | [34] | |
| Lead borosilicate | 11.43, 4.38, 3.82 | Ω2>Ω4>Ω6 | [35] | |
| Phosphate | 8.05, 2.77, 2.31 | Ω2>Ω4>Ω6 | [36] | |
| Silicate | 8.06, 2.24, 2.03 | Ω2>Ω4>Ω6 | [37] |
The higher value of Ω2 in the studied glass system indicates a moderately stronger covalence and asymmetry around the Dy3+ ion compared to other glass systems. A higher value of spectral quality factor X=Ω4/Ω6 indicates the emission of a dominant component in the gain medium. It was found that the spectral quality factor computed for the samples under study is the maximum optimal doping concentration of Dy to be 10mol%. It is higher than the other glass systems in the literature, as shown in Table 3.
Fig. 9 displays the photoluminescence excitation of glass samples emitted under 575nm for all prepared glass samples. For all glass samples, it observed the photoluminescence excitation bands [38] at 324, 350, 364, 386, 425, 452, and 470nm corresponding the transition from the ground state 6H15/2 to 4M17/2+6P3/2, 6P7/2, 4I11/2+6P5/2, 4I13/2+4F7/2, 4G11/2, 4I15/2, and 4F9/2 excited states. It noticed the presence of nonlinearity behavior in all the exciting peaks, however, the peak position has the same energy value. The peak centered at 350, 364, and 386nm have the highest intensity, make them appreciate for photoluminescence emission measurement.

Fig. 10 shows the emission of glass samples with different concentrations of Dy as excited with 350nm, 370nm, and 390nm. The emission intensity depends mainly on the concentration of the Dy, host and the exciting energy.

Fig. 10 observed the broadness of peak and the change of intensity with any change of concentration of Dy or the change of exciting energy. The broadness of peak due to there are several Stark levels for the 4F9/2 and 6HJ levels [39].
With the increase of Dy concentration at excitation 370nm, and 390nm, it shows the splitting of peaks due to the appearance of the Stark splitting [39]. The two emission peaks assigned to 482 represented as the magnetic dipole transition corresponding to 4F9/2→6H15/2 (blue) and 574nm represented to electric dipole transition corresponding to 4F9/2→6H15/2 (yellow) [13,40]. The strength of rare-earth ion transition 4F–4F transition relates to the strength parameters [Uλ]i→j′ and consequently the strength parameter depends on the host and RE ions. For Dy3+, the [U2] value of the 4F9/2→6H13/2 transition about (0.049) larger than the value transition 4F9/2→6H13/2 about (0), make the emission intensity of the4F9/2→6H13/2 transition appreciably depends on the chemical surroundings of the luminescent center [13,41]. The convergence of values between 6H13/2 and 6H15/2 transition shows the lower asymmetric for glasses [29]. Fig. 10 shows the increase in intensity with the increase of Dy concentration up to 1mol% and then decrease. The decrease is a result of luminescence quenching. The luminescence quenching is explained by two mechanisms the first is the increase of the Dy–Dy distance and leads to the increase of nonradiative energy. The second due to the cross-relaxation mechanism [13,40,42].
The Dy---Dy separation calculated according to the relation:

where N is the concentration of Dy per unit volume in glass samples and determined using
where ρ is sample density, Na is Avogadro's number and W is the atomic weight of Dy.
R and N are tabulated in Table 4. From it observed the Dy---Dy separation increases and the N decreases as the Dy content increases which cause the luminescence quenching.
The type of quenching could be determined according to Dexter's theory. If the concentration of rare earth is large enough, draw the relation between log I/x and log x according to the relation
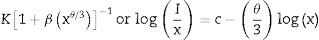
where, K, β, and c are constant. θ=6, 8, and 10 are corresponding to electric dipole–dipole (d–d), electric dipole–quadrupole (d–q), and electric quadrupole–quadrupole (q–q) interactions, respectively.
Fig. 11 shows the log (I/x)–log(x) plot for the 4F9/2→6H15/2 transitions of Dy3+ ions excited at 350nm, 370nm, and 390nm. In the region of high concentrations using linear fitting the experimental data, the slope parameter equals 1.7738 and the calculated value of θ=5.3214 near the value of 6 in two excitations 370nm and 390nm for glass samples. It indicates the electric dipole–dipole interaction mechanism, which different for glass samples excited at 350nm that have θ=7.5, near the 8 value represented as electric dipole–quadrupole (d–q) mechanism is dominant for the energy transfer among Dy3+ ions in glass samples, it agrees with the other studies [39,41,43].
 vs. log(x) of glass samples (λex=350, 370, and 390nm).")
The Y/B ratio clarifies the local symmetry in the lattice and the degree of iconicity or covalency between the Dy3+–O2− atoms.
Therefore, the alteration of Dy3+ concentration tunes the Y/B ratio, which aligns the chromaticity coordinates within the white light region [38].
Y/B collected in Table 5. From Table 5, the Y/B ratio of glass samples containing Dy up to 10mol% close to unity makes it suitable for a white generation [13].
Color coordinates (X, Y), CCT ratio, and Y/B ratio for glass compositions excited at 350, 370, and 390 nm.
| Dy2O3 | Y/B at (nm) | (x,y)chromaticity | CCT at (nm) | ||||||
|---|---|---|---|---|---|---|---|---|---|
| 350 | 370 | 390 | 350 | 370 | 390 | 350 | 370 | 390 | |
| 0.5 | 1.1 | 0.99 | 1.07 | (0.34, 0.36) | (0.32, 0.33) | (0.34, 0.35) | 5095 | 6046 | 5141 |
| 1 | 1.11 | 1.01 | 1.06 | (0.36, 0.37) | (0.32, 0.34) | (0.34,0.37) | 4488 | 5733 | 5147 |
| 2.5 | 1.13 | 0.95 | 0.99 | (0.34,0.36) | (0.31, 0.32) | (0.34, 0.35) | 4946 | 6474 | 4824 |
| 5 | 1.1 | 1.01 | 0.98 | (0.35,0.31) | (0.31, 0.31) | (0.39, 0.36) | 4215 | 6621 | 3497 |
| 10 | – | 0.73 | 0.79 | – | (0.31, 0.30) | (0.32, 0.31) | – | 6867 | 5942 |
The emission spectra are used in calculating the color mapping of each sample through the chromaticity diagram.
Fig. 12 shows the CIE diagram of glass samples with different concentrations of Dy excited at 350nm, 370nmand 390nm. The calculated chromaticity coordinated of glass samples tabulated in Table 5. It found from the values the dependence relation between Y/B ratio and the (x, y) chromaticity [19] as when the Y/B ratio close to unity, the chromaticity values reach be ideal white illumination (0.33,0.33) [39] at the sample excited at 370nm, the sample excited at 350nm and 390nm have values far enough from the white region. Further specification of white light appears in the determination of the correlated color temperature CCT. The CCT importance [13] summarized in determining the type of white color as a cold light used in official places or warm light used in a warm and relaxed places. The CCT calculated according to the relation [40,44].
where n=(x−xe)/(y−ye) is the inverse slope line and (xe=0.332, ye=0.186) is the epicenter.

The CCT temperature calculation guides the glass sample in the application, divided according to the temperature as a warm light is around 2700K, moving to neutral white at around 4000K, and to cool white, at 5000K or more. The required range of white color temperatures is from about 3000 to 9300K, for the most typical applications, the white point is targeted to be near 6500K (called D65) to 10,000K [45].
Table 5 indicates the different characterization range of temperature in glass samples excited with 350nm, 370nm, and 390nm. The samples with the little concentration of Dy exited with different energy behavior as the cool white, the samples at the composition 2.5mol% Dy up to 10mol% Dy excited at 370nm have the D65 application, the sample at 5mol% Dy excited at 390nm could be explained as the natural or warm light and the sample 5mol% Dy excited at 350nm could be used as natural light.
ConclusionGlasses with composition 30Li2O–30Si2O–(40−x) B2O3–xmol% of Dy2O3 (where x=0, 1, 2.5, 5 and 10mol%) synthesized by melt quenching method. Examination of samples using X-ray diffraction confirmed the amorphous nature of the prepared glass samples.
The presence of different structural units such as BO3, BO4, and SiO4 was identified by infrared spectroscopy. The J–O parameter of the prepared glass samples containing 10mol% Dy2O3 content has the trend Ω2>Ω4>Ω6. The other samples have the trend Ω2>Ω6>Ω4. Higher values of Ω2 indicate low symmetry and ionicity around the Dy3+ ionic site. This indicates the high quality of glass hosts for use in optoelectronic applications.
The quenching behavior was observed in glass samples containing a Dy3+ ion concentration above 1.0mol%.
Through Dexter's theory, it is found that the energy transfer between Dy3+ ions in glass samples is due to the nature of the dipole-dipole and dipole-quadrupole interaction.
CIE coordinates were calculated for the glass samples under study.
Its values are falling in the white light region. The CCT values of the samples under study indicate the possibility of generating cold light from the prepared glass under the specified excitation. Hence some glass samples under the current study can be suitable ambitious for the development of laser as well as cool white light with excitation and adapt to the appropriate Y/B ratio.

