


Present paper reports an approach to BaI2:Eu2+ glass ceramic fabrication from a powder route. The structural, morphological, luminescent and paramagnetic properties of the materials synthesized this way have been investigated. X-ray diffraction analysis made evidence for the glass ceramics containing BaI2·2H2O and BaI2 inclusions when 50wt.% of the starting iodide powder had been used in the synthesis process. According to scanning electron microscopy, only two samples demonstrated presence of ceramics particles inside: those with initial mix of 25 and 50wt.% of the BaI2:Eu2+. Photoluminescence spectra could be measured only in these samples. They were multicomponent as compared to the single band spectrum observed in the BaI2:Eu2+ powder. Altogether this indicates europium distribution over several places with different environments in the materials. BaI2 dissolution in the glass matrix is confirmed further by electron paramagnetic resonance measurements. They have shown that the Eu2+ ions predominantly stay in the glass avoiding ceramic grains. Only negligibly small amount presumably occupies the ceramic part in the sample with the initial 50wt.% part of the BaI2 powder. The Eu2+→Eu3+ charge transformation under 442nm laser light irradiation has been observed in the glass ceramics as well.
Este artículo informa sobre el enfoque de síntesis de BaI2:Eu2+ vitrocerámica a partir de una ruta de polvo. Se han investigado las propiedades estructurales, morfológicas, luminiscentes y paramagnéticas de los materiales sintetizados de esta manera. El análisis de la difracción de rayos X había demostrado las vitrocerámicas que contienen inclusiones de BaI2·2H2O y BaI2 cuando el 50% en peso del polvo de yoduro se había utilizado en el proceso de síntesis. Según la microscopia electrónica de barrido, solo dos muestras demostraron la presencia de partículas de cerámica adentro: aquellas con una cantidad inicial del 25 y 50% en peso del BaI2:Eu2+. Los espectros de fotoluminiscencia solo se pudieron medir en estas muestras. Eran multicomponentes en comparación con el espectro de banda única observado en el polvo BaI2:Eu2+. En conjunto, esto indica la distribución de europio en varios lugares con diferentes ambientes en los materiales. La disolución de BaI2 en la matriz de vidrio se confirma, además, por mediciones de resonancia paramagnética electrónica. Han demostrado que los iones de Eu2+ permanecen predominantemente en el vidrio, evitando los gránulos de cerámica. Solo una cantidad insignificantemente pequeña ocupa presumiblemente la parte cerámica en la muestra con el 50% en peso del polvo inicial de BaI2. La transformación de carga de Eu2+→Eu3+ bajo irradiación de luz láser de 442nm también se ha observado en la vitrocerámica.
Development of new cheap and effective luminescent materials is one of the demanding tasks in materials science. It is inspired by everlasting search for improvement in the numerous fields of human's activity and life where such materials find applications as detectors transforming incident high energy radiation into light of the required spectral range. These fields are: high energy physics, photonics, medicine, lighting, security, agriculture and others [1–3]. The most prominent and effective representatives of the promising phosphors are halide based compounds doped with rare earths, Eu2+, Eu3+, Dy3+, Tb3+, Ce3+, etc. depending on the required emission wavelength [4–6]. Glasses, ceramics and glass ceramics are perspective as luminescent materials due to thermal and radiation stability, variable optical properties and sufficient optical tunability [7–10]. Furthermore, it is much easier to obtain materials in a glass ceramic form in comparison with single crystals since they require lower fabrication costs [1] and allow to combine glass and crystalline properties [2].
In general, glass ceramics synthesis can be accomplished in two ways: (i) direct growth of crystalline phase in glass matrix during its crystallization, including sol-gel process in the primary stage [4,11–13]; (ii) mixing of glass and phosphor powders with subsequent thermal treatment (PiG) [14] (additional information about powder route can also be found in [15]). Both technologies have certain peculiarities related to the resulting phosphor composition. The former suffers from the formation of competitive additional phases during crystallization. To avoid them, thorough control of initial glass compositions or crystallization conditions allowing to receive only one crystalline phase is needed. This, however, may be a difficult task. In the second technology the possibility of new compounds formation due to the chemical reaction between glass and crystalline materials must be taken into account. The shape and wettability of the crystalline particles surface in the glass medium are also important, because this can be the source of strong nonuniformity of the crystalline particles distribution in a glass matrix. The decrease of transparency or coloration of the glass ceramics can be expected in this case. Despite this, the glass ceramics with crystallites homogenously spread over the glass matrix may be obtained [16]. Among the other good qualities, the glass matrix has a moisture protecting function, exceedingly useful when the ceramic particles are hygroscopic. Moreover, implementation of the glass ceramics diminishes the problem of structural anisotropy [1,7].
Among all the iodides of alkaline-earth elements, BaI2 has the highest Zeff and broad bandgap of about 5eV, comparable to that of SrI2. Oppositely to the SrI2 it is much less hygroscopic. This allows its easier production especially in the glass ceramics form. Along with the absence of radioactive isotopes affecting the background all this makes it prospective not only as phosphor [17,18] but also as scintillation material for various applications (homeland security, nuclear control, high-energy physics, etc.) [2,19,20].
Unfortunately, structural anisotropy is serious barrier in BaI2 production. The single crystal growth of BaI2:Eu is expensive and long lasting process. Moreover, currently it is not possible to obtain transparent samples of large volume due to anisotropy, which leads to certain difficulties for their practical implementation. It should also be noted that optical transparency for such materials is critical, since it is important to collect the signal from the entire volume and not only from the surface.
Normally, barium iodide melts with decomposition at 711°C. Some studies, however, have shown the possibility of the barium iodide-based glass ceramic materials production at higher melting temperatures [21]. Therefore, understanding the processes occurring during this glass ceramics synthesis is important and interesting.
The present work is thus aiming at the development and testing of the reliable and cheap technique for the europium doped barium iodide glass ceramics fabrication. This includes detailed investigation of the glass ceramics synthesis on the basis of the barium iodide powder to glass host ratio. Europium doped barium iodide glass ceramics structural, morphological, luminescent and paramagnetic properties will appear in the crosshair of rigorous investigation by X-rays, optical and electron paramagnetic resonance (EPR) methods. In particular, EPR will check the Eu2+ distribution and incorporation in the crystalline lattice and glass host. With this purpose the samples were prepared employing the two-step approach: primarily synthesized barium iodide particles activated with Eu2+ were immerged into the glass matrix. The proposed technology can also be applied to other alkali-earth halides glass ceramics manufacturing, in perspective.
Experimental procedureBa(NO3)2, Eu(NO3)3·6H2O, NH4HCO3, NH4I, BaCO3 and H3BO3 were used as starting materials. All reagents were of analytical grade. BaI2 was prepared by using 2 stages method described earlier [18]: the first involved the synthesis of the BaCO3:Eu (precursor) converted into the BaI2:Eu in the second stage.
BaCO3:Eu powder was obtained by reverse precipitation. At first the required quantity of 0.1M Eu(NO3)3 solution was added into the 0.2M Ba(NO3)2. It was enough to ensure 2at.% of Ba2+ ions to be replaced by Eu2+. The mixture of nitrates was then added dropwise into 1.2M solution of NH4HCO3 under constant stirring at room temperature. The resulting BaCO3:Eu precipitate was isolated by centrifugation, washed 2 times with distilled water and dried in air at 80°C for 12h. BaCO3:Eu and NH4I powders had been mixed in the agate mortar and then transferred into a quartz boat which was placed into a quartz tube with subsequent argon (Ar) flux for 10min. The tube was then moved into the furnace preheated up to 400°C and annealed at this temperature for 30min under constant Ar flow. After that the sample was spontaneously cooled down to the room temperature (∼50°C/min) in a quartz tube under the Ar flow. The obtained light-gray powder was introduced into a container and sealed tightly. The sample was designated as the “Sample 0”.
The whole process can be described by the following equation:
It should be mentioned that influence of the precursor morphology and Eu-ions concentration on the structural and luminescent properties of the BaI2:Eu powders have been investigated previously [18,22].
To obtain the glass with the composition of 60wt.% BaO and 40wt.% B2O3 the melt-quenching technique was used. H3BO3 was taken with 15% excess. The glass synthesis was carried out in porcelain crucibles within an electric furnace at 1000°C during 1h. The glass melt was cast onto a metal plate. The resulting glass was transparent and colorless.
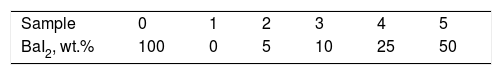
The mixture of BaI2 and BaO-B2O3 glass grinded to the fine powder containing 0, 5, 10, 25, 50wt.% of BaI2 was introduced into a quartz tube ventilated with Ar flux for 10min in the process of the glass ceramics synthesis. The tube was then placed into a furnace preheated to 200°C and held there for 15min to release the crystallization water. Then the 900°C temperature was set for another 15min with the ∼50°C/min heating rate. After the synthesis, the glass ceramics samples were removed from the furnace and cooled down. All stages of the glass ceramic synthesis were carried out in Ar atmosphere. The heating rate was high enough to prevent loses of the barium iodide due to its decomposition. Designations of the samples with different content of the BaI2 powder are listed in Table 1.
X-ray diffraction patterns of the synthesized samples were collected by PANalytical Empyrean X-ray diffractometer with Cu-K(α) radiation source (λ=1.5406Å) in the 2θ range of 10–70°. To prevent the contact of a BaI2 sample with water from atmosphere it was placed in a holder between two polyethylene films (on the X-ray diffraction pattern they show reflections with maxima at 21.6° and 23.8° 2θ). The size of the coherent scattering region (CSR) and microstress values were determined from full width at half maxima (FWHM) of the X-ray diffraction (XRD) lines approximated by the Voigt functions using Williamson–Hall method [23]. Usual corrections for the Cu-K(α) radiation were taken into account. The processing of data was made in Fityk, WinPLOTR-2006 and DICVOL06 programs of FullPROF.
Fourier-transform infrared spectroscopy (FTIR) was carried out using Perkin Elmer spectrometer Spectrum Two with a UATR TWO unit (Diamond), 64 scans, 4cm−1 resolution, between 400 and 4000cm−1.
Morphology of the glass ceramics was studied by scanning electron microscope (SEM) Hitachi SU-70 with the 1000 and 10,000 magnification. To study the BaI2 powder morphology the SEM on a LEO-1420 was used.
Room temperature photoluminescence (PL) measurements were provided by Jobin Yvon Fluoromax 2 spectrofluorimeter. In the case of powder, the PL and photoluminescence excitation (PLE) spectra were collected from ∼1mm-thick layers of powder placed onto a quartz plate.
EPR measurements were carried out in the X-band (∼9.4GHz) with a commercial Bruker X/Q-band E580 FT/CW ELEXSYS spectrometer within the 3.6–296K temperature range using an Oxford Instruments ESR900 continuous flow cryostat. UV irradiation (330nm) was delivered using a mercury high-pressure arc lamp.
Results and discussionThe XRD pattern of the sample 0 is shown in Fig. 1. It exhibits strong reflections characteristic for the BaI2 (Powder Diffraction File (PDF) № 73–1849). The much weaker and broader ones, marked with asterisks, were referred to the BaI2·H2O (PDF № 39–1300). The content of the BaI2·H2O is thus much smaller as compared to the pure BaI2. Obviously, the hydrated iodide is the result of the sample interaction with water vapor.
 are marked with asterisks (*), BaI2·2H2O (PDF № 31–0145) – with (˅), BaI2 (PDF № 73–1849) – with (|), respectively. Broaden reflections with the maxima at 21.6° and 23.8° originate from a polyethylene film. The sample numbers correspond to Table 1.")
XRD patterns of the sample 0 and glass ceramics samples 1–5 with different content of BaI2 powder. The BaI2·H2O reflections (PDF № 39–1300) are marked with asterisks (*), BaI2·2H2O (PDF № 31–0145) – with (˅), BaI2 (PDF № 73–1849) – with (|), respectively. Broaden reflections with the maxima at 21.6° and 23.8° originate from a polyethylene film. The sample numbers correspond to Table 1.
The XRD patterns of the glass ceramic samples with different content of BaI2 powder are shown in Fig. 1. The samples 1–4 are amorphous and do not show any reflections. This is, most probably, because of thermal decomposition of the BaI2 or dissolution by glass matrix during the synthesis process. At any rate the quantity and size of the ceramics particles were below the XRD detection abilities. Oppositely, the reflections originating from pure BaI2 (PDF № 73–1849) were detected in the sample 5. This makes clear evidence for the shielding effect of the glass matrix preventing the BaI2 ceramics from contact with water vapor. However, the presence and domination of BaI2·2H2O (PDF № 31–0145) reflections in the sample 5 were observed (see Fig. 1). The prevalence of BaI2·2H2O phase is, most probably, the result of sample grinding for XRD analysis. The process partly breaks the glass matrix protection (microcrevices occur) exposing the ceramic particles (highly hygroscopic [24]) to the surrounding atmosphere. On the other hand, the simultaneous presence of BaI2 and BaI2·2H2O phases in the sample 5 in contrast to the samples 1–4 can be explained by larger amount of BaI2 powder used in the synthesis process. This could lead to the not fully completed decomposition.
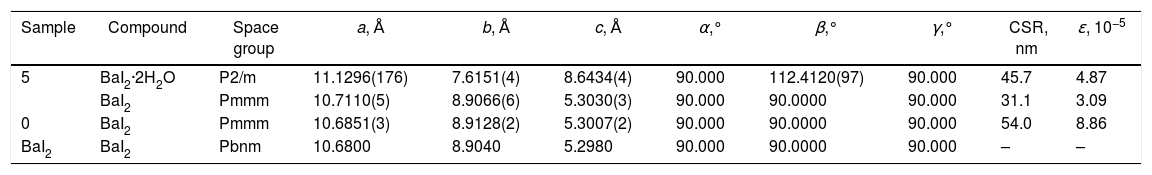
Calculated values of the unit cell parameters, CSR size and microstress (ɛ) are listed in Table 2 for the sample 0 and sample 5. Cell parameters are in a good agreement with the tabulated data (PDF № 73–1849) for the BaI2. Due to the very small content of the BaI2·H2O phase in the sample 0 (see Fig. 1) and its low crystallinity it was unable to perform the calculation of its cell parameters.
Unit cell parameters, CSR sizes and microstress values for the synthesized sample 0, glass ceramic sample 5 and BaI2 (from database).
| Sample | Compound | Space group | a, Å | b, Å | c, Å | α,° | β,° | γ,° | CSR, nm | ɛ, 10−5 |
|---|---|---|---|---|---|---|---|---|---|---|
| 5 | BaI2·2H2O | P2/m | 11.1296(176) | 7.6151(4) | 8.6434(4) | 90.000 | 112.4120(97) | 90.000 | 45.7 | 4.87 |
| BaI2 | Pmmm | 10.7110(5) | 8.9066(6) | 5.3030(3) | 90.000 | 90.0000 | 90.000 | 31.1 | 3.09 | |
| 0 | BaI2 | Pmmm | 10.6851(3) | 8.9128(2) | 5.3007(2) | 90.000 | 90.0000 | 90.000 | 54.0 | 8.86 |
| BaI2 | BaI2 | Pbnm | 10.6800 | 8.9040 | 5.2980 | 90.000 | 90.0000 | 90.000 | – | – |
The obtained values of the unit cell parameters are in agreement with the tabulated data for the BaI2 (PDF № 73–1849) and BaI2·2H2O (PDF № 31-0145) in the sample 5. It can be seen in Table 2, that the values of the glass ceramic BaI2 cell parameters differ from the pure powder, most likely, due to the dissolution in the glass matrix. Estimated CSR and microstress values for the BaI2 phase in the sample 5 are lower by the factors of 1.7 and 2.9, respectively, as compared to the sample 0. This may be in connection with the decreased iodide particles size due to their decomposition or dissolving and rearranging of defects at the stage of glass ceramic synthesis at high temperature.
The whole decomposition process may be described by the following equations:
The presence of O2 in the samples is, most probably, related to the surface absorption from air during the procedure of the glasses grinding.
On the other hand, the microstress value of the BaI2 phase is lower approximately 3 times in the sample 5 as compared to the sample 0. It cannot be explained solely by the BaI2 decomposition since the glass ceramics synthesis is carried out at higher temperatures. Therefore, one could assume the BaI2 particles formation from BaO and H[I(I2)] or HI presented in the glass ceramics and as a result having more rigid packing than the sample 0. This assumption may be partially confirmed also by the same XRD patterns of the sample 5 and sample 0 (see Fig. 1). It is partially confirmed also by the changed BaI2 particles morphology (discussed further in text).
The FTIR spectra measured in the samples 0–5 as well as in BaCO3:Eu are shown in Fig. 2(a). The BaCO3 sample exhibits absorption bands at 853 and 1426cm–1 related to the CO32− groups. The FTIR spectrum of the sample 0 [see Fig. 2(b)] demonstrates strong absorption peaks with the maxima at around 1605cm–1 and in the 3000–3700cm–1 range, due to stretching and bending vibrations of water molecules, respectively. This makes evidence for the BaI2·H2O hydrated phase existence. Weak absorption band with the maximum at ∼1400cm−1, most probably, belongs to the CO32− group presented in the form of BaCO3 (see Fig. 2). This is an evidence for the incomplete process described by Eq. (1).
 FTIR spectra of the samples 1–5; (b) FTIR spectra of the sample 0 and BaCO3.")
Peaks characteristic for water molecules, and others, of lower intensity, were detected within the 700–1400cm−1 range in the sample 5. They were associated with the oscillations of bonds in the CO2, NH3, CO32−, IO3− and BaO [25] being residuals of the starting materials and/or by-products of the BaI2 and glass ceramics synthesis. The CO2 and NH3 were released during the BaI2:Eu synthesis according to Eq. (1); the CO32− groups are the part of the BaCO3, one of chemicals used for the glass production; the BaO is a glass network component and the IO3− groups were created as the product of the iodide oxidation [26]. The BaI2 bonds vibrations in the samples 0–5 are situated in the unreachable range of FTIR (<200cm−1).
Absorption spectra of the samples 0, 4 and 5 are demonstrated in Fig. 3. The band peaking at 360nm can be attributed to the I3− ions as described in previous work [18]. It is stronger in the sample 5 as compared to the sample 4 because the former contains much larger amount of the BaI2 phase. The more I2 is thus expected to release during the decomposition of the BaI2 in the synthesis process or during the glass ceramics storing. The I3− accumulation in the glass ceramics may also occur in the process described in Eqs. (2)–(4).
 and 4% iodine solution in the solvent.")
SEM images of the samples 0, 4 and 5 are shown in Fig. 4. It can be seen that the sample 0 consists of the 1–2μm large aggregates densely packed [see Fig. 4(a, b)] whereas the sample 4 and sample 5 exhibit presence of distinct inclusions (marked with yellow arrows) largely spaced. They appear to be spherical in the sample 4 with the average diameter of 500nm [see Fig. 4(c, d)]. Oppositely, the particles are smaller of rather irregular shape in the sample 5 [see Fig. 4(e, f)]. Moreover, they have tendency to coalesce, creating relatively large agglomerations which size is ranging from approximately 0.5 to 2μm. On the basis of XRD analysis above proving the presence of the BaI2 in the samples 4 and 5, the observed particles were deduced to be the BaI2 ceramic grains. Smaller size and ragged edges of the ceramic grains in the sample 5 can be the result of the BaI2 dissolution specifics in the glass matrix as compared to the Sample 0 (see the microstress values above). Besides, cracks and round-shaped pores [or bubbles, marked with blue arrows in Fig. 4(f)] of the 2–2.5μm size were observed in the sample 5. They are formed due to intensive isolation of the gaseous products during the synthesis process. Note, that the samples 1–3 do not demonstrate the particles presence in the glass matrices at all. This is expected to be the result of their total decomposition or dissolution by glass matrix.
, 4 (c, d), and 5 (e, f). Yellow arrows point out ceramic particles whereas the blue ones indicate cracks and pores (bubbles).")
The PL and PLE spectra of the sample 0 are shown in Fig. 5. The broad PLE band within the 255–400nm was referred to the Eu2+ 4f→5d transition according to [27].
 and PL spectra (λex=320nm and λex=393nm) for the BaI2:Eu2+ powder. The PL spectrum for the λex=393nm was 400 times magnified.")
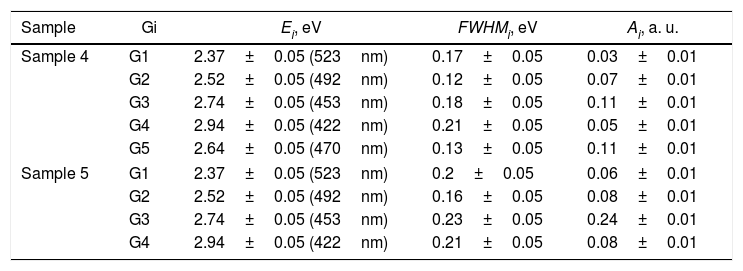
A PL spectrum in the sample 0 (λex=320nm) is composed of a single narrow band with nearly symmetric lineshape centered at 415nm. It has been referred to the inter-configurational 4f65d1→4f7 radiation transition of the Eu2+ in the BaI2 structure [18]. Very weak Eu3+ spectrum (λex=393nm), its intensity is 400 times lower than that of the Eu2+, was resolved due to specific and commonly known transitions (see Fig. 5). This indicates insignificant amount of the Eu3+ present in the barium iodide sample [22,28]. PLE and PL spectra measured in the samples 4 and 5 are shown in Fig. 6(a) and (b) normalized to the maximum signal intensity in the sample 5 (naturally stronger because of 2 times increased BaI2 content as compared to the sample 4). Normalized to the maximum amplitude they are shown in Fig. 6(c). The spectra are obviously complex. For example, in the sample 4 PL spectrum at least five strongly overlapped bands can be distinguished whereas in the sample 5 only four compared to the sample 0 (see Fig. 5). To resolve the single components, the experimental spectra have been fitted with the sum of standard Gaussian peaks according to the expression: Gi=Ai/FWHMiπ/4ln2exp−4ln2((E−Ei)2/FWHMi2), where Ai, Ei and FWHMi are the area under the single curve, maximum energy, and full width at half maximum, respectively. It is shown in Fig. 7. The parameters of fit are listed in Table 3. It seems that the spectra have G1–G4, four components in common, whereas the fifth one, G5, is specifically present only in the sample 4. The bands are narrower in the sample 4 except for the G4 one, which is more or less the same in both cases. Since the correlation between these PL peaks (except for the G5) intensity and the BaI2 content was observed [see Fig. 6(a,b)], all the G1–G4 peaks were attributed to the Eu2+ in different local environments. It is known that the spectral position of the Eu2+ luminescence, in general, depends on its local ligand surrounding [29,30]. The rest of samples exhibited no PL signals.
 PLE (λem=465nm) and (b) PL spectra (λex=360nm) of the samples 4 and 5 normalized to the amplitude in the sample 5. (c) PL spectrum in the samples 4 and 5 normalized to the maximum amplitude each.")
 and sample 5 (b) into components by calculated Gaussians (G1–G5) and their sums (∑Gi).")
The 422nm peak which remains the same as to the FWHM in both samples (G4, Table 3) can be attributed to the Eu2+ emission from the BaI2 and/or BaI2·nH2O structures (n=1,2) in the glass ceramics [31]. Its 7nm shift with respect to the sample 0 (maximum at 415nm) is almost within the 5nm instrumental error of the spectrometer. However, the structural modification of the BaI2-based particles in the glass matrix obviously affecting cell parameters values (Table 2) can also be the factor affecting Eu2+ emission spectral position. The shift of the excitation wavelength from 320nm (for sample 0) to 360nm (for samples 4 and 5) has been observed. The 453nm band (G3, Table 3) has been referred to the Eu2+ in EuI2 phase [32,33] the expected byproduct of the glass ceramics synthesis according to Eq. (1)[32]. It is red shifted by approximately 13±5nm off the regular Eu2+ emission observed in the EuI2 at 440nm [33]. In general, its position is sensitive to external pressure [32]. Therefore, the offset can be expected to be due to the structural modification mentioned above. Lack of the characteristic EuI2 reflections in XRD patterns (see Fig. 1) could be explained by the low phase content in the sample, below the sensitivity level. The 523nm peak (G1, Table 3) may originate from the Eu2+ ions perturbed by, for instance, Eu3+ in some structure, maybe some kind of the BaxEu1–xI2 solid solution. The 515nm peak has been reported previously in the EuI2 as the regular Eu2+, probably disturbed by the Eu3+[33].
Gaussian parameters obtained from fit in Fig.
| Sample | Gi | Ei, eV | FWHMi, eV | Ai, a. u. |
|---|---|---|---|---|
| Sample 4 | G1 | 2.37±0.05 (523nm) | 0.17±0.05 | 0.03±0.01 |
| G2 | 2.52±0.05 (492nm) | 0.12±0.05 | 0.07±0.01 | |
| G3 | 2.74±0.05 (453nm) | 0.18±0.05 | 0.11±0.01 | |
| G4 | 2.94±0.05 (422nm) | 0.21±0.05 | 0.05±0.01 | |
| G5 | 2.64±0.05 (470nm) | 0.13±0.05 | 0.11±0.01 | |
| Sample 5 | G1 | 2.37±0.05 (523nm) | 0.2±0.05 | 0.06±0.01 |
| G2 | 2.52±0.05 (492nm) | 0.16±0.05 | 0.08±0.01 | |
| G3 | 2.74±0.05 (453nm) | 0.23±0.05 | 0.24±0.01 | |
| G4 | 2.94±0.05 (422nm) | 0.21±0.05 | 0.08±0.01 | |
The 492nm band (G2, Table 3) was expected to originate from the glass or the ceramics-glass boundary because of the barium iodide dissolution. Particles dissolving strongly affect the glass medium composition initially close to a single particle, modifying it. This process is caused by the diffusion of dissolved components from particle to the glass matrix and depends on the glass viscosity as a function of temperature [34]. This area can be imagined as boundary crust or buffer area between the glass matrix and the particle. The Eu2+ PL spectrum measured in the BaO-CaO·2SiO2:Eu(1at.%) glass systems [35] was spread over approximately 400–600nm region centered at about 450–500nm (depended on the glass composition).
The origin of the G5 peak at 470nm is rather obscure. It is totally absent (or hidden with lowered intensity) in the sample 5. The G5 could be produced by the Eu2+ ions inside the glass medium nearest to the particle (boundary crust or buffer area) or by some defect, for example, oxygen centers, originating from the samples hydrolysis either with their own crystallization water or the water released during the synthesis in accordance with Eq. (1)[18,36,37]. Remarkably, according to the single Gaussians areas listed in Table III, the G3 band is dominating in the sample 5 and nearly dominating in the sample 4, where the G5 is of the same strength. It is clearly seen in Fig. 7 as well. This can be the sign of relatively strong dissolution of the BaI2:Eu in the glass matrix unless the Eu2+ emission is concentration quenched in the ceramics particles.
To study the Eu2+ ions incorporation into the BaI2 lattice and the glass matrix in the glass ceramics EPR method was used. EPR spectra of the glass ceramics samples 1–5 are shown in Fig. 8.
 and ceramic part are indicated. Rhombic Fe3+ signals are also indicated. “u.o.” means unknown origin of some unexpected impurity.")
All the spectra contain some signals obviously coming from unexpected impurity of unknown origin (“u.o.”). Besides, they demonstrate the presence of the signals characteristic for rhombic Fe3+ observed at the specific g factors, g1=4.3 and g2=9.3 (for more details see e.g., [38]). The presence of the rhombic Fe3+ can be explained by the use of porcelain crucibles (Fe2O3 can be found in such materials [39]) for the glass synthesis.
Note, that the glass ceramics with low content (<25%) of the barium iodide demonstrates no visible Eu2+ signals except the sample 1 as it is shown in Fig. 9. It exhibits some weak resonances which might be attributed to the Eu2+-like signals if compared with the BaI2:Eu (20%) powder [18] within the 2500–4000 magnetic field range. However, it is hard to proof on the basis of the presented data. The observed signals could originate not from the glass ceramics but from the BaI2 powder remnants “stuck” to the glass ceramics sample.
![EPR spectra measured in glass ceramics samples 1 and 5, BaI2:Eu(20%) powder [18] and CaO·2SiO2:Eu(1at.%) glass [35] at T=100K.](https://static.elsevier.es/multimedia/03663175/0000006000000005/v1_202110020728/S0366317520300492/v1_202110020728/en/main.assets/gr9.jpeg?xkr=ue/ImdikoIMrsJoerZ+w997EogCnBdOOD93cPFbanNd3TCEZuNxhudow/+3Hrh9WJc+mtnYSSPL9K6mfMWVj1nTDsSZai1uLBBDaAaw1rqvLn2RZOmntb0O96dYT65Je+dBa3SOxNHb/LHWJHYNGE7eGgKYRblLJhzHpR6BpfQj2A4J4f7mseRL38Gxd0Nk+3I6zRCjdWGc9ZlfsSCbDiRmr4rGdCXv854Ju50iyv/sxj5BhndBaIFrR1dQrWrviNnGZ8Es2TGrCta7dqGpq0eLDMPB9jpapTWVFtX8ZTzvwqlW4n76P6d7+kKj2n/yl "EPR spectra measured in glass ceramics samples 1 and 5, BaI2:Eu(20%) powder [18] and CaO·2SiO2:Eu(1at.%) glass [35] at T=100K.")
The sample 5 exhibits Eu2+ spectrum typical for glass (see Fig. 9). The spectrum measured in CaO·2SiO2:Eu(1at.%) glass [35] is shown in contrast as well. It is not excluded that, some signals may come from the BaI2 particles, however, strongly overlapped with the dominating glass ones. This may also confirm, at least, partial dissolution of the BaI2 particles in the glass matrix or partial decomposition on the BaI2 and EuI2, discussed in detail above. The Eu2+ EPR signal from the EuI2 is expected to be very broad because of strong dipolar and exchange interactions [38], lost in the background. Fig. 10 demonstrates clearly the presence of the glass Eu2+ spectrum also in the sample 4 if one could judge from the transition at about 1250G emphasized with a dashed vertical line. But it should have approximately 20 times lower intensity.

To examine other possible europium ions charge state and incorporation in the “really” europium containing sample 5 it has been exposed to 442nm laser irradiation. The corresponding spectra are shown in Fig. 11.
. All spectra have been measured at T=25K in turn.")
Remarkably, the irradiation with the 442nm laser forces the Eu2+ glass spectrum to lose its initial intensity. The spectrum measured 10min after the irradiation shows the same signal as the one measured immediately after the irradiation. Annealing at 250K for 5min then results in partial recover of the intensity but not to the full measure. Even after two days at RT the same spectrum as the one obtained after the annealing at 250K was measured. The only way to observe such changes is the partial Eu2+→Eu3+ charge transfer in the glass matrix.
No signals which might be attributed to paramagnetic oxygen centers, like O− defects (see e.g. [40,41]) were observed in EPR spectra (see Fig. 8). Predominating Eu2+ glass spectra make evidence of the BaI2:Eu strong decomposition in the glass matrix.
ConclusionsThe paper reports a common approach to the Eu2+-doped glass ceramics synthesis from the BaI2:Eu powder. Different levels of the BaI2 content were tried but, unfortunately, only the samples nominally supplied by the 25 and 50wt.% appeared to demonstrate its presence as well as hydrated barium iodide by direct observation of the corresponding XRD reflections. The presence of BaI2 particles inside the glass matrix was also confirmed by SEM. Increased rigidness of the particles in the glass ceramics has been proven by microstress measurements (ɛ becomes approximately 3 times lower in the glass ceramics than in the barium iodide powder itself).
Photoluminescence spectra are single band in the BaI2:Eu powder. However, they are getting very complex, composed of at least 5 bands in the 25wt.% BaI2 and 4 bands in the 50wt.% BaI2 samples: 422nm, 453nm, 492nm, 523nm common for both samples and the 470nm one, observed only in the 25wt.% BaI2. The 422nm band was referred to the Eu2+ in the BaI2 particles. Other bands were referred either to the Eu2+ in EuI2 (byproduct of the glass ceramics synthesis) or glass matrix (glass-ceramics boundary), or some non-paramagnetic oxygen-related centers. The 453nm band is dominating in both samples indicating strong possibility of the BaI2 dissolution in the glass. No PL signals were measured in other glass ceramics with the BaI2 content lower than 25wt.%.
EPR measurements report the presence of the Eu2+ ions in the samples with the 25 and 50wt.% of BaI2. They are very strong and clearly resolved only in the latter exhibiting features characteristic for glass. This also benefits to the supposition of the BaI2 decomposition and Eu2+ ions incorporation into the glass matrix or ceramics-glass boundaries especially in the 25wt.% BaI2 sample where the ceramics particles are ball-shaped. Nevertheless, some small amount of the Eu2+ is expected to be located in the BaI2 ceramic particles in the glass. Their signal is getting lost in the background of the strong transitions of the Eu2+ ions in the glass. The 442nm laser light irradiation resulted in decrease of the Eu2+ intensity obviously engaging the permanent Eu2+→Eu3+ charge state transformation. The glass ceramics samples contained also rhombic Fe3+ which EPR intensity is dependent on the BaI2:Eu content. It was explained by the inclusion of the BaI2 particles and partial decomposition of the barium iodide in the glass matrix along with the Fe3+→Fe2+ charge state transformation caused by the Eu2+→Eu3+ oxidation or the decomposition of the I3− to I2 or similar.
In general, the possible mechanism of the BaI2:Eu glass ceramics fabrication was proposed and analyzed in detail. It is expected to be applicable to the synthesis of glass ceramic materials based on the wide range of other halide compounds after appropriate modification. The proposed approach can be subsequently expanded to obtain other promising materials, such as SrI2, CaI2, MgI2, LaBr3 in the glass ceramics form, but this requires understanding of the processes that occur during the glass ceramics preparation. Even despite the long duration of glass ceramics synthesis, technologically it is still simpler and less expensive than growing a single crystal or producing optically transparent ceramics.
Authors gratefully acknowledge the financial support of the Belarusian State Program of Scientific Research “Photonics, opto- and microelectronics” (№ 1.2.03), the Ministry of Education, Youth and Sports of Czech Republic under projects LO1409 and CZ.02.1.01/0.0/0.0/16_013/0001406 and mobility project “Development and enhancement of luminescent materials for multipurpose applications” of Czech Academy of Sciences and National Academy of Sciences of Belarus (№ NASB-20-03).

