


The residual dyes from different sources are considered a wide variety of organic pollutants introduced into the natural water resources. One of the main sources with severe pollution problems worldwide is the textile industry and its dye-containing wastewaters. The aim of this study was the photocatalytic degradation of the azoic dye “Orange II” using Mn, Cu and Fe modified titania. The catalysts were prepared by two different methods, sol–gel and an impregnation method in a commercial titania (Degussa P25), after drying the samples were calcined at 400°C. The samples were characterized by BET method for surface area measurement (SBET), XRD, Raman spectroscopy, XPS, UV–vis spectroscopy by diffuse reflectance technique and its photocatalytic activity was evaluated in the degradation of the azo dye Orange II in aqueous solutions using the Langmuir–Hinshelwood model. The catalysts prepared by sol–gel method exhibit a larger surface area than the prepared by impregnation and the introduction of the oxides leads to a slight reduction of SBET. The sol–gel samples show lower photoactivity than the impregnated samples due to the presence of both anatase and rutile phases in these powders, the phase junction anatase–rutile facilitate transfer of the photogenerated electron from the conduction band of the rutile phase to the trapping sites on the anatase surface and prevents the electron–hole recombination and allows the holes generated to move to the surface of the catalyst. XRD, Raman, XPS and UV–Vis data show that the metallic cations are incorporated in the titania lattice in greater extend in SG samples while remain dispersed on the surface in impregnated samples. Although the entrance of metallic cations in solid solution enhance the photocatalytic activity due to the enhanced formation of electrons–hole pairs, at a high doping content, a large number of structural defects are induced serving as a recombination center of electron–hole pairs and sol–gel samples show higher photoactivity than impregnated samples, except in the case of Fe modified samples that shows the higher red shift with Eg=1.8eV and compensate the induced recombination center of electron–hole pairs.
Los tintes orgánicos residuales de la industria textil suponen una amplia variedad de contaminantes orgánicos introducidos en los recursos hídricos naturales. Una de las fuentes principales con graves problemas de contaminación en todo el mundo es la industria textil y las aguas residuales que contienen estos tintes. El objetivo de este estudio fue la degradación fotocatalítica del tinte azoico «Naranja II» utilizando óxido de titanio modificado con Mn, Cu y Fe. Los catalizadores se prepararon mediante dos métodos diferentes, sol-gel y un método de impregnación en un óxido de titanio comercial (Degussa P25), después de secar las muestras se calcinaron a 400°C. Las muestras se caracterizaron por el método BET para la medida de la superficie específica (SBET), XRD, espectroscopia Raman, XPS, espectroscopia UV-vis mediante la técnica de reflectancia difusa y se evaluó su actividad fotocatalítica en la degradación del colorante azoico Orange II en soluciones acuosas utilizando el modelo de Langmuir-Hinshelwood. Los catalizadores preparados por el método sol-gel presentan una superficie específica mayor que la preparada por impregnación y la introducción de los óxidos conduce a una ligera reducción de la SBET. Las muestras de sol-gel muestran una fotoactividad más baja que las muestras impregnadas debido a la presencia de anatasa y rutilo en estos polvos, la unión de fase anatasa-rutilo facilita la transferencia del electrón fotogenerado de la banda de conducción de la fase rutilo a los sitios de captura en la superficie de anatasa y evita la recombinación de los pares electrón-hueco permitiendo que los huecos generados se muevan hacia la superficie del catalizador. Los datos de XRD, Raman, XPS y UV-Vis muestran que los cationes metálicos se incorporan en la red de óxido de titanio con mayor amplitud en las muestras SG, mientras que permanecen dispersos en la superficie en muestras impregnadas. Aunque la entrada de cationes metálicos en solución sólida mejora la actividad fotocatalítica debido a la más fácil producción de pares electrón-hueco, con un alto contenido de dopante, se inducen una gran cantidad de defectos estructurales que sirven como centro de recombinación de pares electrón-hueco. Las muestras sol-gel muestran una fotoactividad más alta que las muestras impregnadas, excepto en el caso de muestras modificadas con Fe que muestran un mayor desplazamiento al rojo con Eg=1.8eV y compensan el centro de recombinación inducida de pares electrón-hueco.
Since the industrial revolution, the manufacturing processes have become more efficient and productive and science has become much more advanced, thus leading to an improvement in the quality of human life. On the other hand, all the advancement and development witnessed have also brought with them a wide spectrum of problems, water pollution being one of them. The wastewater poses serious threats to human health and the environment. Concretely, the textile industry is one of the huge sources of water pollution. This industry generates highly toxic chemical concentration at every step in the production process, as the dyes are occupying an important class of these pollutants. The synthetic dyes are toxic to aquatic life, reduce photosynthesis, carcinogenic, mutagenic and some of them make allergy, dermatitis and skin irritation to human [1,2]. Also, the chemical structures of dyes vary enormously, and some have complicated aromatic structures that resist degradation in conventional wastewater treatment processes [3–5]. In this regard, various treatment techniques have been developed over the last decade, among of them, heterogeneous photocatalytic.
The photocatalytic oxidation based on semiconductor material is greatly efficient and environmentally friendly processes for various wastewater treatments. Accordingly, in the present study TiO2-based catalysts were synthesized for the degradation of the azoic dye “Orange II”. Titania (TiO2) is widely used for the removal of highly toxic and non-biodegradable pollutants frequently presents in wastewater by means of photocatalysis. Sol–gel method has been widely used to synthesize versatile titania in powder or thin films coatings photocatalyst [6–10]. However, the photocatalytic activity of TiO2 is limited, due to its wide band gap property of absorbance only in short wavelength. Recently, several studies have shown that the presence of some transition metals enhances the photoactivity of titania in the degradation of organic pollutants and that the photoactivity of these materials depends strongly on the character and the concentration of the employed dopant [6–11].
The textile industry uses more than 30,000 different compounds, of which more than 10,000 are dyes. Among the dyes, the azoics are the most common since they account for 60–70% of the total dyes used. Its degradation by conventional methods is complicated among other reasons because of its low water solubility. Although conventional treatments with oxidants often allow the complete discoloration of textile effluents, however, they do not achieve complete mineralization. Photocatalysis allows completely discoloring and mineralizing this type of dyes [12]. The mechanism of degradation of degradation of Orange II is well described in the literature. The oxidative attack on the azo group produces benzene sulfonate and naphthoquinone in the first phase. Likewise, more complete studies identify up to 22 transformation intermediates of Orange II that include 2-naphthol, 2-hydroxy-1,4-naphthoquinone, small aromatics such as phthalic acid and phthalimide and aliphatic acids such as fumaric, succinic, maleic and Malonic [13,14].
Although titania metal doping and the sol–gel route of synthesis are well known on Orange II photocatalytic degradation, usually the method is not compared with the introduction of metal doping to a recognized commercial photocatalyst using similar characterization techniques. In this study the sol–gel method is compared with the introduction of metal doping to Degussa P25 titania by an impregnation method in order to evaluate the efficiency of the method. In this sense, this paper focuses on the photocatalytic activity of pure and modified titania in the removal of Orange II (OII) in aqueous solution. Concretely, the aim of the present study is to prepare Mn, Cu and Fe modified titania, following two different methods: sol–gel and impregnation, in order to investigate the influence of the preparation method on their physico-chemical properties and their activity in photocatalytic oxidation of OII.
ExperimentalPreparation of catalystsTwo types of TiO2 were used in this study: the commercial Degussa P25 titania (TiO2-P25) and another one prepared by a sol–gel procedure (TiO2-SG).
TiO2-SG was prepared from titanium (IV) isopropoxyde according to the following molar ratios: Ti(C12H28O4):6 C2H5OH:16 H2O. Thus, the solution of water and ethanol was prepared. Then, an amount of Ti(C12H28O4) was added dropwise using a syringe to avoid absorption of moisture from the atmosphere, while stirring continuously until gel formation. This gel was aged at constant temperature (70°C), during 4h. The resulting gels were dried at 110°C for 24h and calcined at 400°C for 12h, using a heating rate of 10°Cmin−1. It is worth noting that the pH was adjusted to 3 by adding nitric acid (HNO3).
Mn, Cu and Fe modified TiO2 were prepared by two different methods: sol–gel and impregnation, in order to evaluate the effect of the preparation method on the chemical and textural properties of the elaborated catalysts.
Mn/TiO2-SG, Cu/TiO2-SG, Fe/TiO2-SG samples prepared by a sol–gel process were obtained adding, respectively, aqueous solutions of Mn(NO3)2·4H2O, Cu(NO3)2·2.5H2O and Fe(NO3)3·9H2O to the Ti(C12H28O4) in H2O/HNO3 solution. The metal content in the samples was of 5wt.%. The rest of the process is the same used for the preparation of the pure TiO2-SG. The obtained catalysts were calcined at 400°C for 12h (10°Cmin−1).
Mn/TiO2-I, Cu/TiO2-I and Fe/TiO2-I catalysts were synthesized by the impregnation method. 5g of a commercial titania (Degussa P25, 83% anatase and 17% rutile) was dispersed in 100ml of 0.04mol/L solutions of Mn(NO3)2·4H2O, Cu(NO3)2·3H2O and Fe(NO3)2·9H2O respectively. The metal loading was of 5wt.%. The suspension was kept under stirring during 24h at room temperature. Then, the samples were dried overnight at 110°C and calcined at 400°C for 12h, with a heating rate of 10°Cmin−1.
Catalysts characterizationThe textural properties of the catalysts have been determined by N2 adsorption at −196°C, on a fully automated Micromeritics 3-Flex Surface Characterization Analyzer. The specific surface area (SBET) was obtained by applying the BET method to the experimental N2 adsorption data.
The X-ray diffraction patterns of the catalysts were recorded on an X’Pert Pro MPD diffractometer from Panalytical, powered by a PW3040/60 X-ray generator and fitted with a Cu Kα radiation source (wavelength Kα1=1.54060Å, Kα2=1.54443Å), a step size of 0.06° 2θ/s and time step of 120s and a 2θ range of 5–90° which operated at 45kV and 40mA. The lattice parameters (a and c) can be equated for the tetragonal system (a=b≠c) as follows:
where d is the interplanar distance and h, k and l are the Miller indices. The average crystal size for TiO2 was estimated by application of the Scherrer equation [15] to the (101) anatase diffraction peak and (110) of rutile. Furthermore, the content of anatase and rutile was calculated according the Spurr–Myers equation [16].
Raman spectra were recorded on a FRA 106/S FT-Raman spectrometer, covering a spectral range of 36–3600cm−1 for stokes and 100–2000cm−1 for anti-stokes. This equipment has a near infrared excitation laser source (Nd-YAG) and a high sensitivity liquid N2-cooled Ge.
X-ray photoelectron spectroscopy was performed with a K-ALPHA spectrometer (Thermo Scientific). All spectra were collected using Al-Kα radiation (1486.6eV), monochromatized by a twin crystal monochromator, yielding a focused X-ray spot with a diameter of 400nm, at 3mA×12kV. The alpha hemispherical analyser was operated at the constant energy mode with survey scan pass energies of 200eV to measure the whole energy band and 50eV in a narrow scan to selectively measure the particular elements. Charge compensation was achieved with the system flood gun that provides low energy electrons and low energy argon ions from a single source. The powder samples were pressed and mounted on the sample holder and placed in the vacuum chamber. Before recording the spectrum, the samples were maintained in the analysis chamber until a residual pressure of ca. 5×10⁻⁷Nm−2 was reached. The quantitative analysis was estimated by calculating the integral of each peak, after subtracting the S-shaped background, and by fitting the experimental curve to a combination of Lorentzian (30%) and Gaussian (70%) lines.
The UV–vis spectroscopy analysis was carried out in a JASCO V-670, UV–vis–NIR spectrophotometer equipped with an integrating sphere diffuse reflectance accessory, using BaSO4 as reference scatter. The spectra were taken in the wavelength range of 200–800nm. The band gap energy of catalysts was calculated by Tauc plot [17].
Photocatalytic activity testsThe photoactivity of the samples has been evaluated in the degradation of the azo dye Orange II in aqueous solutions. The photocatalytic tests were carried out adding a catalyst loading of 0.5g/L to an OII solution of 0.6×10⁻⁴mol/L, which has been prepared dissolving an amount of C16H11N2NaO4S in a pH 7.42 phosphate buffer media (NaH2PO4, H2O 3.31g and Na2HPO4, 7H2O 33.77g solved in 1L of water). The UV irradiation source was a mercury lamp of 125W emitting in the range 254–365nm. Before measuring, the suspensions were first stirred in the dark during 15min to reach sorption/desorption equilibrium. The evolution of reaction was followed taking samples every 15min. Orange II concentrations in the different sample were determined by means of UV–vis spectroscopy at 485nm. The commercial TiO2 Degussa P25 was used as reference of comparison with the home prepared samples.
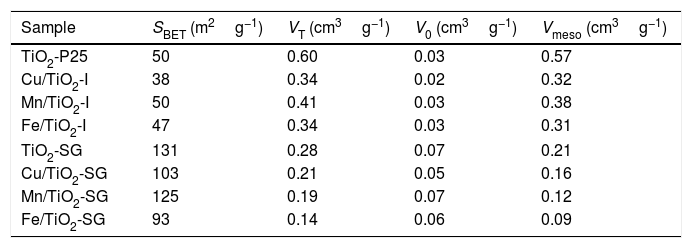
Results and discussionsCharacterizationTextural propertiesTable 1 reports the textural properties of all the samples, obtained from the N2 isotherms at −196°C (not shown). The catalysts prepared by sol–gel method exhibit a larger surface area than their counterparts prepared by impregnation. Indeed, the surface area of all the sol–gel catalysts is almost three times higher than that found for the same samples prepared by impregnation. Moreover, it can be seen that the introduction of the oxides leads to a slight reduction of the surface area accompanied, as expected, with a decrease in the micro and mesopores volumes, can be due to a partial obstruction of TiO2 pores by the metal particles [18,19].
Textural properties of the catalysts.
| Sample | SBET (m2g−1) | VT (cm3g−1) | V0 (cm3g−1) | Vmeso (cm3g−1) |
|---|---|---|---|---|
| TiO2-P25 | 50 | 0.60 | 0.03 | 0.57 |
| Cu/TiO2-I | 38 | 0.34 | 0.02 | 0.32 |
| Mn/TiO2-I | 50 | 0.41 | 0.03 | 0.38 |
| Fe/TiO2-I | 47 | 0.34 | 0.03 | 0.31 |
| TiO2-SG | 131 | 0.28 | 0.07 | 0.21 |
| Cu/TiO2-SG | 103 | 0.21 | 0.05 | 0.16 |
| Mn/TiO2-SG | 125 | 0.19 | 0.07 | 0.12 |
| Fe/TiO2-SG | 93 | 0.14 | 0.06 | 0.09 |
Fig. 1 shows the XRD patterns for the different catalysts. Commercial titania (TiO2-P25) pure and modified with Cu, Mn and Fe show the characteristic peaks of the anatase and the rutile phases, with a larger proportion of anatase [20–22]. However, the sol–gel catalysts show only broad and little intense bands attributed to the anatase phase [16]. For the modified catalysts, no metallic oxides diffraction peaks were observed, suggesting a good dispersion of the metal species on the catalyst surface.

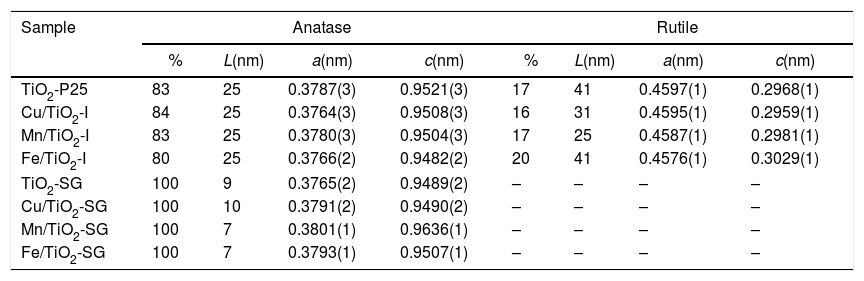
The TiO2 crystallite sizes estimated from Scherrer's equation from the (101) and (110) reflections of anatase and rutile, respectively, are summarized in Table 2. It can be seen that the sol–gel method leads to catalysts with a much lower particle size of titania compared with that obtained for their counterparts prepared by impregnation. These catalysts show only the anatase phase with a small particle size which explains the high superficial area. On the other hand, the XRD diffractograms of all the modified samples, both those prepared by impregnation and sol–gel method, show a slight shift of the peaks toward lower 2θ values as compared with pure titania in the case of SG samples which can be associated with the incorporation of the large transition metal ions in the TiO2 lattice generating some perturbation in the crystalline structure of the latter [23]. Furthermore, there is a clear variation of the parameters a and c of TiO2 unit cell after the modification that are presented in Table 2. For SG samples a and c lattice parameters increase with the incorporation of the metallic cations into the titania network, producing changes in unit-cell parameters as a consequence of the different sizes of these cations and Ti4+. For impregnated samples I the change in lattice parameter is small and tending to lower values [23,24].
Phase composition, TiO2 average crystallite size and lattice parameters (a and c) of the unit cell of all the catalysts.
| Sample | Anatase | Rutile | ||||||
|---|---|---|---|---|---|---|---|---|
| % | L(nm) | a(nm) | c(nm) | % | L(nm) | a(nm) | c(nm) | |
| TiO2-P25 | 83 | 25 | 0.3787(3) | 0.9521(3) | 17 | 41 | 0.4597(1) | 0.2968(1) |
| Cu/TiO2-I | 84 | 25 | 0.3764(3) | 0.9508(3) | 16 | 31 | 0.4595(1) | 0.2959(1) |
| Mn/TiO2-I | 83 | 25 | 0.3780(3) | 0.9504(3) | 17 | 25 | 0.4587(1) | 0.2981(1) |
| Fe/TiO2-I | 80 | 25 | 0.3766(2) | 0.9482(2) | 20 | 41 | 0.4576(1) | 0.3029(1) |
| TiO2-SG | 100 | 9 | 0.3765(2) | 0.9489(2) | – | – | – | – |
| Cu/TiO2-SG | 100 | 10 | 0.3791(2) | 0.9490(2) | – | – | – | – |
| Mn/TiO2-SG | 100 | 7 | 0.3801(1) | 0.9636(1) | – | – | – | – |
| Fe/TiO2-SG | 100 | 7 | 0.3793(1) | 0.9507(1) | – | – | – | – |
Fig. 2 shows the Raman spectra of the different samples. All the catalysts exhibit four Raman bands with peaks, approximately, at 145, 390, 510 and 640cm−1. According to the literature, the first one which is the most intense is assigned to the Eg of an O–Ti–O type bending vibration while the other bands are related to B1g, (A1g+B1g) and Eg modes, respectively [21,25,26]. Additional Raman band which appear as broad and poorly defined shoulder can be seen in some spectra at 200cm−1 that can be attributed to Eg anatase mode [23]. Compared to pure TiO2, the most intense Eg Raman peak at 145cm−1 for all the modified catalysts exhibits a shift toward higher wavenumbers and also suffers a change in its symmetry and broadness, this behavior is clearer in SG samples. This could indicate that the titania lattice is modified after the addition of transition metals in agreement with XRD results and suggest the formation of a structure of mixed oxides created probably by the substitution of Ti4+ by Cu, Fe and Mn cations in titania lattice in a greater extent in SG samples [21,23].
X-ray photoelectron spectroscopy
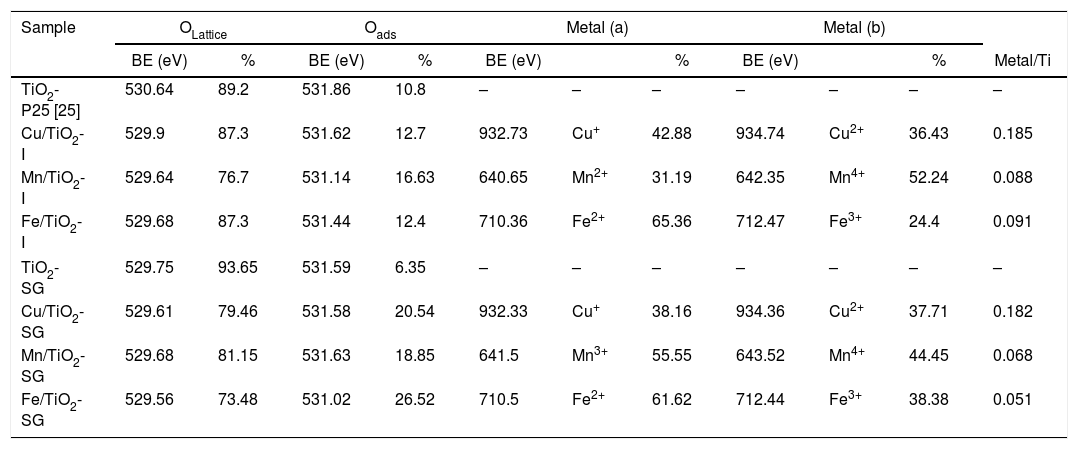
Surface characterization of the samples was carried out by XPS analyses. The XPS spectra of O1s are shown in Fig. 3, which can be fitted by three peaks: lattice oxygen OLattice (529.56–529.9eV), chemisorbed oxygen Oads (531.02–531.63eV) and hydroxyl groups (533.14eV) due to moisture [27–29]. Moreover, the concentrations of OLattice and Oads on the surface of each catalyst sample are calculated and presented in Table 3[30]. According to these results, there is a sharp increase in the percentage of chemisorbed oxygen on the surface of TiO2 catalyst after the modification by oxides, in a greater extent in SG samples, which clearly depends to the oxygen vacancies generated by the introduction of metallic oxides. Indeed, the relative surface oxygen composition plays a key role in the catalytic activity. Where, Oads species have higher mobility than lattice oxygen, and some authors correlate the higher amount of HO− groups and oxygen vacancies with the higher photoactivity of a particular catalyst [31–33].

XPS experimental results of all catalysts.
| Sample | OLattice | Oads | Metal (a) | Metal (b) | |||||||
|---|---|---|---|---|---|---|---|---|---|---|---|
| BE (eV) | % | BE (eV) | % | BE (eV) | % | BE (eV) | % | Metal/Ti | |||
| TiO2-P25 [25] | 530.64 | 89.2 | 531.86 | 10.8 | – | – | – | – | – | – | – |
| Cu/TiO2-I | 529.9 | 87.3 | 531.62 | 12.7 | 932.73 | Cu+ | 42.88 | 934.74 | Cu2+ | 36.43 | 0.185 |
| Mn/TiO2-I | 529.64 | 76.7 | 531.14 | 16.63 | 640.65 | Mn2+ | 31.19 | 642.35 | Mn4+ | 52.24 | 0.088 |
| Fe/TiO2-I | 529.68 | 87.3 | 531.44 | 12.4 | 710.36 | Fe2+ | 65.36 | 712.47 | Fe3+ | 24.4 | 0.091 |
| TiO2-SG | 529.75 | 93.65 | 531.59 | 6.35 | – | – | – | – | – | – | – |
| Cu/TiO2-SG | 529.61 | 79.46 | 531.58 | 20.54 | 932.33 | Cu+ | 38.16 | 934.36 | Cu2+ | 37.71 | 0.182 |
| Mn/TiO2-SG | 529.68 | 81.15 | 531.63 | 18.85 | 641.5 | Mn3+ | 55.55 | 643.52 | Mn4+ | 44.45 | 0.068 |
| Fe/TiO2-SG | 529.56 | 73.48 | 531.02 | 26.52 | 710.5 | Fe2+ | 61.62 | 712.44 | Fe3+ | 38.38 | 0.051 |
Fig. 4(a) shows the Cu 2p XPS spectra for Cu/TiO2-I and Cu/TiO2-SG. The shape and energy position of the two photoelectron peaks are nearly the same in the catalysts. The Cu 2p spectra of samples show four peaks, that localized at 932.73 and 932.33eV indicates that the oxidation state of Cu present on the surface of the both samples is +1, the peak localized at 934.74 and 934.36eV and the two satellite peaks at around 941.00 and 943.30eV can be attributed to the presence of Cu2+[34–36].
 Cu2p XPS peaks of Cu/TiO2-I and Cu/TiO2–SG. (b) Mn2p XPS peaks of Mn/TiO2-I and Mn/TiO2–SG. (c) Fe2p XPS peaks of Fe/TiO2-I and Fe/TiO2–SG.")
The XPS spectra (Fig. 4(b)) of the Mn/TiO2 sample elaborated by the impregnation method can be deconvoluted into three peaks at 640.65eV, 642.35eV and 645.27eV corresponding to Mn2+, Mn4+ and satellite peak, respectively. While, the sample prepared by sol–gel method presents two peaks at 641.5eV and 643.52eV indicating the presence of Mn3+ and Mn4+, respectively [31,37–39].
Fig. 4(c) shows that the Fe 2p curve of the both samples of Fe/TiO2 is formed by two peaks located at around 710.4 and 712.4eV can be attributed to the presence of Fe2+ and Fe3+ species, respectively [40,41].
The percentages of the Cu/Ti, Mn/Ti and Fe/Ti atomic ratios are reported in Table 3. In general, it can be observed that the catalysts elaborated by the sol–gel method present an increase in the atomic ratios compared to those elaborated by impregnation, mainly in the both samples of Mn/TiO2 and Fe/TiO2, which can be considered as an estimation of metal dispersion on the support. Thus, these results show that the metal oxide particles are highly dispersed on the surface of the catalysts prepared by the impregnation process than those prepared by sol–gel, which may be due to the fact that, as suggested by XRD and Raman results, the metallic cations are incorporated in the titania lattice in greater extend in SG samples while remain dispersed on the surface in impregnated samples.
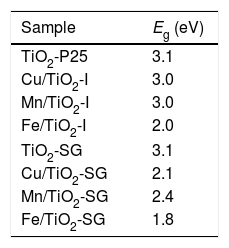
UV–vis spectroscopyAs shown in Fig. 5, the both samples of TiO2 reveal a sharp adsorption band at 350nm (Eg=3.1eV) associated to charge transference band O2−–Ti4+. While, in the modified samples additional absorption bands associated to the doping elements are detected and modify the band gap of the system (Table 4) measured considering the intense UV–vis charge transference band:
- (a)
for Mn/TiO2-SG sample an intense band at 440nm associated probably to O2−–Mn2+ charge transference band (band gap 2.4eV) and a moderate absorption band centered at 620nm that can be associated to 6Alg (S)→4T1g (G) of Mn2+ ions in octahedral symmetry are detected [42,43]. In the case of Mn/TiO2-I sample, both charge transference band and d–d transition bands shift to lower wavelength: 360 (band gap 3.0eV) and 550nm respectively, indicating a more intense crystal field in the impregnation samples.
- (b)
for Cu/TiO2-SG sample a sharp charge transference band associated to O2−–Cu2+ is detected centered at 360nm (band gap 2.1eV) and an intense band at 780nm associated to 2B1g→2B2g due to an octahedral coordination with a strong tetragonal distortion of the Cu2+ ions [42]. In the Cu/TiO2-I sample these bands shift to lower wavelength: 360nm (bad gap 3.0eV) and 760nm respectively, indicating a more intense crystal field in the impregnation samples as in the Mn samples case.
- (c)
for Fe/TiO2-SG sample an intense band at 420nm (band gap 2.6eV) associated to 6A1g(S)→4A2g,4E(G) transition and a shoulder at 520nm due to 6A1g(S)→4T2g(G) both due to Fe3+ in octahedral coordination [44]. However, for Fe/TiO2-I sample the charge transference band of O2−–Ti4+ is detected at 350nm and two shoulders at 420nm and 520nm associated to the above mentioned transition of Fe3+ in octahedral coordination. In this case the continuous absorbance in the 300–540nm range moves the calculation of the band gap to the absorption centered at 520nm (band gap of 1.8 and 2.0eV for Fe/TiO2-SG and Fe/TiO2-I respectively.
 and sol–gel (b).")
In all modified samples the band gap decreases associated to the red shift of the absorption associated to charge transference band of O2−–Ti4+ that is modified by additional transference bands associated to doping cations. The values for the impregnation samples are close to the unmodified sample for Mn and Cu cases (3.0eV versus 3.1eV) but for sol–gel and Fe/TiO2-I samples the decrease is significant; all values are lower than 2.5eV in agreement with a great extension of the entrance of cations in solid solution in this case.
Photocatalytic activity measurementAs has been mentioned above, the photocatalytic activity of the prepared catalysts has been evaluated in Orange II degradation in aqueous solution. Fig. 6 plots kinetic behavior of Orange II degradation for all samples. The kinetic parameters of the photocatalytic reaction and degradation rate are presented in Fig. 7. The degradation half time t1/2 was calculated using the Langmuir–Hinshelwood model as described elsewhere [44,45]. The photocatalytic activity of samples decrease in the order (TiO2-P25>TiO2-SG)>(Mn/TiO2-I>Mn/TiO2-SG)>Fe/TiO2-SG>(Cu/TiO2-I>Cu/TiO2-SG)>Fe/TiO2-I.


The results show that nearly all samples own a degradation rate superior to 90%, except in the case of the both catalysts Fe/TiO2-I (69%) and Cu/TiO2-SG (82%) associated to a Eg of 2.0 and 2.1eV respectively. The high photoactive samples show relative high band gap (3–3.1eV) except for Cu/TiO2-I sample and the lower show relative low band gap (2–2.1eV) except for Fe/TiO2-SG.
In all cases the SG samples show lower photoactivity than its homologous I samples; this behavior can be explained by the presence of both anatase and rutile phases in the commercial TiO2. Indeed, the phase junction formed between the surface anatase nanoparticles and rutile particles may facilitate transfer of the photogenerated electron from the conduction band of the rutile phase to the trapping sites on the anatase surface, this electron mobility prevents the electron–hole recombination and allows the holes generated to move to the surface of the catalyst [46–50].
As above has been discussed, XRD, Raman, XPS and UV–vis data show that the metallic cations are incorporated in the titania lattice in greater extend in SG samples while remain dispersed on the surface in impregnated samples. Although, it is well known that the entrance of metallic cations in solid solution associated to red-shift in the absorption band edge, and the increase in absorption intensity enhance the photocatalytic activity due to the enhanced formation of photoelectrons and photoholes [51,52], at a high doping content, a large number of structural defects could be induced serving as a recombination center of electron–hole photogenerated, which absolutely slow down the photocatalytic process [32,52–54]. Therefore, the SG samples show higher photoactivity than I samples except in the case of Fe modified samples; in this case, the red shift is very large (Eg=1.8eV is the lower value observed) and then compensate the induced recombination center of electron–hole pair. In effect, the minimum discoloration is reached at 69.4% for iron modified titania and elaborated by impregnation method. Whereas the sample prepared by sol–gel method presents 95%, which can be related to the simultaneous action of three different factors: the preservation of the charge transference band of O2−–Ti4+ detected at 350nm in the Fe/TiO2-I sample that inhibits the semiconductor mechanism of O2−-Ti4+ in favor of d–d transition associated to iron ions, the high surface area and the higher rate chemisorbed oxygen found in Fe/TiO2-SG sample, that can inhibit the recombination hole–electron due to the high content of iron.
On the other hand, the Cu/TiO2 samples present a decrease in the photocatalytic activity compared to unmodified TiO2 due to the high copper content. Indeed, the excessive oxygen vacancies and Cu species can become the recombination centers of the photogenerated electron–hole [32]. Furthermore, the difference between the degradation rates of samples may be explained by the presence of the both phase anatase and rutile in the sample elaborated by impregnation method may slow down the electron–hole recombination [50,55].
According to all obtained results, the best photocatalytic activity was observed for TiO2 prepared by a sol–gel method which presented a half-life time of 24min nearest to TiO2-P25 (9min). The Mn modified samples show slightly higher half-life time (33–36min), the introduction of Fe and Cu ions in the lattice increases the half-life time. All this indicates that to obtain a highly active catalyst it necessary to optimize four properties of the samples: the rutile phase content, the doping content, the chemisorbed oxygen content and the high surface area.
ConclusionIn this study, we have successfully prepared Fe, Mn and Cu modified TiO2 by impregnation and sol–gel methods followed by calcination process. The prepared samples have been characterized by XRD, Raman, physical adsorption of N2 at 196°C, XPS and UV–vis and investigated through photocatalytic degradation of azoic dye “Orange II”.
The characterization results showed the presence of the both phase anatase rutile for the samples prepared by impregnation method. On the other hand, no metallic oxides diffraction peaks were observed, suggesting a good dispersion of the metal species on the catalyst surface. This result was also confirmed by the Metal/Ti ratio by XPS analyses. The modification of TiO2 decreases the BET surface area of samples and reduces the band gap energy.
The results show that nearly all samples own a degradation rate superior to 90%, except in the case of the both catalysts Fe/TiO2-I (69%) and Cu/TiO2-SG (82%) associated to a Eg of 2.0 and 2.1eV respectively. The high photoactive samples show relative high band gap (3–3.1eV) except for Cu/TiO2-I sample and the lower show relative low band gap (2–2.1eV) except for Fe/TiO2-SG.
In all cases the SG samples show lower photoactivity than its homologous I samples associated to the presence of both anatase and rutile phases in the commercial TiO2; the phase junction formed between anatase–rutile particles facilitate transfer of the photogenerated electron from the conduction band of the rutile phase to the trapping sites on the anatase surface and prevents the electron–hole recombination and allows the holes generated to move to the surface of the catalyst.
XRD, Raman, XPS and UV–vis data show that the metallic cations are incorporated in the titania lattice in greater extend in SG samples while remain dispersed on the surface in impregnated samples. Although the entrance of metallic cations in solid solution enhance the photocatalytic activity due to the enhanced formation of photoelectrons and photoholes, at a high doping content, a large number of structural defects could be induced serving as a recombination center of electron–hole photogenerated, therefore the SG samples show higher photoactivity than I samples except in the case of Fe modified samples; in this case, the red shift is very large (Eg=1.8eV is the lower value observed) and then compensate the induced recombination center of electron–hole pair.
The best photocatalytic activity was observed for TiO2 prepared by a sol–gel method, which presented a half-life time of 24min nearest to TiO2-P25 (9min). The Mn modified samples show slightly higher half-life time (33–36min), the modification by Fe and Cu ions increases the half-time. All this indicates that to obtain a highly active catalyst it necessary to optimize four properties of the samples: the rutile phase content, the doping content, the chemisorbed oxygen content and the high surface area.
Financial support from National Center for Scientific and Technical Research (CNRST) in Rabat – Morocco is gratefully acknowledged.

