


In this work is presented a study on the recycling of liquid effluents in a ceramic installation for sanitary industry. The effluents were characterized by X-ray diffraction and inductively coupled plasma to evaluate their compositions. It was also assessed the daily production rate. Several glaze–slurry mixtures were prepared and characterized according to procedures and equipment of the company's quality laboratory. The results show that for most of the properties, the tested mixtures exhibited acceptable performance. However, the pyroplasticity parameter is highly influenced by the glaze content and imposes the separation of glaze and slurry liquid effluents. In addition, it is necessary to invest on a storage plant, including tanks with constant stirring and a new pipeline structure to implement the reincorporation method on the slurry processing.
Este trabajo presenta un estudio sobre la recuperación de efluentes líquidos en una instalación de cerámica de sanitarios. Los efluentes se caracterizaron por difracción de rayos X y plasma de acoplamiento inductivo para evaluar sus composiciones. También se evaluó la tasa de producción diaria. Se prepararon y caracterizaron varias mezclas de esmalte y pasta cerámica de acuerdo a los procedimientos y equipos de laboratorio de calidad de la compañía. Los resultados muestran que para la mayoría de las propiedades, las mezclas presentan un comportamiento aceptable. Sin embargo, la piroplasticidad está fuertemente influenciada por la cantidad de esmalte y requiere la separación de los 2 efluentes líquidos. Además, es necesario invertir en tanques de almacenamiento con agitación constante y una estructura de tuberías para implementar el método de reciclaje para la producción de nueva suspensión cerámica.
The development of societies was accompanied by political decisions with intent to improve the quality of living of citizens and maintain the environmental balances. The expansion of modern civilization led to an intense growth of wastes, with two main origins: urban areas and industrial regions. The consequences of the rise on the production of wastes are serious, not only from the economic and financial point of view, but especially related to public health. Over the years, community governments legislated and stimulated people to reduce the production of wastes. In addition, several integrated systems are proposed to manage these sub-products: recycling ([1], [2], [3], [4], [5], [6], [7], [8], [9], [10], [11], [12], [13]), composting ([1]), energetic incineration ([1], [8], [14]) and disposal in sanitary landfills ([1], [8], [14], [15]). In Europe and Portugal, several directives and laws have been established to encourage and regulate the management and treatment of the industrial residues produced by industries ([16], [17], [18], [19]). Product manufacturing of ceramic industries causes high volumes of effluents, with variable composition, depending on the areas of the factory where they are generated. Raw materials, ceramic products, decoration or fuel are sources of wastes produced on different stages of the processing. Independently of the origin or type of waste, the effluents must be treated and processed, in order to minimize the environmental impact. The case study present on this document describes Eurocer, a ceramic factory from the Sanitex Group, producer of sanitary ware which generates liquid effluents during the daily work on the plant. In general, the effluents produced on ceramic factories contain the same elements as the raw materials and might be reincorporated in the productive cycle ([20]). Even so, the quantitative composition of the effluents might be different when comparing to the slurry. These differences are related with the several places of the plant where they are generated: areas of preparation of glaze, slurry and gypsum molds, glazing areas, casting rooms and technical laboratories. Currently in Eurocer, all the produced effluents are directed and saved in a storage tank, with permanent stirring, ready for posterior treatment. Each day, part of the effluent accumulated is transformed to cakes with 0.92 × 0.92 × 0.02 m3 with 30–35% humidity, in a filter press and saved on a specific area for posterior treatment. These cakes are then collected and transported by specialized companies into landfills for disposal, involving a maximum global cost of 250 €/ton. This fact is one of the main reasons for developing a project to study the possibility to treat these effluents internally without intervention of external entities. The treatment of industrial residues can be performed using the recycling technique ([1], [8], [12], [13]). With this in mind, the main goal of this work is to assess the possibility to reincorporate the daily produced effluents on the preparation of slurry. Fig. 1 shows a schematic example that illustrates the several stages for the manufacturing of sanitary products and the areas of the plant where liquid effluents are generated in significant volume.
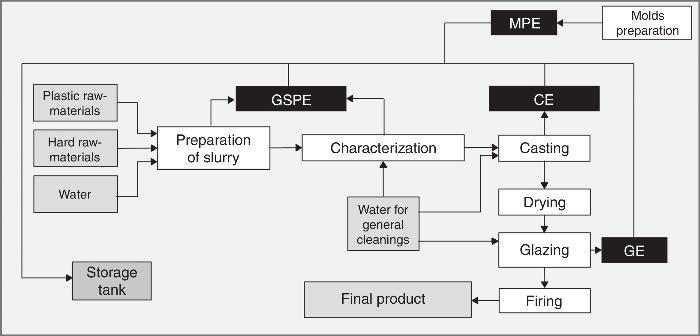
Fig. 1. Steps of the manufacturing process of Eurocer and effluents generated: GSPE – glaze and slurry preparation liquid effluents; MPE – molds preparation liquid effluents; CE – casting liquid effluents and GE – glazing liquid effluents.
The processing steps on Eurocer are similar to other ceramic factories producing sanitary ware. The process initiates with the milling and mix of the hard and plastic raw materials, with water. After the preparation of the slurry and the glaze is complete and before going for production, both are controlled in the technical laboratory to ensure all the quality requirements. The slurry is then used on the casting process, using gypsum molds, followed by a drying process. After this, the products are glazed in specific shops before going to the firing step. During most of these moments, liquid effluents are produced. The total amount of generated effluents is saved in a tank, with permanent stirring and its volume corresponds to the sum of the partial liquid effluents created on the different areas of the plant: GSPE – glaze and slurry preparation effluents; MPE – molds preparation effluents; CE – casting effluents and GE – glazing effluents. To achieve the mentioned goal, the effluents can be considered as raw materials and must be characterized. In addition, other requirements are mandatory to address a final conclusion on the viability of the reincorporation of the effluents in the slurry: ensure the available amount of effluent for the slurry preparation; characterize the effluent in a daily basis to minimize the properties variation and also, if necessary, perform pre-treatment of the effluents. The main goal of this work is to save the costs that Eurocer currently has with liquid effluents. On one hand, the use of the generated effluents on the preparation of slurry avoids the need of external entities to collect, transport, deposit and treat these sub-products. On the other hand, by recycling these effluents the amount of fresh water and raw materials needed for preparing the slurry can also be reduced.
Materials and methodsLiquid effluentsIn this work it is the main goal to assess the possibility of reincorporation of the daily produced effluents on the preparation of slurry. For that, several effluent samples were recovered and identified according to the areas where they were generated and previously described in Fig. 1. Also in Fig. 1 were identified two specific effluents, generated on the casting rooms, and identified as CE for casting liquid effluents and MPE for mold preparation liquid effluents. The process for preparing the ceramic parts used in Eurocer is the traditional pressureless casting, with gypsum molds. This means that the liquid effluents generated on these rooms are composed essentially of calcium sulphate dehydrate (CaSO4·H2O), also known as gypsum. The presence of this element on the slurry can have adverse effects, depending on the particle size. From previous studies, gypsum near-surface particles with size below 100 μm have no direct effect on the surface of glaze; however, if the size is above 100 μm, defects can develop leading to pores or superficial defects on the ceramic body product. The most problematic effluent is the one generated on the areas where the gypsum molds are prepared to be used later during casting. This effluent is highly rich in gypsum that can seriously diminish the ceramic body products quality if introduced on the slurry preparation. The casting effluent, although it contains gypsum on the composition, it is residual and it is expected to have no impact on the slurry properties. Even so, to avoid problems with gypsum and in order to disregard its influence on the main properties of the slurry, these liquid effluents produced on casting areas and mold preparation rooms are directed to a different tank and treated separately. This can be achieved once the lines that transports the different effluents between the areas where they are generated and the storage tank are separated. This way it is possible to exclude from the analysis these gypsum-rich effluents. For all the remaining effluents, GSPE, GE and STE, was collected a daily, weekly and monthly sample, during a period of 28 consecutive days always at the same period of day and a constant volume of 5 L. To characterize the solid fraction of all effluents, the samples were dried for 2 h at 105 °C. Crystalline phases were revealed by X-ray diffraction (XRD) in the range of 2θ values between 4 and 80°, at 3°/min, with a RIGAKU Geigerflex diffractometer, equipped with a Ni filter and graphite monochromator, using Cu Kα radiation (λ = 1.54056 ¿). The peaks were identified by comparison with published JCPDS standard files. In addition, a few restricted samples were selected to quantify the concentration of elements and/or oxides present on the effluents using Inductively Coupled Plasma (ICP) technique. Also, the particle size distribution was determined by Fraunhofer laser scattering, in Coulter LS230 equipment, with a measurement range between 0.04 and 2000 μm and using water as fluid.
An important parameter for this study is determining the total amount of liquid effluent produced on each day. Because it was not possible to stop the production on the plant to perform the several measurements, it was used an indirect method to assess the amount of effluent produced. This volume was calculated using two variables: the estimated volume variation on the storage tank and the amount of effluent processed as cakes in a filter-press process. The first was determined by measuring the level of the tank with liquid effluent and its density, every day at the start and end time of workday. The second, amount of effluent processed as cakes in filter-press, is evaluated registering the number of filter-press processes performed during each day and using the cakes properties like humidity and dimension.
Glaze–slurry mixturesAfter the characterization and discussion of the results of the effluents, several mixtures containing different glaze and slurry proportions (Table 1) were prepared according to the chemical composition obtained for the tank effluent. This way it is possible to simulate the conditions of reincorporation of the effluent on the slurry production.
Table 1. Prepared mixtures with different glaze–slurry proportions.
| Mixture | I | II | III | IV | V | VI |
| Glaze, vol.% | 1.2 | 1.7 | 2.7 | 5.2 | 8.7 | 12.8 |
| Slurry, vol.% | 98.8 | 98.3 | 97.3 | 94.8 | 91.3 | 87.2 |
As previous, the prepared mixtures were characterized by XRD, ICP and Coulter. Also, several other characterization methods were employed, according to Eurocer's quality laboratory. Density, viscosity and thixotropic behavior were evaluated to assess the rheological performance of the suspensions. Was also estimated the amount of sulphates using from each sample a volume of 5 mL in a LASA 100 equipment, model LCK 153. The permeability coefficient, another important parameter, was determined using an internal equipment and procedure of Eurocer. About 140 g of slurry was introduced into a specific container and then air pressure is applied forcing water to pass through a filter paper. The initial and final values of mass and temperature were registered, mi, mf, Ti and Tf respectively. It was also obtained a coefficient C using the temperature difference measured previously and a conversion table specific of Eurocer. Then, is calculated the permeability factor, P, using Eq. (1):
To evaluate the flexural strength, several specimens were processed with 150 mm length, 37 mm width and 11 mm thickness. The trial was performed using equipment Gabrielli, model Crab-3, with a span of 130 mm and a constant load of 8.5 kg/s. It was also determined the wall thickness formation using about 0.5 L of slurry after resting periods of 40 and 80 min. This parameter is related to the processing method of the ceramic pieces, where the slurry is poured in gypsum molds and by capillary suction of the porous mold the piece is dried. This allows evaluating the wall thickness formation rate of the dried ceramic piece in porous gypsum molds.
Another important property to be assessed is the thermal behavior. The thermal expansion was performed on specimens with 50 mm length and previously fired at 1230 °C, using a Neutzsch 402 dilatometer until a maximum temperature of 835 °C and at heating rate of 10 K/min. Was also determined the pyroplastic deformation using a conventional method during firing process.
Results and discussionLiquid effluentsX-ray diffraction (XRD)The crystalline phases of the different effluents collected during the experimental period as well as the reference sample extracted from the production slurry are presented in Fig. 2.
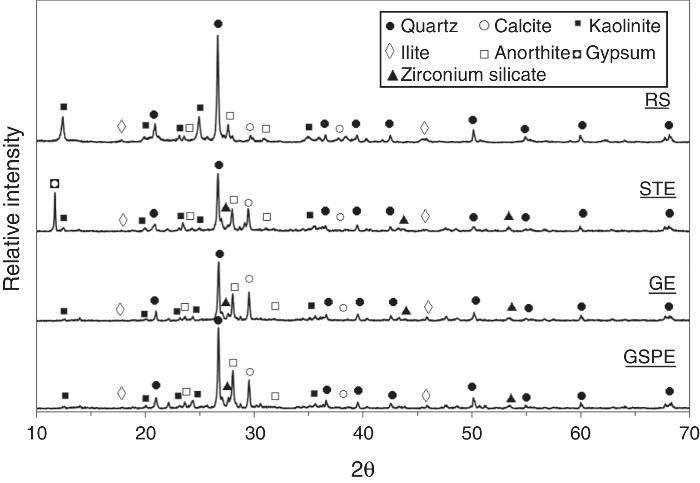
Fig. 2. XRD results of the main samples: RS – reference sample (slurry production); STE – storage tank liquid effluent; GE – glazing liquid effluent and GSPE – glaze and slurry preparation liquid effluent.
The analysis of the diffractograms allows understand that the main phases are common in all samples. Starting with the reference sample (RS), extracted from the slurry currently used in production, it is possible to identify quartz (SiO2) as main peak, then kaolinite (Al2Si2O5(OH)4), anorthite (CaAl2Si2O8), calcite (CaCO3) and also, in smaller amounts, illite (K0.7Al2(Si,Al)4O10(OH)2). When evaluating the glazing liquid effluent (GE), produced on the glazing areas of the factory, the previous enhanced phases are also present. This result is expected because although the proportions of the used raw materials are different, the overall composition of the glaze is similar to the slurry. However, on this effluent, it stands out a different phase that does not exist on the reference: zirconium silicate (ZrSiO4). This material, mainly used has opacifying agent on ceramic industry, is present only on the glaze composition and it will take a key role on this work. The glaze and slurry preparation liquid effluent (GSPE), which basically consists on the effluents generated on the areas where slurry and glaze are prepared, is constituted by all the enunciated phases, including zirconium silicate. Finally, the storage tank liquid effluent (STE), as expected, presents also all the phases already described, once it accommodates all the effluent generated on the plant, including the processing section where residues of gypsum coming from the molds are also present. Although the hydrated calcium sulphate (CaSO4·H2O) peak appears on the STE diffractograms, all further tests were performed assuming that the gypsum will be separated and treated properly from the remaining effluents.
Inductively coupled plasma (ICP)In order to quantify the elements/oxides present on the effluents, a few selected samples were selected for ICP analysis. The results are displayed in Fig. 3.
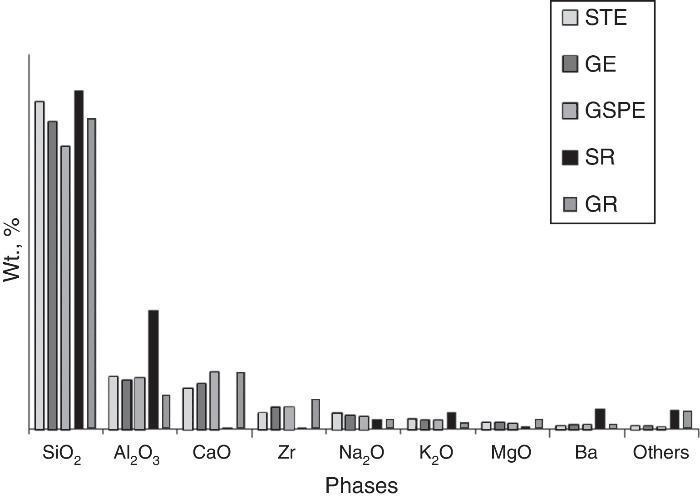
Fig. 3. ICP data obtained for the different effluents: STE – storage tank effluent; GE – glazing effluent; GSPE – glaze and slurry preparation effluent; SR – slurry reference and GR – glaze reference.
From Fig. 3, it is possible to assess that the main phases present on the effluents are SiO2, Al2O3 and CaO. In smaller quantities were also detected and quantified Zr, Na2O, K2O, Mg and Ba. Residual elements/oxides such as TiO2, P2O5, MnO, Cr2O3, Ba, Ni, Sr, Y and Nb, were also detected and classified in category “others”. From the results it is possible to observe that the composition of the effluents is more close to the glaze and deviates more from the slurry composition. Indeed, the content on the effluents of phases such as CaO or Al2O3 are strongly affected by the presence of the glaze. In addition, the quantification of Zr, present only on the glaze, allows estimate the fraction of glaze and slurry on the effluents. Using ICP data for the Zr content on the effluent (%ZrICP) and Eq. (2) it is possible to estimate the amount of glaze on the storage tank effluent (%GSTE):
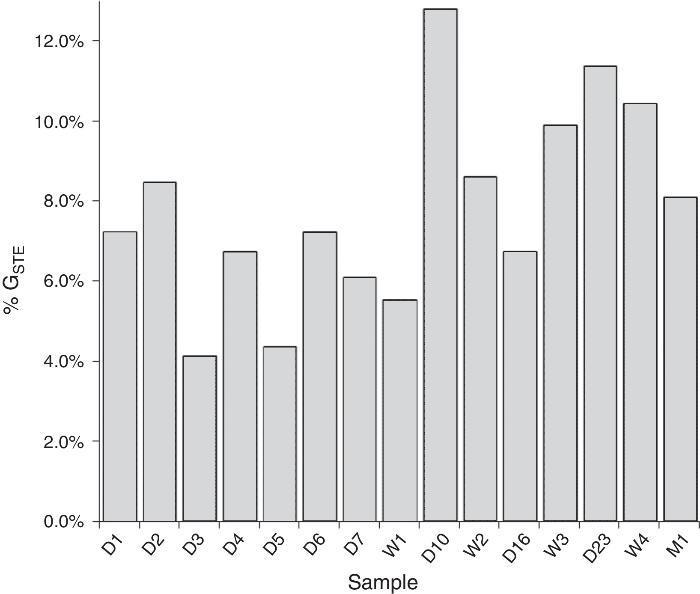
Fig. 4. Glaze content on storage tank effluents in different samples.
According to the obtained results, the amount of glaze elements on the solid fraction of the effluent ranges in average between 4 and 12 wt.%. This represents the amount of glaze that could be potentially introduced on the slurry processing, if all the effluent is used as source of water. This information is highly relevant in order to evaluate the impact of these quantities on the different characteristics of the slurry. The more fusible behavior of the glaze can become problematic, especially on the thermal expansion and pyroplasticity.
Particle size distributionFig. 5 shows the particle size distribution of average weekly samples for the different effluents collected, as well for the reference sample, obtained from the production slurry. It is also presented on Table 2, the cumulative values for certain particle sizes and the D50 value.
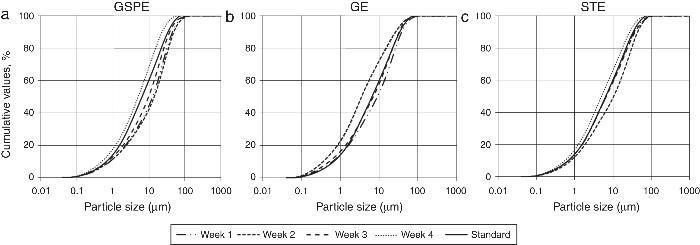
Fig. 5. Particle size distribution for each type of effluent and for the reference sample (slurry production): (a) GSPE – glaze and slurry preparation effluent; (b) GE – glazing effluent and (c) STE – storage tank effluent.
Table 2. Cumulative values for 2, 16, 48 and 96 μm particle size and also D50.
| Particle size (μm) | Cumulative values (%) | ||||
| 2 | 16 | 48 | 96 | D50 | |
| GSPE | 20.3 | 61.6 | 93 | 100 | 11.7 |
| GE | 32.4 | 78.7 | 98 | 100 | 5.3 |
| STE | 25.3 | 70.0 | 95 | 100 | 7.3 |
| Reference | 17.4 ± 2 | 77.0 ± 2 | 100 ± 2 | 100 ± 2 | 7.8 ± 1 |
The particle size distribution of the effluents, Fig. 5 shows that although it is possible to observe some deviation from the reference, it is acceptable. Taking in account the standard quality values required by the factory, Table 2, it shows that for 48 and 96 μm the cumulative value of particle size is very close to the ones mandatory by Eurocer. However, for values lower than 16 and 2 μm particle size, the deviation from the standard is stronger. This fact can be justified by the current layout of the plant. Nowadays, the effluents are conducted from the areas of the plant where they are generated to the storage tank through a pipeline and pumping system. During this path, some fraction of the particles can sediment on the tubes, creating a slight distortion on the real particle size of the generated effluents.
Effluent productionA very important parameter of this study is related with the amount of generated effluent during a regular working day. This value will influence the reincorporation process, especially in terms of quantity and quality. In order to assess the amount of produced effluents, it was measured, during the experimental period, the density and level of effluent on the storage tank and number of filter-press during each day. This allows calculate the volume of liquid effluent produced, presented in Fig. 6.
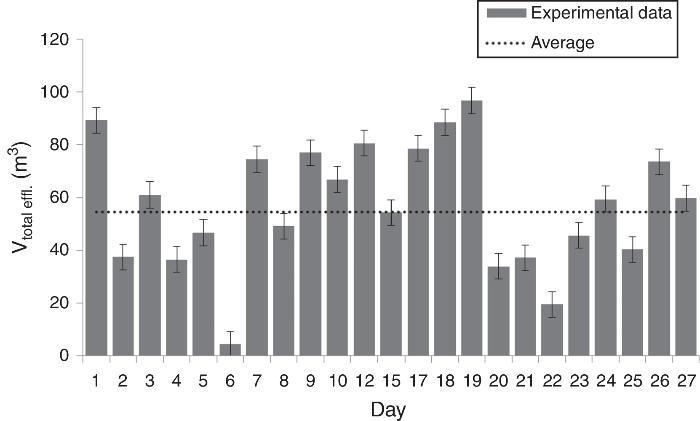
Fig. 6. Variation of the amount of storage tank effluent, produced during the experimental period of the work.
The analysis of Fig. 6 shows that the production of effluent is unstable. The maximum value was obtained on day 19 with an amount of 96.7 m3, while in the opposite a minimum value of 4.3 m3 was found for the 6th day. Regularly, the daily production plan of slurry requires about 55 m3 of fresh water, and as seen in Fig. 5, during the experiment period 11 days were below this value. This means that the source of water for the processing of slurry might come from the generated effluent but, to avoid instability of the process during the preparation of slurry, it is mandatory to ensure the available amount of effluent every day for the slurry production. This can be possible using an accumulation procedure of the generated liquid effluents in storage tanks. This topic will be further discussed on this document.
Another important parameter that needs to be discussed is the amount of liquid and solids on the effluent storage tank. The results for solid concentration of the STE samples are presented in Fig. 7.
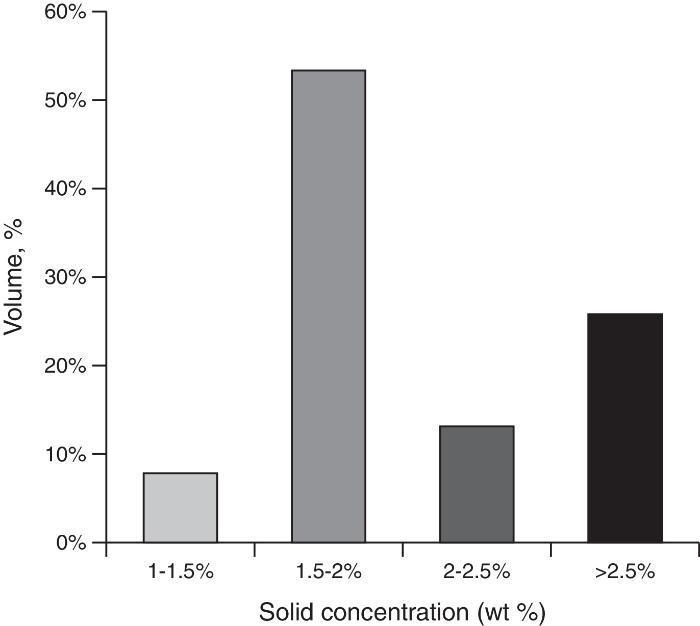
Fig. 7. Variation of the solid concentration of the storage tank effluent.
The evaluation of the solid fraction on the storage tank effluent allows understand that most of the effluent samples contain an average amount of solids on the range 1.5–2.0 wt.%, followed by the solid concentration higher than 2.5 wt.%. For solids content between 1 and 1.5 wt.% the amount is minimal, less than 10 wt.%.
The previous discussed results show that it might be possible reincorporate on the processing of slurry the generated effluents. The chemical results, XRD and ICP, showed the expected phases; particle size distribution does not deviates excessively from the reference required by the company and the amount of generated effluent can be enough to be used as source of water on the slurry preparation. The next step is understand the influence of the glaze content on the slurry properties and for that, several glaze/slurry mixtures with composition varying from 1 to 13 weight percent of glaze were prepared (Table 1).
Glaze–slurry mixturesX-ray diffraction (XRD)The crystalline phases of the slurry reference and of mixture slurry–glaze III are exhibited in Fig. 8.
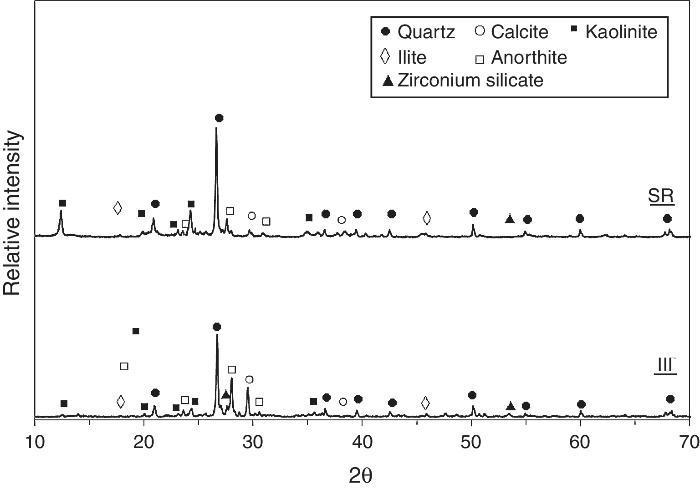
Fig. 8. XRD results of: SR – slurry reference and slurry–glaze mixture III.
The XRD data of the several slurry–glaze samples show that all the expected crystalline phases are present, including zirconium silicate.
Inductively coupled plasma (ICP)The ICP results for the prepared mixtures are presented in Fig. 9 and allow understanding the quantitative composition of the samples.
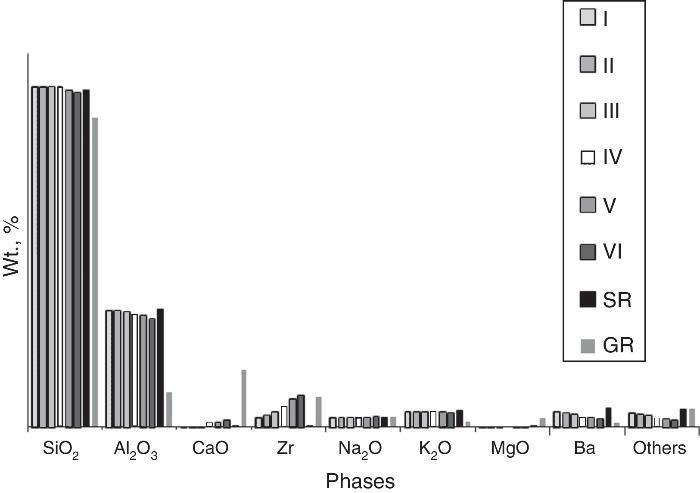
Fig. 9. ICP data obtained for glaze–slurry mixtures I–VI, with composition described in Table 1 along with reference samples, SR – slurry reference and GR – glaze reference.
These results are important to estimate the amount of glaze on each sample in order to assess the limit of glaze volume that can be incorporated on the slurry processing without reducing the quality parameters defined by the company.
Particle size distributionThe results for particle size of the glaze–slurry mixtures are presented in Table 3.
Table 3. Cumulative values for 2, 16, 48 and 96 μm particle size and also D50 for the several tested mixtures.
| Particle size (μm) | Cumulative values (%) | ||||
| 2 | 16 | 48 | 96 | D50 | |
| I | 19.0 | 75.9 | 98 | 100 | 7.7 |
| II | 18.2 | 74.7 | 97 | 100 | 8.1 |
| III | 18.5 | 74.0 | 97 | 100 | 8.1 |
| IV | 12.9 | 62.8 | 98 | 100 | 10.5 |
| V | 12.6 | 62.7 | 97 | 100 | 10.6 |
| VI | 11.7 | 61.9 | 97 | 100 | 10.9 |
| Standard | 17.4 ± 2 | 77.0 ± 2 | 100 ± 2 | 100 ± 2 | 7.8 ± 1 |
The results show that the particle size distribution of the samples is affected by the presence of glaze. Only mixture I, with glaze content of 1.2% volume, is completely within the desired results by Eurocer. Although the remaining samples are out of specification, when the content of glaze decreases, the results are closer to the standard values.
Sulphate analysisThe evaluation of the quantity of sulphates on the effluents is a quality parameter that needs to be assessed due to the intrinsic problems of the SO42− ions on the deflocculation of slurry. The results for the different tested mixtures are displayed in Fig. 10.
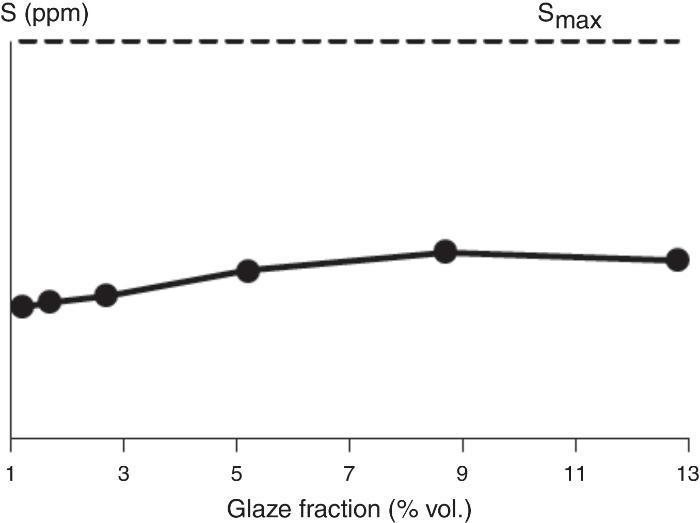
Fig. 10. Variation of the sulphates content on different glaze/slurry composition (Smax – maximum content of sulphates accepted).
The results show that the amount of sulphates on the mixtures is always below the maximum value defined by Eurocer. This way it is possible to conclude that for glaze content below 13 wt.%, the amount of sulphates on the slurry is within the specified.
Permeability factorAnother important parameter to assess the quality of the slurry is the permeability coefficient. It allows evaluating the capability of the water to flow through the cake formed on filtrating medium when the slip is subjected to the action of compressed air. The results are presented in Fig. 11.
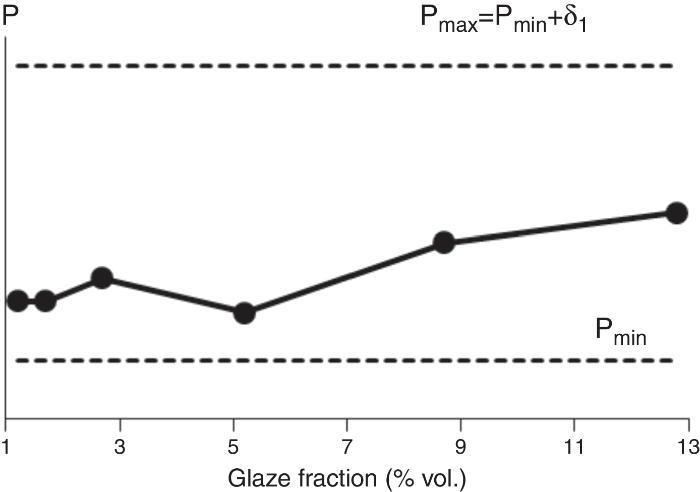
Fig. 11. Variation of the permeability coefficient for the different tested samples (Pmin – minimum permeability value accepted; Pmax – maximum permeability value accepted; δ1 – value defined by Eurocer to define Pmax).
The results obtained for the several mixtures shows that the permeability factor is always within the limits defined by Eurocer, for the experienced mixtures. Although is possible to identify some influence, it is not negative enough to compromise the slurry's permeability.
Flexural strengthThe mechanical property tested in Eurocer on dried specimens is flexural strength to assess the ability of the product to resist a 3-point flexural load. The results are exhibited in Fig. 12.
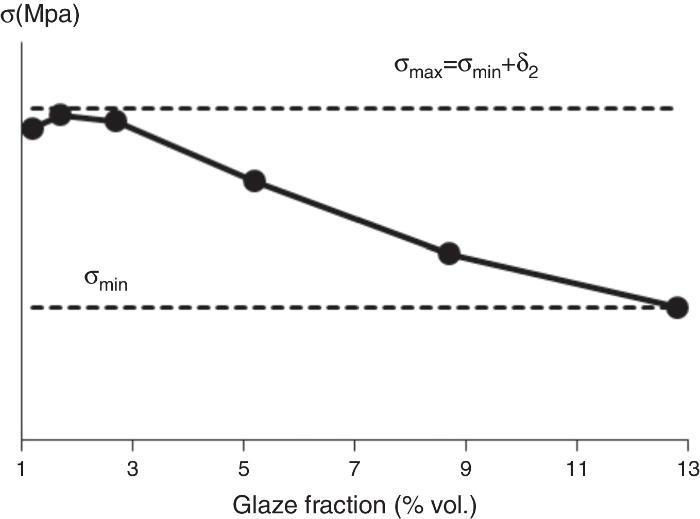
Fig. 12. Flexural strength of dried specimens with different glaze content (σmin – minimum flexural strength accepted; σmax – maximum flexural strength accepted; δ2 – value defined by Eurocer to define σmax).
It is possible to observe in Fig. 10 that, when the glaze content on the mixture is increasing, the flexural strength of the specimens diminishes until the minimum value. Even so, all the values are within the acceptable range defined by Eurocer.
Wall thickness formationAnother factor to consider is the wall thickness formation, which allows characterizing the slurry in terms of facility to increase its wall thickness during slip casting process. The results for both resting times of 40 and 80 min are exhibited in Fig. 13(a) and (b), respectively.
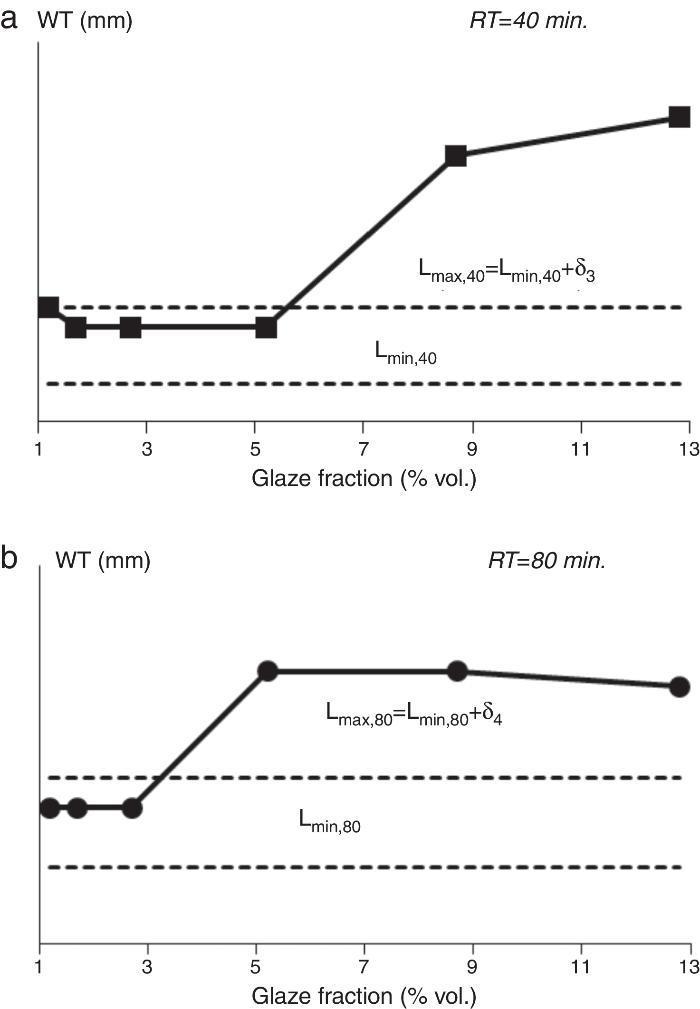
Fig. 13. Wall thickness (WT) formation of the samples, at resting times of 40 and 80 min (Lmax,40 and Lmax,80 – maximum wall thickness allowed at 40 and 80 min, respectively; Lmin,40 and Lmin,80 – minimum wall thickness allowed at 40 and 80 min, respectively; δ3 and δ4 – value defined by Eurocer to define Lmax, at 40 and 80 min, respectively).
The obtained results show a direct influence of the glaze content on the thickness of the wall formed during casting process. After 40 min of casting, the samples containing higher glaze content, 8.7 and 12.8 wt.%, exhibited a value out of specification required by Eurocer while after 80 min rest, also the sample containing 5.2 wt.% of glaze was out of requirement. This means that, for this property, to ensure the quality standards defined by the company, the amount of glaze cannot exceed 2.7 wt.% on the slurry.
Thermal expansionThe thermal properties of the product are the ones that potentially can be more affected by the reincorporation process due to the presence of glaze. The regular characteristics of glaze, for example more fusible, can decrease the thermal qualities of the slip. One of the two parameters studied was the thermal expansion coefficient at 500 and 700 °C, where Fig. 14 presents the results for the tested mixtures.
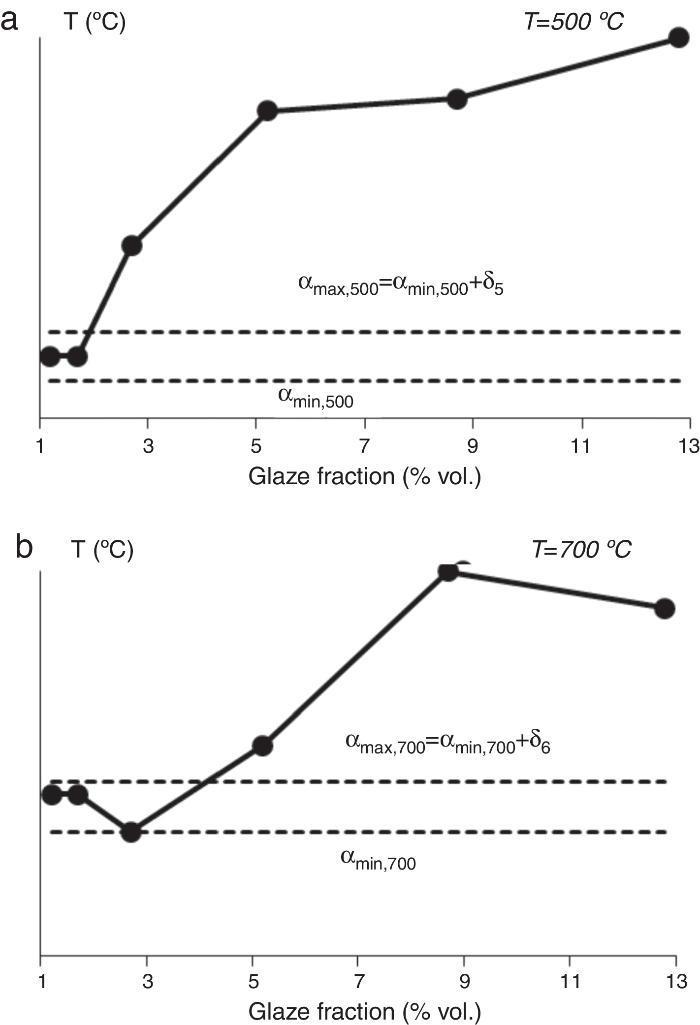
Fig. 14. Thermal expansion coefficient of fired samples, at 500 and 700 °C (αmax,500 and αmax,700 – maximum thermal expansion allowed at 500 and 700 °C, respectively; αmin,500 and αmin,700 – minimum thermal expansion allowed at 500 and 700 °C, respectively; δ5 and δ6 – value defined by Eurocer to define αmax, at 500 and 700 °C, respectively).
The negative impact of the glaze on this property is evident on both temperatures, as expected. The thermal expansion at 500 °C starts to become excessive for the samples with glaze content higher than 1.7 wt.%, while at 700 °C only for the samples with content higher than 2.7 wt.%. The composition of the glaze, richer in fusible elements, directly influences the expansion coefficient of the slurry as shown in both figures and the allowable amount to reincorporate on the slurry cannot overcome 1.5 wt.%.
Pyroplastic deformationThe other thermal property studied on this work is the pyroplasticity, consisting on the deformation of a specimen during the firing process. The formation of liquid phase and its viscosity can be influenced by the composition, especially when the amount of fusible elements increases, and therefore defects can develop on the final product. The results for the pyroplastic deformation of specimens of glaze/slurry mixtures are presented in Fig. 15.
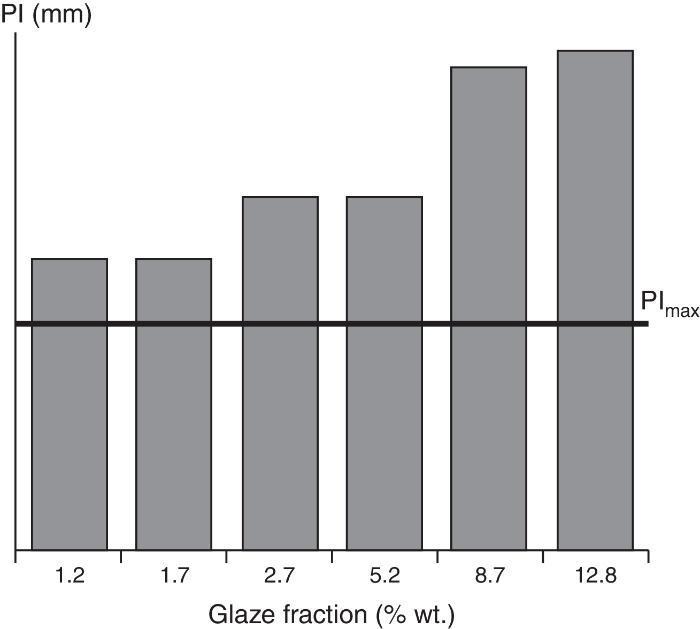
Fig. 15. Pyroplastic deformation of the samples (PImax – maximum pyroplastic index accepted).
All the specimens tested exhibited a pyroplastic deformation higher than the required by Eurocer. Independent of the glaze content, the results show that de pyroplastic deformation is deeply affected by the presence of glaze There are several approaches to solve this problem: physical or chemical treatments to completely remove the solid fraction of the effluent; reformulate the slurry's composition to compensate the glaze content present on the liquid effluent or separate the two main effluents and store them in different tanks.
Proposed layoutThe analysis of the results obtained for several tests performed on glaze–slurry mixtures with different composition reveals that although in some properties the glaze content does not reduce the quality of the slurry (sulphates analysis, permeability coefficient, flexural strength), for others although the impact is minimum, the amount of glaze needs to be controlled (wall thickness formation and thermal expansion). However, the pyroplastic deformation of the specimens for the tested mixtures revealed that the amount of glaze needs to be completely eliminated. There are two options for reincorporate the liquid effluents on the slurry preparation. A hypothesis is the reformulation of the slurry composition in order to accommodate the incorporation of the glaze solids of the effluent. However, the variability of the glaze content and solid concentration of the effluent constitutes a serious drawback to implement this method. In addition, this variability would require a daily characterization of the effluent with indication of solid content and glaze amount that would involve an investment in equipment to produce such results such as quantitative analysis to estimate the glaze content. Another disadvantage of this method is the need to reformulate the composition of the slurry, every day, depending on the amount of glaze of the liquid effluent. In such industrial environment, it is impossible to change every day or even every week the composition of the slurry. For all these reasons, this method cannot be applied for solving the problem of the presence of glaze. A second hypothesis, and probably the most viable, is the complete separation of the two main effluents generated, glaze and slurry. Indeed, it is possible to separate the two effluents and store them in individual tanks, once they are generated in distinguish parts of the plant. This method would require an initial investment on storage tanks, a system of constant stirring and a pipeline structure to transport the effluents. In this way, the slurry effluents can be recycled and used on the preparation of slurry and the glaze effluents can be stored in a different tank, filter pressed, and be shipped by a proper company to be treated and deposited in appropriate landfills.
ConclusionsThe analysis of the results allows concluding that it is possible to achieve the main goal of the work, the reincorporation of part of the daily produced liquid effluents on the preparation of slurry. Most of the quality parameters are satisfied if the glaze content is ensured to be less than 1.2 wt.% of the slurry. It is observed from the results that the major inconvenience of the presence of glaze is the pyroplastic deformation, which is above the limit defined by Eurocer, for all the tested mixtures. To overcome the inherent problem of the effect on the slurry properties of the incorporation of glaze, it is necessary to separate the liquid effluents with origin in the slurry preparation from the liquid effluents generated on the glazing areas and on the glaze preparation areas. This way it is possible to reincorporate the slurry liquid effluents on the process of preparation of slurry. The glaze effluents, unfortunately needs to continue to be treated before, meaning by an external entity. Once the production of liquid effluents is unstable, it is mandatory the implementation of a storing system, independent for slurry and for glaze, to ensure the enough amounts of effluents for the daily production along with a fully characterization every day the stored effluents to ensure that the quality parameters are according to the ones defined by Eurocer.
Acknowledgements
The authors would like to gratefully thank Eurocer, Indústria de Sanitários S.A. for financial and technical support during all the project and also the staff of the Department of Materials and Ceramic Engineering.
Received 28 November 2015
Accepted 8 April 2016
Corresponding author. brunoalmeida@ua.pt

