


ZnAl2O4 doped with various concentration (x) of Fe3+ were prepared using the Pechini synthesis. In the first set of samples, Fe3+ substituted Al3+ to create a system of the form ZnAl(2−x)Fex3+O4 (x=0–0.08). To study the effect of charge compensation, Fe3+ substituted Zn2+ to create Zn(1−x)Fex3+Al2O4 (x=0.05) system. The structure and particle morphology of the phosphors were studied using X-ray diffractometer (XRD) and field emission scanning electron spectroscopy, respectively. From the XRD data, the oxygen parameter and the inversion degrees were estimated. The elemental composition and electronic states of the phosphors were analyzed using X-ray photoelectron spectroscopy (XPS). XPS results showed that part of the Fe3+ were reduced to Fe2+ in the doped samples. Both photoluminescence and cathodoluminescence properties of the phosphors were also studied. Luminescence excitations using a xenon lamp and X-ray showed two broad emission bands located around 470 and 730nm, and were ascribed to Fe ions occupying the tetrahedral (tet) and the octahedral (oct) sites in ZnAl2O4, respectively. A change in the lifetime of these two emission bands upon Fe doping further confirmed the existence of Fe in the tet and oct sites in the ZnAl(2−x)Fex3+O4 matrix.
Se preparó ZnAl2O4 dopado con varias concentraciones (x) de Fe3+ usando la síntesis de Pechini. En el primer conjunto de muestras, Fe3+ sustituyó Al3+ para crear un sistema de la forma ZnAl(2−x)Fex3+O4 (x=0 a 0,08). Para estudiar el efecto de la compensación de carga, Fe3+ sustituyó Zn2+ para crear el sistema Zn(1−x)Fex3+Al2O4 (x=0,05). La estructura y la morfología de las partículas de los fósforos se estudiaron utilizando un difractómetro de rayos X (XRD) y espectroscopía electrónica de barrido de emisión de campo, respectivamente. A partir de los datos XRD se estimaron el parámetro de oxígeno y los grados de inversión. La composición elemental y los estados electrónicos de los fósforos se analizaron mediante espectroscopía de fotoelectrones de rayos X (XPS). Los resultados de XPS mostraron que parte de Fe3+ se redujo a Fe2+ en las muestras dopadas. También se estudiaron las propiedades de fotoluminiscencia y catodoluminiscencia de los fósforos. Las excitaciones de luminiscencia usando una lámpara de xenón y rayos X mostraron dos amplias bandas de emisión ubicadas alrededor de 470 y 730nm, y se atribuyeron a iones Fe que ocupan los sitios tetraédricos (tet) y octaédrico (oct) en ZnAl2O4, respectivamente. Un cambio en la vida útil de estas dos bandas de emisión después del dopaje con Fe confirmó aún más la existencia de Fe en los sitios tet y oct en la matriz ZnAl(2−x)Fex3+O4.
A spinel unit cell contains 8 face-centered cubics (FCC) cells. Spinels are made up of an anion, occupying the FCC lattice points, forming octahedral (oct) and tetrahedral (tet) sites with two central metal ions, usually divalent and trivalent ions, respectively [1]. They are represented by a general formula AB2O4, where “A2+” is a divalent metal ion occupying the tet sites and “B3+” is a trivalent metal ion occupying the oct sites. Spinels belong to the F−d3m space group. Each unit cell contains 32 oxygen (O2−) atoms, with 8 “A2+” atoms and 16 “B3+” atoms. Depending on the distribution of the “A2+” and “B3+” ions in the unit cell, spinels are divided into normal and inverse. Normal spinels have a cubic closed-packed (ccp) structure with more “B3+” ions than “A2+” ions. The “A2+” ions occupying 1/8 of the tet sites and the “B3+” ions occupying ½ of the oct sites. Atomic arrangement in the inverse spinel is such that the whole A2+ ions and ½ of the B3+ ions occupy the oct sites, while the other ½ of the B3+ ions occupy the tet sites. Furthermore, there is an intermediate structural arrangement described by the formula (A1−yBy) [Ay/2B1−y/2]2O4 with the terms in parentheses and square brackets denoting the tet and oct sites, respectively. y is called the inversion degree, and its values range from 0, for normal structure, and 1, for inverse structure, and 2/3 for random ion distribution [2].
ZnAl2O4 belong to the spinel group known as the spinel-aluminate family. It is naturally available in a mineral called gahnite. ZnAl2O4 has almost normal spinel structure [3]. Like other normal spinel structures, ZnAl2O4 has cubic symmetry, Fd−3m space group and 8 formulae per unit cell [4]. The O2− ions form a closed-packed structure with 64 tet and 32 oct interstices per unit cell. As mentions previously, only 1/8 of the tet voids are occupied by Zn2+, while the Al3+ occupies half (½) of the oct voids. Generally, in one FCC unit cell, the effectual number of ions occupying the lattice point is 4 [5]. Concurrently, the effectual number of ions in the oct and tet voids are 4 and 8, respectively. Hence, in ZnAl2O4, Zn2+ ions occupy 8×1/8×8=8 tet sites of Td symmetry and Al3+ ions occupy 8×½×4=16 oct sites of D3d symmetry; while O2− ions occupy 8×4=32 sites of C3v symmetry [6]. Fig. 1(a) shows the schematic illustrations of the ZnAl2O4 unit cell with only five oct and seven tet sites. Fig. 1(b) and (c) shows the coordinates of the tet site and the oct site, respectively.
 a unit cell with five oct sites (mint green) and seven tet sites (lilac blue), (b) double tet and (c) oct coordinates.")
Transition-metals have edge over rare earth elements from an economic point of view [7,8]. They have the capacity to give broadband emission in the visible and infrared regions [2,8–11], which leads to their aptness in tunable radiation sources in optical devices [12–15]. In particular, Fe3+ doped matrices are of special importance due to its ability to emit in lower and higher wavelength ends of the visible spectrum when doped into tet and oct sites, respectively [2,16].
Electrical neutrality can be maintained in a solid material through charge balance. Charge imbalance can lead to the formation of charge defects in the host lattice and hence creates non-radiative luminescence centers in the material [17]. The presence of non-radiative transitions, largely, can reduce the luminescence emission intensity and hence luminescence efficiency of a phosphor [18]. Different charge compensation models have been used in enhancing the luminescence of phosphors [17,19–21]. The first model involves a divalent ion replaced by a trivalent ion. In this model, the host has to capture one O2 from the air to balance the charge differently. The second model involves replacement of three divalent ions by two trivalent ions, with the charge balance contributed by the extra vacancy provided by the excess divalent ion. In the third model, two divalent ions are replaced by one trivalent ion and one alkali metal ion (monovalent ion) is used to balance the charge. The relative intensities of the phosphors prepared using the second and third model was found to be twice that of the phosphor prepared using the first [20].
In different instances, researchers have reported ZnAl2O4 doped trivalent metal ions (Dy3+, Eu3+, Td3+, Fe3+, Fe3+, Ce3+), while substituting the trivalent metal ions in the place of Zn2+, without considering the consequences of charge imbalance on the luminescence properties [1,2,22,23]. Hence, in this report, the luminescent properties of Zn(1−x)Fex3+Al2O4 and ZnAl(2−x)Fex3+O4 (x=0, 0.01, 0.025, 0.05, 0.08) matrices were studied. In the Zn(1−x)Fex3+Al2O4 system, one Zn2+ ion was substituted by one Fe3+ ion. Because of the charge imbalance in this system, the host has to trap ambient O2 to compensate for charge. In the ZnAl(2−x)Fex3+O4 system, one Al3+ ion was substituted by one Fe3+ ion ensuring direct charge balance system.
ExperimentalSynthesisZnAl2O4 doped with different mol% of Fe3+ were synthesized using the Pechini synthesis method. The starting materials were zinc nitrate hexahydrate (Zn(NO3)2·6H2O), aluminum nitrate nonahydrate (Al(NO3)3·9H2O), iron nitrate nonahydrate (Fe(NO3)3·9H2O), tartaric acid (C4H6O6) and nitric acid. For the undoped sample, 3.245 and 8.184g mass of Zn(NO3)2·6H2O, and Al(NO3)3·9H2O, respectively, were dissolved in 10mL of nitric acid in a glass beaker, and it was labeled solution “A”. 6.549g of C4H6O6 was dissolved in 40mL of distilled water in a different glass beaker, and it was labeled solution “B”. Solutions “A” and “B” were stirred using different magnetic stirrers on a hot plate set at 150°C for about 20min until transparent solutions were obtained. The two transparent solutions were combined and the mixture was stirred at 150°C temperature for about 2h until the liquid evaporated. Prior to the end of the reaction, an evolution of a brownish fume was observed. Still, inside the glass beaker, the sample was dried at 80°C for 10h to get white powder. After grinding the sample with an agate mortar and a pestle, it was calcined at 600°C for 3h. For the doped samples, different amount of Fe(NO3)3·9H2O (0.0008, 0.0022, 0.0044, 0.0071g) were added to substitute Al(NO3)3·9H2O and create matrices of the form ZnAl(2−x)Fex3+O4 (x=0.01, 0.025, 0.05, 0.08). A matrix of the form Zn(1−x)Fex3+Al2O4 (x=0.05) was also created by substituting Zn(NO3)2·6H2O with 0.0022g of Fe(NO3)3·9H2O, the aforementioned procedure was repeated.
CharacterizationA Bruker D8 Advanced X-ray diffractometer (XRD) using monochromatic Cu Kα (λ=1.5406Å) X-ray as radiation source was used to characterize the structure of the materials. The morphologies and the elemental analysis of the powders were studied using a JEOL JSM-7800F field emission scanning electron microscope (FE-SEM) fitted with Oxford X-MaxN 80 energy-dispersive X-ray spectrometer (EDS). A PHI 5000 Versaprobe-scanning ESCA microprobe X-ray photoelectron spectroscopy (XPS) was used to obtain the chemical and electronic state data of the samples. A PerkinElmer Lambda 950 UV-Vis spectrometer was used to record the ultraviolet–visible (UV–vis) diffuse reflectance data. An FLS980 fluorescence spectrometer-(Edinburgh Instruments) fitted with a 450W Xenon lamp as a source of steady-state excitation was used to collect the PL data.
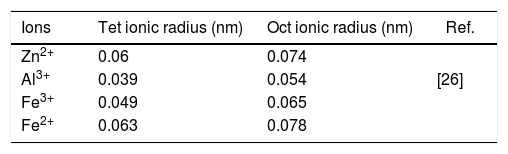
Results and discussionFig. 2(a) shows the XRD patterns of ZnAl(2−x)Fex3+O4 (x=0, 0.01, 0.025, 0.05, 0.08) compared to the standard phase of ZnAl2O4, referenced in JCPDS file no. 82-1043. All the samples show identical patterns as the standard data of spinel ZnAl2O4, indicating that they crystallized in a single-phase cubic symmetry and Fd3m space group of ZnAl2O4. Fig. 2(b) shows the XRD pattern in the diffraction angle range of 36.6–37.6 (2θ), depicting the (311) diffraction plane. It is seen from Fig. 2(b) that the (311) peak shifted to the lower diffraction angle relative to the undoped sample with increasing Fe3+[24,25]. The shift may be due to distortions in the ZnAl2O4 host lattices since the dopant (Fe3+) have larger ionic radius than Al3+ (see Table 1) [26].
Fex3+O4 (x=0, 0.01, 0.025, 0.05 and 0.08) and the JCPDS standard.")
The ionic radii of Zn2+, Al3+, Fe3+ and Fe2+ in the tet and oct coordinates.
| Ions | Tet ionic radius (nm) | Oct ionic radius (nm) | Ref. |
|---|---|---|---|
| Zn2+ | 0.06 | 0.074 | |
| Al3+ | 0.039 | 0.054 | [26] |
| Fe3+ | 0.049 | 0.065 | |
| Fe2+ | 0.063 | 0.078 |
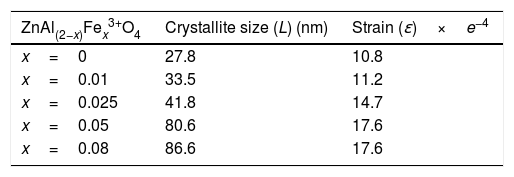
The average crystallite size (L) of the phosphors is related to its lattice strain (ɛ) by Williamson–Hall equation [27,28] given by Eq. (1):
where βh k l is the full width at half maximum (FWHM) of each diffraction peak, λ is the wavelength of the X-ray (0.15406nm) used for measurement, θ is the Bragg angle and κ is a constant related to the crystallite shape, taken as 0.9 for spherical crystals. From a graph of βh k l Cos θ versus 4 Sin θ, the crystallite size and the strain were determined from the y-intercept and the slope of the graph, respectively. The estimated values of the crystallite sizes and the strain for the undoped sample and for the samples doped with different concentration of Fe3+ are listed in Table 2. It is evident from Table 2 that the crystallite size and the strain increased with the Fe3+ concentration.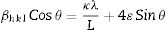
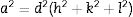
The lattice constant (lattice parameter) defines the physical dimension of a unit cells in a crystal lattice. For a cubic crystal, the lattice parameter (a) (the length of the edges of the unit cells), the interplanar spacing (d) (the perpendicular distance between successive parallel planes of the atoms in a crystal), and the Miller indices (hkl) (notations for planes in crystal lattices) are related by Eq. (2)[29]:
The d is related to the X-ray wavelength (λ) and the diffraction angle (θ) by Eq. (2):

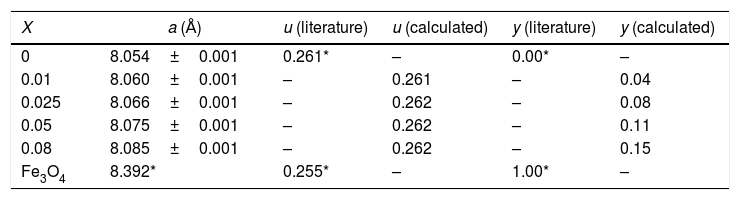
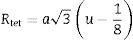
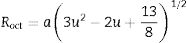
Hence, the values of ‘a’ and ‘b’ can be calculated using Eqs. (2) and (3) and the value of the ‘θ’ can be determined from the XRD data. The calculated values of a are listed in Table 2. In spite of having cubic symmetry, spinels structures cannot be explained entirely by the lattice parameters (a). An additional dimensionless parameter (oxygen parameter, u) is used to define the slight distortion that occur in the FCC oxygen lattice for a complete description of the spinel lattice points [30]. For an undistorted oxygen lattice in spinels, u=0.250 if the origin of the unit cell is taken at the center of symmetry. The oxygen parameter, u, the lattice parameter, a, and the cation-anion distance in the tet and oct sites (Rtet and Roct, respectively) are related by Eqs. (4) and (5)[31]:
Inasmuch as a and u give information about the lattice positions, for an absolute representation of the spinel lattice, the proportion of cations occupying the different sites should be determined. The distribution parameter (y) is the degree of inversion and it defines the fraction of the trivalent ions occupying the tet sites. Hence, it varies from 0 to 1 for totally normal and inverse spinels, respectively. Eqs. (4) and (5) are valid for only “perfect” normal or inverse spinels. The distribution of cations in the sites of normal spinels such as gahnite, ZnAl2O4, is represented by formula {1}:
with the divalent cations, Zn2+, occupying the tet sites (tet) and the trivalent cations, Al3+, occupying the oct sites [30]. Doping ZnAl2O4 with different concentrations Fe3+ will result in the formation of ZnAl(2−x)Fex3+O4 composite, resulting in the creation of some Fe–O–Fe bonds in the matrix. This may lead to the formation of some spinel ferrites (ZnFe2O4), which have similar structure as ZnAl2O4, within the matrix [32]. Furthermore, some of the Fe3+ can be reduced to Fe2+ as confirmed by the XPS result (Fig. 8(a)) via the equation Fe3++e−→Fe2+[33,34], resulting in the formation of iron oxides, such as Fe3O4 (magnetite) within the ZnAl(2−x)Fex3+O4 matrix. The existence of Fe2+ in the matrices indicates that ZnAl(2−x)Fex3+O4 does not crystallize in a pure normal spinel phase, rather it crystallized as a mixture of normal and inverse spinel, since Fe3O4 crystallizes in an inverse spinel. In inverse spinels, such as magnetite, Fe3O4, the distribution of the cations in the sites are represented by formula {2}:
with one-half of the trivalent cations, Fe3+, occupying the tet sites, while both the divalent cations, Fe2+, and the remaining Fe3+ share the oct sites [30].
Furthermore, a solid solution formed by ZnAl(2−x)Fex3+O4 and Fe3O4 is represented by formula {3}, by combining formula {1} and {2}, bearing in mind that Zn2+ and Fe3+ prefer the tet site in ZnAl2O4 and Fe3O4, respectively.

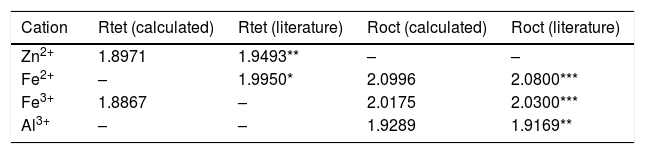
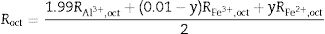
In formula {3}, we assumed that ZnAl2O4 and ZnFe2O4 have similar structure (normal spinels), and hence the combination of the two compounds should not have substantial effect on the spinel type. Formula {3} will form a solid solution with properties lying between normal and inverse spinels. In the case where more than one cation occupies the same site, the bond length is determined by finding the effective bond length – i.e. the average of the individual cationic bond length [30]. Therefore, for a cation, i with bond length Ri and mole fraction zi on the tet site the effective bond length is defined by Eq. (6):

also, a similar expression is used for Roct. The bond lengths were determined by combining Eqs. (4)–(6), and substituting the values of u and a for the end members, ZnAl2O4 and Re3O4 from Table 3. Also keeping in mind that the tet sites are completely occupied by Zn2+ in ZnAl2O4 and by Fe3+ in Fe3O4. The resulting values of the bond lengths are listed in Table 3.
The lattice parameters and inversion degree of different spinel composition.
| X | a (Å) | u (literature) | u (calculated) | y (literature) | y (calculated) |
|---|---|---|---|---|---|
| 0 | 8.054±0.001 | 0.261* | – | 0.00* | – |
| 0.01 | 8.060±0.001 | – | 0.261 | – | 0.04 |
| 0.025 | 8.066±0.001 | – | 0.262 | – | 0.08 |
| 0.05 | 8.075±0.001 | – | 0.262 | – | 0.11 |
| 0.08 | 8.085±0.001 | – | 0.262 | – | 0.15 |
| Fe3O4 | 8.392* | 0.255* | – | 1.00* | – |
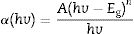
It is seen from formula {3} that Zn2+ and Al3+ only occupy the tet and oct sites, respectively. Hence, the change of the crystal structure with the composition of Fe will depend on the distribution of the Fe3+ and Fe2+ cations in the available tet and oct sites, respectively. In additions, a varies linearly with the dopant concentration (x) (see Fig. 3), hence, the distribution of Fe2+ and Fe3+ varies linearly within the crystal. For y fraction of Fe3+ and Fe2+ occupying the tet and oct sites, respectively, Rtet and Roct are given by Eqs. (7) and (8), respectively, for the sample with x=0.01.

 of ZnAl(2−x)Fex3+O4 (x=0, 0.01, 0.025, 0.05, 0.08) as a function of the Fe3+ ion concentration.")
By equating Eqs. (4) and (5) to Eqs. (7) and (8), respectively, and substituting the values of the bond lengths R and the lattice parameters a, the values of y and u can be determined. Following the same procedure, the value of y and u is determined for the rest of the samples, and the results are presented in Table 4.
Calculated bond lengths of the cations-O in ZnAl(2−x)Fex3+O4 system in the tet and oct sites compared to the literatures.
The FE-SEM images of the undoped and 0.08mol% Fe3+ doped ZnAl2O4 are shown in Fig. 4(a) and (b), respectively. Fe3+ doping showed no significant effect on the morphologies of the phosphors. Both images show agglomerated spherical grains with what appear to be distinctive grain boundaries and varying grain sizes. The average diameters of the particles were taken randomly using the line tool in the ImageJ software, version IJ 1.46r [37]. The size distribution curves were obtained from the FE-SEM images, with estimated mean grain sizes of 112±5 and 118±6nm for the undoped and 0.08mol% Fe3+ doped ZnAl2O4 as shown in the insets of Fig. 4(a) and (b), respectively. The estimated grain sizes for the samples doped with other mol% of Fe3+ (x=0.01, 0.025, 0.05, 0.08) were 115, 117, 124 and 128nm, respectively. Compared to the crystallite size obtained from the XRD data, the grain size is much bigger. Wang, Li, and Tamrakar et al. have reported similar result [38–40]. The grain size and the crystallite size of the particles are different owing to the formation of polycrystalline aggregates [41], which appears as one particle in SEM, especially in amorphous materials [39].
Fex3+O4 (a) x=0 and (b) x=0.08. The inset of (a) and (b) depicts the average particle size distribution curves for the images thereof.")
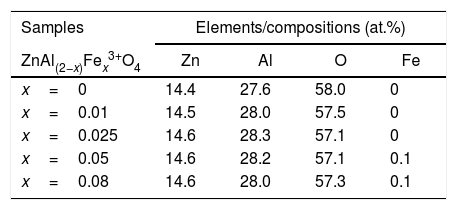
The EDS was used for the semiquantitative and the elemental composition analysis of ZnAl(2−x)Fex3+O4, x=0–0.08 phosphors and the spectra for x=0 and 0.08 are shown in Fig. 5(a) and (b), respectively. The elements (Zn, Al and O) expected in the compounds are present in the EDS spectra of the all samples. In the doped samples, 0.1at.% of Fe was observed in the samples with high concentration of Fe (x=0.05 and 0.08). The same amount of Fe was measured in the EDS spectra of the samples, even though they contain different concentration of Fe. This could be due to the detection limit of the technique ∼ 0.1% [42]. This imply that measured values of 0.05 and 0.14% should be approximated to 0.1%. The presence of carbon (C) in the EDS spectra could be from environmental hydrocarbon and/or carbon tape on which the samples were mounted. The insets of Fig. 5(a) and (b) are the measured elemental concentration at.% of all the elements present in the ZnAl(2−x)Fex3+O4, x=0 and 0.08 samples, and Table 5 presents the elemental concentration at.% present in the ZnAl(2−x)Fex3+O4 (x=0, 0.01, 0.025, 0.05 and 0.08) phosphors.
Fex3+O4 (a) x=0 and (b) x=0.08. The inset of (a) and (b) are the at.% elemental concentration.")
XPS is an in situ technique where a specimen is irradiated with X-rays leading to ionization, and ejection of photoelectrons from the core-shell and the kinetic energies distribution are measured using electron energy analyzer and a photoelectron spectrum can thus be recorded [43]. XPS was used to determine the electronic and chemical bonding state from the surface of the samples. The XPS spectra were fitted using the PHI MULTIPAK software, version 8.2C [44].
Fig. 6(a)–(d) shows, respectively, the fitted high-resolution O 1s XPS spectra of ZnAl(2−x)Fex3+O4 for x=0, 0.01, 0.05 and 0.08. The spectra show two peaks for the undoped ZnAl2O4 sample (x=0, Fig. 6(a)), but exhibits three peaks for the Fe3+ doped samples (x=0.01, 0.05 and 0.08, Fig. 6(b–d)). The two components centered at 531.3 and 533.0eV in Fig. 6(a) are ascribed to the metal–oxygen (M–O) bonds [45] and O–H bonds from water molecules absorbed from the environmental moisture, respectively [46,47]. The additional peak centered at 534.1eV for x=0.01 and 534.0eV for x=0.05 and 0.08 is ascribed to the Fe–OH bonds [48]. This indicates that Fe ions were incorporated successfully into the ZnAl2O4 host. The peaks belonging to M–O and O–H bonds in Fig. 6(a)–(d) shifted slightly to lower binding energy after Fe3+ doping.
Fex3+O4, (a) x=0, (b) x=0.01, (c) x=0.05 and (d) x=0.08.")
The Al 2p high-resolution XPS spectra for ZnAl(2−x)Fex3+O4 (x=0, 0.01, 0.05 and 0.08), are shown, respectively, in Fig. 7(a)–(d). The two peaks centered at 74.2 and 75.1eV in Fig. 7(a) were ascribed to Al ions occupying the tet and oct sites by Tshabalala et al. [49], in comparison with a report on Y3Al5O12 (YAG) by Pawlak et al. [50]. However, YAG has an entirely different structure from ZnAl2O4. In the ZnAl2O4 system, the tet sites is occupied by only Zn2+ ions and the oct sites is occupied by only Al3+ ions [30] as shown in Fig. 1 and by formula {1}, while in YAG, Al3+ ions can occupy both tet and oct sites [50]. Furthermore, similar XPS peaks have been observed in doped Al2O3 samples and where assigned to M–Al–O or M–Al (M=metal ion) [51–55]. For instance, in the La1−xAlxO3 system, it was assigned to La–Al–O by Fei et al. [51], while in the Ru/La(x)–Al2O3 system, it was assigned to Al–La by Chung et al. [52]. Another point that is worth noting is that the peak around 76.0eV in Fig. 7(b)–(d) (assigned to tet Al by Tshabalala et al. [49]) appears at higher binding energy compare to the other peak (around 74eV) which they assigned to oct Al. However, it is expected that the higher the number of oxygen coordinating a metal ion, the higher the binding energy since the binding energy increase with electronegativity [56]. Therefore, we believe that the photoelectron peaks at the lower binding energy (74.2eV) and higher binding energy (75.1eV) in Fig. 7(a) are due to the Al–O in AlO6 (Al3+ ions in the oct sites) [49] and AL–OH [57] in AlO6, respectively. For the Fe3+ doped samples, an additional photoelectron peak appeared at the higher binding energy centered at 76.0eV for the sample doped with 0.01mol% of Fe3+ (x=0.01) and at 76.1eV for (x=0.05 and 0.08) as shown in Fig. 7(b)–(d). It is also evident from Fig. 7(b)–(d) that the peaks from Al–O and AL–OH shifted to lower binding energies at higher Fe3+ doping concentration. The additional peaks observed at 76.0eV in Fig. 7(b) and at 76.1eV in Fig. 7(c) and (d), are assigned to the Al–O–Fe at the oct sites, in the ZnAl(2−x)Fex3+O4 system [51,52]. It is interesting to observe that the intensity of the photoelectron peaks from the Al–O–Fe increased with increasing Fe3+ concentration, but the intensities of the photoelectron peaks from Al–O decreased. This shows that more Al–O–Fe are created in the ZnAl(2−x)Fex3+O4 system with increasing Fe3+ concentration. The peaks assigned to Al–O–Fe in Fig. 7(b)–(d) appears at higher binding energy with respect to the other peaks assigned to Al–O and AL–OH, because Fe (1.83) have higher electronegativity than Al (1.61) [58].
Fex3+O4, (a) x=0, (b) x=0.01, (c) x=0.05 and (d) x=0.08.")
The deconvoluted Zn 2p XPS spectra for the ZnAl(2−x)Fex3+O4 (x=0, 0.01, 0.05 and 0.08) are shown in Fig. 8(a)–(d), respectively. For the undoped ZnAl2O4 shown in Fig. 8(a), a double peak from the Zn 2p core-level were observed at 1021.9 and 1045.0eV and are assigned to the Zn 2p3/2 and Zn 2p1/2[59] from the Zn occupying the tet site (ZnO4) in ZnAl2O4, respectively. For the Fe3+ doped samples (Fig. 8(b–d)), a new photoelectron peak was observed at the higher binding energy with respect to the Zn 2p3/2 and Zn 2p1/2 peaks which shifted to high binding energy values with increasing Fe3+ ions concentration. These peaks are centered at 1022.7 and 1045.9eV, 1023.4 and 1046.5eV, 1024.4 and 1047.6eV for ZnAl(2−x)Fex3+O4 (x=0.01, 0.05 and 0.08), respectively, as shown in Fig. 8(b)–(d) and they are assigned to Zn–O–Fe in the tet sites. Yngman et al. have reported a similar result in Zn doped GaAs [60], Li et al. in Cu doped ZnS [61] and Beltrán et al. in carbon doped ZnO [62].
Fex3+O4, (a) x=0, (b) x=0.01, (c) x=0.05 and (d) x=0.08.")
The peaks assigned to Zn–O–Fe in Fig. 8(b)–(d) appeared at higher binding energy values with respect to the peaks assigned to Zn in ZnO4, because Fe (1.83) have higher electronegativity than Zn (1.65) [58]. However, Zhang et al. [59,63] attributed the photoelectron peaks at the lower binding energies in Zn 2p3/2 and Zn 2p1/2 to Zn2+ ions occupying tet sites and the photoelectron peaks at higher binding energies in Zn 2p3/2 and Zn 2p1/2 to Zn2+ occupying the oct sites in ZnAl2O4:Cr3+ system. However, they did not show the XPS spectrum for the undoped ZnAl2O4. In Fig. 8(a), the XPS spectrum for the undoped ZnAl2O4 did not show any sign of the two photoelectron peaks sitting at the higher binding energies with respect to the Zn 2p3/2 and Zn 2p1/2 peaks. This suggests that the two peaks sitting at higher binding energies to Zn 2p3/2 and Zn 2p1/2 peaks in Fig. 8(a) are associated with Fe ions. The intensities of the photoelectron peaks from the Zn–O–Fe in Fig. 8(b)–(d) increased as the Fe3+ ions concentration increased in ZnAl(2−x)Fex3+O4 system. However, unlike the Al 2p peaks, there was no significant change in the Zn 2p peaks intensities. The formation of Zn–O–Fe and Al–O–Fe bonds in the ZnAl2O4: Fe3+ matrices suggest the possibility of existence of tet and oct Fe in these matrices.
The Fe XPS peaks could not be detected in the samples doped with concentration of up to 0.08mol%, hence we prepared another sample doped with 4mol% of Fe3+. Fig. 9(a) shows the deconvoluted XPS spectrum for Fe 2p peak. The spectrum consists of the shake-up peaks (satellite peaks) and the Fe 2p3/2 and Fe 2p1/2 components. Each component of the Fe 2p peak consist of two Fe ion peaks signifying the different oxidation states of Fe ion (Fe2+ and Fe3+). The shape-up peaks were located relatively at higher binding energies of 713.0eV and 725.4eV with respect to the 2p3/2 and 2p1/2 components, respectively [64,65]. The photoelectron peaks at the lower binding energies (704.6 and 717.6eV) in the Fe 2p3/2 and 2p1/2 components were assigned to Fe2+, while the two peaks at the higher binding energies (706.8 and 720.7eV) in the Fe 2p3/2 and 2p1/2 components were assigned to Fe3+[64–66]. With the presence of Fe2+ in the crystal, Fig. 9b(i–iii) shows the possible structural makeup of the samples. The structure is made up of a mixture of ZnAl2O4 with tet Zn2+ and oct Al3+ (Fig. 9b(i)), ZnFe2O4 with tet Zn2+ and oct Fe3+ (Fig. 9b(ii)), and Fe3O4 with tet Fe3+ and oct Fe2+ or Fe3+ (Fig. 9b(ii)).
 The fitted high-resolution Fe 2p XPS spectra of the ZnAl2O4: 4% Fe3+. (b) The structural makeup of ZnAl2O4:Fe3+.")
The UV–vis spectrometer was used to measure the diffuse reflectance of ZnAl(2−x)Fex3+O4 (x=0, 0.01, 0.025, 0.05, 0.08) phosphors in the wavelength range of 250–800nm and the spectra are shown in Fig. 10. The diffuse reflectance spectra show the ZnAl2O4 band-to-band transition around 305nm.
Fex3+O4 (x=0, 0.01, 0.025, 0.05, 0.08) phosphors.")
The band gaps of the phosphors were determined from the diffuse reflectance data using the derivative method and Kubelka–Munk function. In the derivative method, the band gap is determined by taking the first derivative, dR/dE, of the diffuse reflectance data and plotting it against the energy E (eV) [67] (the wavelength was converted to energy using the relation, E (eV)=1240/λ (nm)). In general, the absorption coefficient of a material is related to the band gap by
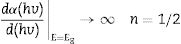
where h is Planck's constant, v is the frequency, Eg is the material band gap and n depends on the nature of the transition and can take values of ½, 3/2, 2 or 3 for allowed direct, forbidden direct, allowed indirect and forbidden indirect transitions, respectively. A is an energy independent proportionality constant [68]. Eq. (9) can be written as: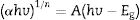
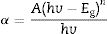
For a direct band gap material, the absorption coefficient is a function of energy, α(hv), hence Eq. (10) can be expressed as
Eq. (11) is true for hv>Eg but 0 if hv<Eg. Taking the first derivative of Eq. (11) with respect to hv gives
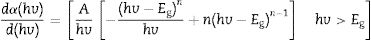
Eq. (12) diverges at a point when hc/E=hc/Eg, and this correspond to the band gap of a direct band gap material. At this point Eq. (12) is reduce to
For a direct band gap material, Eq. (13) show a distinct sharp peak, usually taken as the band gap of the material [67]. Fig. 11 shows the plots of dR/dE versus E (eV) for the ZnAl(2−x)Fex3+O4 (x=0, 0.01, 0.025, 0.05, 0.08) phosphors. It is evident from Fig. 11 that the band gap of the undoped ZnAl2O4 is about 4.23eV. This is in agreement with some of the ZnAl2O4 band gap reported in the literature [69,70]. The band gap decreased slightly to 4.17eV when 0.01mol% of Fe3+ was doped into the matric. This could be due to the smaller band gap of ZnFe2O4[71,72] compare to ZnAl2O4[69,70]. However, no increased was observe in the band gap for a further increase in the concentration of Fe3+.
 for the ZnAl(2−x)Fex3+O4 (x=0, 0.01, 0.025, 0.05, 0.08) phosphors.")
The Kubelka–Munk function is based on the direct and indirect proportionality relation between the absorption coefficient (α) of a material and the R, respectively. R is the reflectance of the material. For a semi-infinite medium, Kubelka–Munk is defined by Eq. (14):
where R∞ is the reflectance of the semi-finite medium [73]. For a finite medium with 100%, Eq. (14) takes the form of Eq. (15):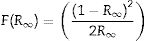
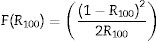
Considering that F(R∞) is proportional to the α, and equating Eqs. (9) and (15) gives Eq. (16):
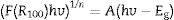
From Eq. (16), the band gap can be estimated by plotting a graph of (F(R100)hv)2 versus hv and drawing a straight line from the inflection point of the curve to the hv-axis. Fig. 12 shows the (F(R100)hv)2 versus hv plot for the ZnAl(2−x)Fex3+O4 (x=0, 0.01, 0.025, 0.05, 0.08) phosphors. Interestingly, the values of the band gaps are in agreement with those estimated with the derivative method, with 4.20eV for the undoped ZnAl2O4 and 4.17eV for all the doped samples.
hv)2 versus hv for the ZnAl(2−x)Fex3+O4, (a) x=0, (b) x=0.01, (c) x=0.025, (d) x=0.05, and (e) x=0.08.")
The non-increment in the band gap with increasing concentration of Fe3+ can be explained by Harrison's tight binding (TB) model [74], which proposed that:
- (i)
The top of the valence band of the host does not change significantly for a small concentration of the dopant and the doped matrix can be adequately explained within the virtual-crystal approximation method.
- (ii)
The position of the energy of the dopant (impurity) is independent of its concentration (even at the smallest possible concentration). However, at higher concentration, small shifting and broadening of the dopant states may occur (owing to the electrostatic interactions between the dopant atoms and/or the difference in the bond lengths of the host and the dopant within the matrix.
Fig. 13(a) and (b) shows the PL excitation and emission spectra of ZnAl(2−x)Fex3+O4 (x=0, 0.01, 0.025, 0.05, 0.08) phosphors normalized with respect to the dopant concentration, respectively. The excitation spectra (Fig. 13(a)) was obtained when monitoring the emission at 483nm and scanning the spectrum in the wavelength range of 200–450nm. Within this wavelength range, two broad bands were observed from 200 to 275nm, with a maximum at 235nm, and from 325 to 415nm, with a maximum around 374nm. The peak at 235nm could be due to the band-to-band transition of ZnAl2O4. The broadband peaking around 374nm could be relate to ZnO band-to-band transition [75]. Similar transitions were observed from the absorbance and reflectance of the ZnAl2O4 samples [4,76,77]. Under the 235nm excitation, two broad emission bands could be distinguished, one with a maximum around 483nm and the other around 730nm, as shown in Fig. 13(b).
 excitation (under 487nm emission) and (b) emission (under 235nm excitation) spectra of ZnAl(2−x)Fex3+O4 (x=0, 0.01, 0.025, 0.05, 0.08) phosphors normalized with respect to the dopant concentration. The inset of (a) shows the variation of the 487 and 730nm bands as a function of Fe3+ concentration.")
The PL (a) excitation (under 487nm emission) and (b) emission (under 235nm excitation) spectra of ZnAl(2−x)Fex3+O4 (x=0, 0.01, 0.025, 0.05, 0.08) phosphors normalized with respect to the dopant concentration. The inset of (a) shows the variation of the 487 and 730nm bands as a function of Fe3+ concentration.
The inset of Fig. 13(a) shows how the emission intensities of the 487 and 730nm bands varied with Fe3+ concentration. It is apparent from the inset of Fig. 13(a) that the emission intensity of the 487nm band dropped sharply after doping with just 0.01mol% of Fe3+, but as the concentration of Fe3+ increased, the change in the emission intensity became infinitesimal and intermittent. A similar trend in the luminescence intensity has been reported in ZnGa2O4 and ZnAl2O4[78,79]. However, the 730nm emission band increased with the Fe3+ doping concentration, attaining maximum at 0.05mol% of Fe3+ and decreased afterwards. The emission band observed at 487nm in the ZnAl2O4 (x=0) is assigned to the defect related intra-band transitions, such as oxygen vacancies and Zn2+ interstitials in the spinel lattice [2,80]. The quenching of the 487nm band on Fe3+ doping suggests that the introduction of Fe3+ into the ZnAl2O4 system must have decreased the oxygen vacancies and Zn interstitial sites [77], with Fe3+ filling some of the Zn interstitials. This will lead to the creation of some Fe–O–Fe bonds in the matrix and hence resulting in the formation of ZnAl(2−x)Fex3+O4 composite. Contrary to the 487nm bands, the emission intensities of the bands at 730nm shows distinctive increment with Fe3+ concentration, with the highest emission intensity obtained from the samples with 0.05mol% of Fe3+. Observe the slight blue shift in the emission band maximum from 487 to 470nm for the undoped and 0.08mol Fe3+ doped sample. This indicates that these bands were not from the same origin. The emission bands at 470 and 730nm in Fe3+ doped samples are ascribed to Fe ions occupying the tet and oct sites of ZnAl2O4 host, respectively. The PL from the tet coordinated Fe ions is attributed to the 4E+4A1(4G)→6A1(6S) transition, while the oct coordinated Fe ions is attributed to the 4T2(4G)→6A1(6S) [81]. As observed from the XPS result (Fig. 9(a)), part of the Fe3+ was reduced to Fe2+, hence both the tet and the oct emission could be from a mixture of Fe2+ and Fe3+ ions.
The decay curves originating from the 487 and 730nm emission under the 235nm excitation of the ZnAl(2−x)Fex3+O4 (x=0, 0.01, 0.025, 0.05, 0.08) phosphors are shown in Fig. 14(a) and (b), respectively. The decay curves were nicely fitted by a triple exponential equation given by Eq. (17):
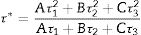
with I the PL intensity, A, B and C are the fitting parameters, while τ1, τ2 and τ3 are the decay constants of the exponential components [82]. The average decay time τ* can be determined using Eq. (18):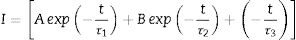
Fex3+O4 (x=0, 0.01, 0.025, 0.05, 0.08) phosphors when monitoring (a) 487nm and (b) 730nm emission under 235nm excitation. The insets of (a) and (b) are the plot of the average lifetime of the phosphors versus the Fe3+ concentration (x) for the 487nm emission and 730nm emissions, respectively.")
The decays curves for ZnAl(2−x)Fex3+O4 (x=0, 0.01, 0.025, 0.05, 0.08) phosphors when monitoring (a) 487nm and (b) 730nm emission under 235nm excitation. The insets of (a) and (b) are the plot of the average lifetime of the phosphors versus the Fe3+ concentration (x) for the 487nm emission and 730nm emissions, respectively.
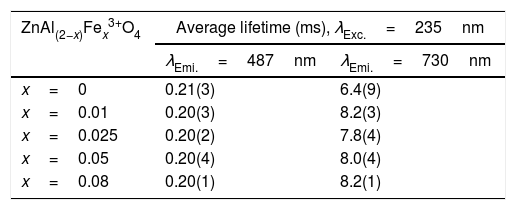
The calculated average decay times for the 487 and 730nm emission bands under 235nm excitation are shown in Table 6. The inset of Fig. 14(a) shows the plot of the average lifetime of the phosphors versus the Fe3+ concentration (x) for the 487nm emission under 235nm excitation. The undoped sample (i.e. ZnAl2O4) has the longest lifetime, after which there was a decrease in the lifetime upon Fe3+ doping. The lifetime measured from the 730nm emission when under the 235nm excitation showed similar behavior like the one observed from the 487nm, but in an opposite manner. As seen in the inset of Fig. 14(b), the undoped sample has the shortest lifetime, and the lifetime increased upon Fe3+ doping. The change in the lifetime upon Fe3+ doping is a demonstration of that the emissions arises from different lattice sites [83]. This is a further proof of the existence of the tet and oct Fe sites within the ZnAl(2−x)Fex3+O4 matrix.
The average lifetime of ZnAl(2−x)Fex3+ O4 (x=0, 0.01, 0.025, 0.05 and 0.08) for 487 and 730nm emissions, when monitoring the excitation at 235nm.
| ZnAl(2−x)Fex3+O4 | Average lifetime (ms), λExc.=235nm | |
|---|---|---|
| λEmi.=487nm | λEmi.=730nm | |
| x=0 | 0.21(3) | 6.4(9) |
| x=0.01 | 0.20(3) | 8.2(3) |
| x=0.025 | 0.20(2) | 7.8(4) |
| x=0.05 | 0.20(4) | 8.0(4) |
| x=0.08 | 0.20(1) | 8.2(1) |
Fig. 15(a) is a schematic energy diagram showing the emission of Fe, zinc interstitials and oxygen vacancies in ZnAl2O4 host. The valence (VB) band is formed by the hybridization of O2− 2p orbitals and Zn2+ 3d orbitals, while the conduction band (CB) is formed by Al 3s and 2p orbitals [4,84,85]. Upon excitation at 235nm UV-light, electrons excited from the VB to the CB are relaxed non-radiatively to the various luminescent centers in the material before giving emissions. Since the combination of ZnAl2O4 and Fe3O4 gives a solid solution of the form, (Zn8−x2+Fex3+)tet[Al8−x3+Fex3+F82+]octO32, with Fe ions in the both sites. The implication of this is that part of the Fe3+ are reduce to Fe2+ in both tet and oct sites. Therefore, the Fe emission from the tet and oct comprises Fe3+ and Fe2+ emissions. Fig. 15(b) illustrates further the schematic energy diagram of Fe ions (Fe3+ and Fe2+) on the tet and the oct sites of ZnAl2O4 host. The Fe2+ ions were generated due to the photoionization Fe3+ that results to the formation of bound-hole state via the equation: Fe3++hv→[Fe2+, h] [86]. The tet site is composed of two emission lines at 470 and 576nm assigned to the 4E+4A1(4G)→6A1(6S) and 4T2(4G)→6A1(6S) transitions of Fe3+, respectively, while the oct site gave an emission line at 730nm (4T1(4G)→6A1(6S)) [81]. The recombination of the trapped electrons (bound-hole state) in the tet and oct sites has not been for ZnAl2O2:Fe3+. However, it has been reported around 693 and 844nm for the oct and tet sites in Fe3O4 (inverse spinel) [87], respectively.
 the emission of Fe, zinc interstitials and oxygen vacancies in ZnAl2O4 host and (b) the electronic transitions Fe ions (Fe3+ and Fe2+) on the tet and the oct sites of ZnAl2O4 host.")
Fig. 16(a) and (b) compares the PL spectra of Zn(1−x)Fex3+Al2O4 and ZnAl(2−x)Fex3+O4 (x=0.05, i.e. Zn(0.95)Fe0.053+Al2O4 and ZnAl(1.95)Fe0.053+O4), respectively, taking into account the influence of charge compensation. It is evident from Fig. 16 that the PL intensity of the sample where Fe3+ substituted Al3+ (Fig. 16(b)) is about twice that of the sample where Fe3+ substituted Zn2+ (Fig. 16(a)). The decreased luminescence intensity in Fig. 16(b) is attributed to the charge imbalance in the matrix due to the substitution of divalent Zn2+ ion by trivalent Fe3+ ion. Charge imbalance can lead to the formation of charge defects in the host lattice and hence creating non-radiative luminescence centers in the material [17].
 Zn(1−x)Fex3+Al2O4 and (b) ZnAl(2−x)Fex3+O4 for x=0.05, excited at 235nm.")
Fig. 17 shows CL spectra of ZnAl(2−x)Fex3+O4 (x=0, 0.01, 0.025, 0.05, 0.08). Generally, the wavelengths of the CL peak maximum shifted with respect to the PL peaks. The peak maximum observed at 487nm in the PL result shifted to 503nm for the undoped sample and 486nm for the doped samples, while the PL maximum observed at 730nm shifted to 703nm. The shift observed in the wavelength maximum of the CL spectra compared to the PL spectra could be relate to the different excitation sources used to excite the samples in both cases. During PL, the charge carriers are excited using photons, while the charge carriers in CL are excited using high-energy electrons. CL can provide a better spatial resolution than PL, this can be correlated to the small beam diameter (<10nm) of the electron beam [88]. Similar to the PL spectra (Fig. 13(a)), the band maximum observed at 503nm in the undoped sample shifts to lower wavelength with increasing Fe3+ concentration, but the 703nm peak remain at the similar position.
ConclusionFex3+O4 (x=0, 0.01, 0.025, 0.05, 0.08) phosphors.")
The Pechini synthesis method has proven to be an easy route to prepare ZnAl2O4 doped Fe3+ phosphors. The XRD results confirmed that the phosphors crystallized at a very low annealing temperature (600°C). The crystallite sizes estimated from the XRD data were smaller than the grain size estimated from the FE-SEM micrograph due to the formation of polycrystalline aggregates in the FE-SEM micrograph. The oxygen parameter (u) and the inversion degrees (y) of the phosphors were estimated from the XRD data. The XPS results confirmed the presence of Fe ions in both the tet and oct sites of ZnAl2O4. Furthermore, the XPS data also confirmed that Fe2+ ions were present in the samples doped with Fe3+, suggesting the reduction of some of the Fe3+ ions to Fe2+ ions. From the diffuse reflectance data, the band gaps of the phosphors estimated using the Kubelka–Munk equation and the derivative method gave similar values. In agreement with the XPS result, the PL and the CL study of the phosphors showed two broad bands at around 470 and 730nm which were assigned to the 4E+4A1(4G)→6A1(6S) and 4T2(4G)→6A1(6S) electronic transitions of Fe3+ ions occupying the tet and the oct sites in the spinel ZnAl2O4 host, respectively.
The authors express their sincere thanks to the South African Research Chairs Initiative of the Department of Science and Technology and the National Research Foundation of South Africa (84415). The financial assistance from the University of the Free State, South Africa is highly recognized.

