


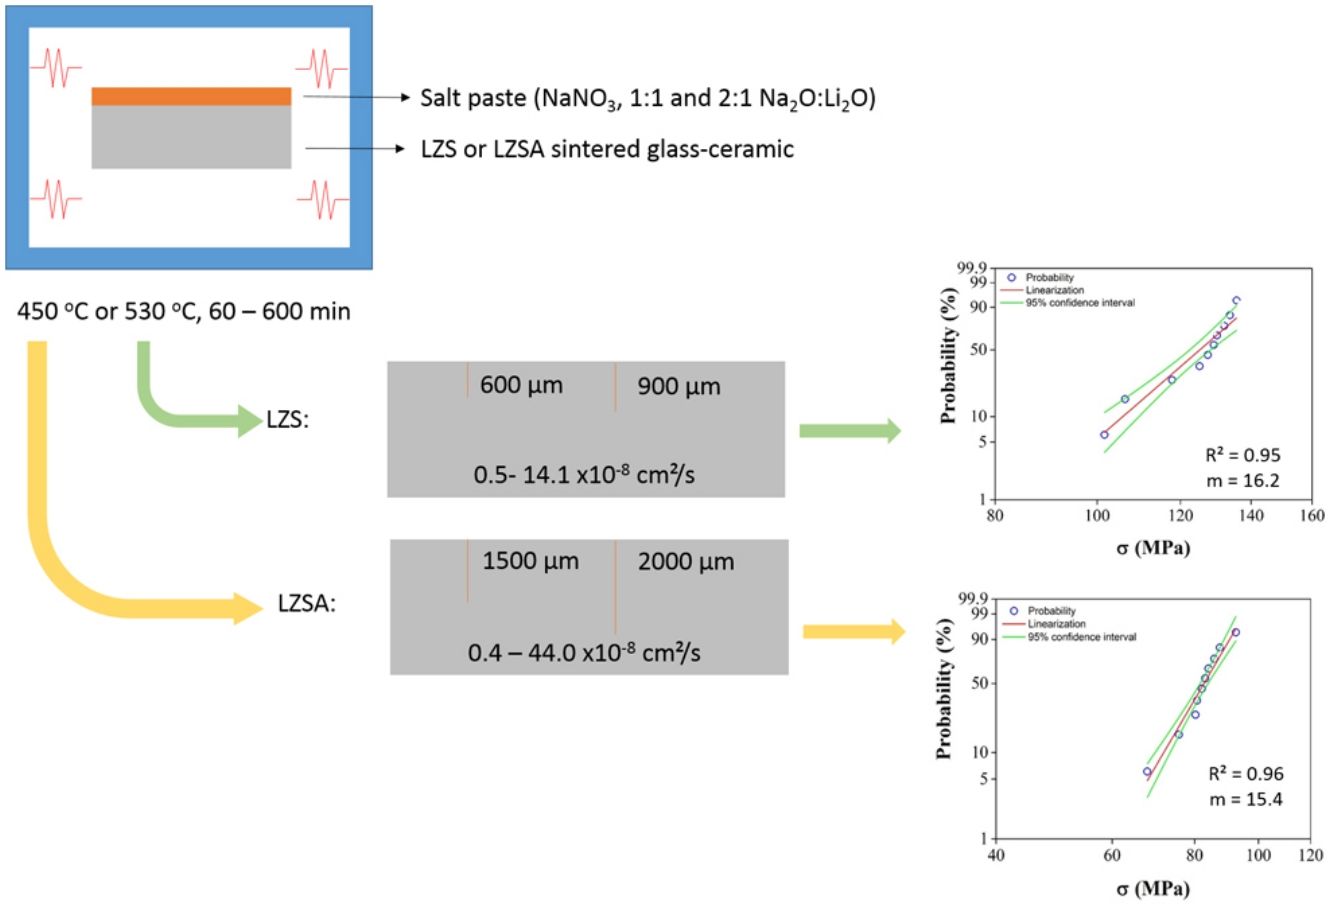
During processing and use of glass and glass-ceramic products, defects are generated, compromising their mechanical strength and one of the methods applied to promote an increase in mechanical strength is the ion exchange. An ion (usually an alkaline with larger ionic radius) from an external source (usually a salt) replaces position with another alkaline ion (with smaller ionic radius) from material. This ion substitution produces residual compressive stress on materials surface, which can promotes an increasing in mechanical strength. In this context, sintered glass-ceramic from the systems Li2O–Zr2O–SiO2 (LZS) and Li2O–Zr2O–SiO2–Al2O3 (LZSA) were subjected to ion exchange by salt paste method using different sodium-lithium ratios, at temperatures 100°C below to the glass transition temperatures of the parent glasses, with 60–600min holding time. Despite the small amount of sodium obtained after ion exchange (0.30–0.80wt.%), the exchange layer verified in sintered LZS glass-ceramics (up to 900μm) resulted in adequate superficial tensions with 14% mechanical strength increase. Otherwise, the sodium content presented in sintered LZSA glass-ceramics after ion exchange (0.40–0.70wt.%) was distributed in an excessive exchange layer (up to 2000μm) which resulted in decrease of 42% on mechanical strength. For both glass-ceramics systems studied, an increase of Weibull modulus was verified.
Durante el procesamiento/uso de vidrios y vitrocerámicas se generan defectos que comprometen su resistencia mecánica y un método utilizado para promover mayor resistencia es el intercambio iónico. Un ion (generalmente alcalino con radio iónico mayor) de una fuente externa (generalmente una sal) reemplaza la posición con otro ion alcalino (con radio iónico menor) del material. Esta sustitución iónica produce un esfuerzo de compresión residual en la superficie del material y esto promueve aumento de la resistencia mecánica. En este contexto, vitrocerámicas sinterizadas de los sistemas Li2O – Zr2O – SiO2 (LZS) y Li2O – Zr2O – SiO2 – Al2O3 (LZSA) fueron sometidas a intercambio iónico mediante el método de la pasta de sal utilizando diferentes relaciones sodio-litio, temperaturas de 100°C por debajo de las temperaturas de transición vítrea de los vidrios parentales y tiempos de 60 a 600 min. La pequeña cantidad de sodio obtenida después del tratamiento químico (0,30 – 0,80%) en la capa de intercambio verificada en vitrocerámicas LZS (hasta 900 μm) resultó en tensiones superficiales con aumento de 14% de resistencia mecánica. El contenido de sodio presentado en las vitrocerámicas LZSA (0,40 – 0,70%) se distribuyó en una capa de intercambio excesiva (hasta 2.000 μm) que resultó en disminución del 42% en la resistencia mecánica. Los dos sistemas vitrocerámicos estudiados presentan aumento del módulo de Weibull.
Glass-ceramic materials are polycrystalline solids containing residual glass phase, prepared by melting glass and forming it into products that are subjected to controlled crystallization [1,2]. The concept of controlled crystallization of glass designates the separation of a crystalline phase from the glassy parent phase in the form of tiny crystals, in which the number of crystals, their growth rate and thus also their final size are controlled by suitable heat treatment. This definition indicates that these glass-ceramics are formed using the usual glass-making technologies, originating products with defined shape and dimensions which, in a later stage, are subjected to a heat treatment which results in the crystallization/ceramization of the parent glass (bulk glass-ceramics) [1].
On the other hand, glass-ceramics produced from powders of their glass-ceramic parent glasses (average sizes between 5 and 20μm), using the technologies for the manufacture of ceramic products are called sintered glass-ceramics. In this case, depending on the manufacturing method used, it is possible to mass-produce parts with great shape complexity and those that require great dimensional precision. The process is usually carried out by applying a thermal cycle (generally much shorter, 15–60min, than those used in the manufacture of bulk glass-ceramics) which promotes the sintering and crystallization of the glass compacts (usually overlapping these steps). The glass-ceramic materials thus obtained also present, in addition to the crystalline and vitreous phase, a certain residual porosity [3,4].
The glass-ceramics can be classified form chemical composition and one of these groups is the lithium silicates (Li2O–SiO2 system), which presents high mechanical strength (300–400MPa) and thermal expansion (approximately 100×10−7°C−1), some example of applications are electronic devices and dental prosthesis. Another group is the lithium silico-aluminates (Li2O–SiO2–Al2O3 system) in which the aluminum insertion on the structure promotes high chemical durability, low thermal expansion (approximately 12×10−7°C−1) and moderate mechanical properties (Young modulus between 80 and 120GPa) [5].
The properties of glass-ceramic materials depend mainly on three factors, i.e., (i) intrinsic properties of the residual glass phase; (ii) intrinsic properties of the crystalline phase (s) formed (such as morphology, quantity, size and distribution); and (iii) residual porosity in the case of sintered glass-ceramics [4,6–8]. However, the production of defects caused during their use when put into service, results in a marked decrease in the mechanical strength of these materials. Theoretically, it is estimated that a glass can withstand, on average, stresses of the order of 7000MPa while in reality the glasses do not reach mechanical strength values greater than 100MPa. This is because these materials withstand compression stresses well, but very little tensile stresses. This characteristic, however, is directly related to the size of critical defect (pre-existing defects), which are distributed in a layer of approximately 50μm, resulting in non-uniform stress distribution and consequent decrease in mechanical strength. To solve this problem, there are some methods used to promote increasing in mechanical strength forming a compressive surface layer greater than the flaws present in material [9].
One of these methods is denominated ion exchange or chemical tempering, also known as chemical strengthening, because there is a greater increase in mechanical strength than in toughness or material hardness [10]. Ion exchange is the result of replacing an ion A (present in material) by an ion B (from an external source, usually a salt based on desired element for exchange), with same charge and greater ionic radius. The salt selection is based on parameters such as ideal temperature for processing, the cost and availability for buying it. Nitrates are the most used because they have the lowest melting points [9,11,12].
When atoms have binding energy that allows them switch positions, it is possible to verify the diffusion process through vacancies on material or by interstitial (substitutional) way. The difference between concentrations of elements in two regions is the diffusion driving force, resulting in atomic mobility as described by Fick's first law. This diffusion process promotes reduction in element concentration difference, resulting in a composition more homogeneous. For this movement to occur, an external energy source, usually a thermal origin, must supply the system with an energy amount greater than so-called activation energy, which corresponds to the energy needed to promote the diffusion beginning. In general, materials with a compact crystal structure or with high binding energy between particles (such as ceramic materials formed by covalent and/or ionic bond) need high activation energy values [13,14].
In glass-ceramics, ion exchange generally occurs only on amorphous fraction or in crystalline phase and this processes results in microstructural modifications, which mechanisms can be summarized in four groups [15].
The first mechanism occurs in residual glass and has an effect called “ion stuffing” as consequence of introduction a bigger ion into structure, estimated by Eq. (1)[15,16]
In which [ISS=ion-stuffing stress (MPa), E=Young's modulus (GPa), ν=Poisson's coefficient (dimensionless) and ΔVV =volumetric expansion (dimensionless)].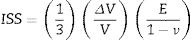
However, this expansion is restricted to the interior of glass fraction, resulting in a compressive stress on surface and a tensile stress inside acting as equilibrium force. This stress profile results in mechanical strength increase and such mechanism is the same verified in glass materials ion exchange [9,10,16,17].
The second mechanism is ion exchange in crystalline phase, in which the atom replacement in crystals occurs, resulting in volume increase and consequence surface tensions formation, improving mechanical strength. The main characteristic of this mechanism is the displacement in X-ray diffractogram peaks before and after the thermochemical process [15].
The third mechanism is superficial amorphization as result of increase in amorphous fraction and decrease in crystals sizes. Since glass is less dense than crystals, this mechanism promotes a volume increase, resulting in compressive surface stress formation and mechanical strength improvement. This mechanism is also identified by the difference in X-ray diffractograms before and after chemical treatment, which the crystalline phases are the same, but an increase in amorphous fraction is verified [15].
The fourth and last mechanism is direct phase change in the main crystalline phase (s) presented in glass-ceramic material. As suggested, the main crystalline phase verified after the chemical treatment is different to that before the ion exchange, analyzed by X-ray diffractogram and chemical characterization [15].
One of the parameters that have influence on diffusion process verified during ion exchange is material chemical composition. Glass with low or no alkaline content, such as borosilicate, do not show significant diffusion during chemical process [16,18]. Presence of aluminosilicates or zirconia content support ion diffusion, since alkalis bond with alumina, reducing the number of non-bridge oxygen, which results in a high diffusion coefficient [9,16]. However, the ratio (Na2O+K2O)/Al2O3=1 does not promote exchange due to the absence of non-bridge oxygen in glass structure [19]. Another parameter that has influence in diffusion coefficient is temperature and time used in exchange process. In general, higher temperatures require less time to develop a sufficient layer that promotes mechanical strength increase. However, for glass materials this temperature is limited to approximately 100°C below the glass transition temperature (Tg) since, above it, the generated stress can be dissipated due to viscous flow [9]. In addition, generated products by salt decomposition at elevated temperatures can promote corrosion on treated material [17].
A manner used to promote ion exchange is the so called salt paste method (mixture of salt and water). In this case, an appropriated salt paste is deposited on one material/part side which is, at a later stage, submitted to a thermal cycle. For this method, the diffusion coefficient is determined using Green's function (Eq. (2)). In this approach is considered that diffusion coefficient is independent of ion concentration and time used at process. Plotting a graph of ln(c) versus x2, a line is obtained and the slope corresponds to (−4Dt)−1[20,21]
In which [c=concentration (%), A=arbitrary constant, t=time (s), x=depth (cm) and D=diffusion coefficient (cm2/s)].
The profile composition can also be described by Fick's second law (Eq. (3)), which allows calculating the atom concentration that is diffusing close to material’ surface, considering that the diffusion coefficient remains constant over time and distance [14]
In which [cs=constant concentration of diffusion atoms on the material surface, c0=initial uniform concentration of diffusion atoms in the material and cx=concentration of the diffusion atom at location x below the surface after time t].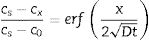
From these theoretical indications, this research work has as general aim to perform ion exchange in sintered glass-ceramics belonging to the systems of Li2O–Zr2O–SiO2 (LZS) and Li2O–Zr2O–SiO2–Al2O3 (LZSA) using salt paste method, glass-ceramic systems studied by this research group over the past few years, develop from the Li2O–SiO2 (LS) and Li2O–SiO2–Al2O3 (LAS) glass-ceramics systems. Efficiency evaluation of different parameters applied on process was made analyzing the obtained layers and mechanical behavior. In addition, the innovative character of this research is regarded to the specific glass-ceramics systems used and the method applied to promote the ion exchange between Li (from glass-ceramics) and Na (from salt), resulting in elevate diffusion coefficient.
Materials and methodsCommercially available quartz (SiO2, Colorminas, Brazil), zirconium silicate (ZrSiO4, Colorminas, Brazil), lithium carbonate (Li2CO3, Sigma-Aldrich, Brazil) and alumina (Al2O3, Colorminas, Brazil) raw materials were dosed to obtain the compositions 9.56Li2O.22.36ZrO2.68.08SiO2, in mass (LZS) and 11.00Li2O·12.60ZrO2·7.10Al2O3·68.60SiO2, in mass (LZSA). The raw materials of each glass composition were dry homogenized for 30min in a laboratory mill (Servitech, CT-248, Brazil) and later melted at a platinum crucible (100mL) in a bottom loading furnace (JUNG LF0917, Brazil) at 1550°C for 120min. The molten glasses were poured out into water to obtain LZS and LZSA glass frits (parent glasses), with subsequent drying in laboratory dryer (SP labor, SP-100/A, Brazil). The frits were successive dry milled (Servitech, CT-242, Brazil) and wet milled (Retsch, PM100, Germany) to obtain particles with d50 smaller than 5μm, as verified in a laser scattering particle size analyzer (Mastersizer, model 3000, United Kingdom).
Thermal behavior of the parent glasses were studied by differential scanning calorimetry, DSC (TA Instruments, SDTQ-600, USA), using 10mg of powder samples, synthetic air (80% of N2 and 20% of O2) and platinum crucibles. Dilatometric behavior of parent glasses was determined with optical dilatometer (TA Instruments, Misura ODHT, USA) in cylindrical samples with 2mm diameter and 3mm height. In both analyses, the heating rate used was 5°C/min.
The shaping process was performed by uniaxial pressing (30MPa) using a steel die matrix and a hydraulic press (Bovenau, P10 ST, Brazil). After drying carried out at 110±10°C in a laboratory dryer (SP labor, SP-100/A, Brazil), the sintering and crystallization (firing) steps (JUNG, model 0213, Brazil) of the parent glass powder compacts occurred at 900°C for the LZS glass-ceramic composition and at 850°C for the LZSA glass-ceramic composition, as verified and defined from the thermal analyzes previously described. In these thermal cycles, holding times of 30min and heating rate of 5°C/min were used to minimize possible geometric variations caused at thermal treatment. After the thermal cycles, the samples were sanded (sandpaper 80) and presented 34mm length, 10mm width and 5mm thickness.
Ion exchanges were carried out by salt paste method, using a sodium nitrate salt (NaNO3, Sigma–Aldrich, purity greater than 99.9%). Two proportions of sodium (from salt) and lithium (from glass-ceramic) oxide were used, which were 1:1 and 2:1, in mass. To facilitated the salt disposal on the sample surface, a salt paste with 80wt.% NaNO3 salt and 20wt.% water was utilized. The pastes were deposited only in one sample side (previously sanded) and to prevent contamination, the oven chamber was coated with silico-aluminous refractory bricks Thermal cycles for ion exchange were performed in a muffle furnace (JUNG, model 0213, Brazil). Samples submitted to ion exchange were put inside alumina crucibles to facilitate transportation and cleaning. Used temperatures were 100°C below Tg value, that is 450°C for LZSA glass and 530°C for LZS glass, with holding times between 60 and 600min. After ion exchange process, the glass-ceramic samples were washed with hot water (T∼90°C) to remove any salt residues.
The three point bending strength of the chemically treated glass-ceramics was made in a mechanical testing machine (MTS Criterion, Model 45, USA) based on the standard ASTM C158-02 [22], method B. A loading rate of 1mm/min and 30 specimens were used for each glass-ceramic composition for each ion exchange studied condition. To calculate the bending strength of tested samples, Eq. (4) was used:
In which [σf=bending (flexural) strength (MPa), F=load (force) at the fracture point (N), L=length of the support span (mm), b=sample width (mm) and h=sample thickness (mm)].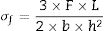
For mechanical measured, the side summited to ion exchange received the load, meaning this side is subjected to a state of compression while the other side of the sample is placed under a tension state, according to [13].
Mechanical behavior was analyzed by two-parameters Weibull model, according to Eq. (5), and the β parameter is also known as m and called as Weibull modulus (dimensionless) [23]
In which [θ=series {α,β,τ}, α=scale parameter (α>0) and β=shape parameter (β>0)].
Graphs were obtained by results linearization and the adjustment quality was verified by R2 obtained value. In these graphs, Y-axis correspond to the fracture probability (Pf) of analyzed materials, determined from Eq. (6)[24]
In which [i=mechanical strength value, N=number of samples and Pf=fracture probability].
In intermediate steps, qualitative chemical analysis to obtain the depth profiles was done via dispersive energy spectroscopy in a scanning electron microscope SEM (JEOL, JSM-6390LV, Japan), using carbon tape, copper stub and gold coating. Sodium content measures were taken in a straight line from the surface, avoiding areas close to border grains and containing porous. The microstructure analyzes were performed perpendicular on the surface of the samples using a stereomicroscope (Opton, TIM-2T, Brazil) and 30x magnification. These analyses were performed in a fracture surface, after cutting and sanding (P80, P220, P320 and P600) the samples.
Chemical composition of glass-ceramics before and after ion exchange treatments was obtained by X-ray fluorescence (PANalytical Spectrometer, model Axios Max, Rhodium tube 4kV, Netherlands). Loss of fire was performed at 1000°C, similar temperature those used thermal cycles, resulting in values less than 0.4% (in mass), which were normalized. The lithium fraction was determined by atomic absorption (ThermoCientific, model ICE 3000, USA).
Crystallographic analyzes were determined using X-ray diffractometer (Rigaku, MiniFlex600 DRX, USA), with CuKα radiation, 40kV, 15mA, 0.05° and 2s. The theoretical diffractograms were found in the ICSD database.
True density (ρt) of powdered samples was determined by using a helium pycnometer (AccuPyc 1340, Micromeritics, USA). This result is automatically calculated by the equipment, based on parameters such as sample mass, volume of the reference chamber used, room temperature and gas volume used The apparent density (ρa) of sintered samples was determined by using Archimedes’ method in water (at 25°C), and using an analytic balance (Shimadzu AX200, accuracy±0.001g, Japan), according to Eq. (7)
In which [ρa=apparent density (g/cm3), dw=dry sample weight (g), iw=sample weight immersed in water (g), ρliq=water density at specific room temperature (g/cm3)]
Subsequently, porosity (E) of glass ceramics (before and after ion exchange) were calculated according to Eq. (8)
In which [ɛ=porosity (%), ρt=true density (g/cm3) and ρa=apparent density (g/cm3)].Results and discussion
Fig. 1 show the particle size distribution of LZS (solid line) and LZSA (dashed line) parent glass powders, respectively, after successive milling process. In both cases, a narrow single-mode distribution was obtained with values of D(10)=0.95μm, D(50)=4.38μm and D(90)=12.4μm for LZS glass samples and D(10)=1.02μm, D(50)=4.65μm and D(90)=12.0μm for LZSA glass samples. This result indicates that the milling process was efficient to obtain adequate powders to compaction molding of sintered glass-ceramics according to [4].
 and LZSA parent glass powders (dashed line).")
Fig. 2a shows differential scanning calorimetry (DSC) regarding to LZS (solid line) and LZSA (dased line) parent glasses powders. In the LZS glass composition an exothermic event could be verified, with maximum at Tc LZS=867°C, which is related to crystallization process, started at approximately 800°C and ended at approximately 920°C; an endothermic event at Tm LZS=967°C corresponds to the melting temperature. For LZSA glass composition two exothermic events at Tc LZSA=660°C and Tc LZSA=890°C could be observed, corresponding to crystallization temperatures and an endothermic event at Tm LZSA=960°C, which corresponds to the melting temperature. In a study with the same glass-ceramics compositions [25], similar temperatures/thermal behaviors for crystallization and melting events were obtained despite using a higher heating rate (10°C/min) than the one used in this research.
 differential scanning calorimetry (DSC) of LZS parent glass powders (solid line) and LZSA parent glass powders (dashed line); (b) dimensional changes (linear shrinkage) LZS parent glass powders (solid line) and LZSA parent glass powders (dashed line).")
Fig. 2b shows the dimensional changes (linear shrinkage) for LZS (solid line) and LZSA (dashed line) parent glass compacts. From these figures, the intense densification event between 610 and 855°C for the LZS glass composition and between 540 and 770°C for the LZSA glass composition could be verified. This gap corresponds to the change between glass and crystalline state (sintering process with high densification) and, subsequently a volume increase indicated the crystallization event, in similar temperatures verified in Fig. 2a. From Fig. 2b it was also possible to obtain the glass transition temperatures (Tg) for the studied glasses, that is Tg LZS=630°C (for the LZS glass) and Tg LZSA=550°C (for the LZSA glass). Similar Tg values were obtained by Teixeira et al. [25] with the same glass-ceramic systems. The knowledge of the glass transitions temperatures enables the selection of the appropriate temperatures for the ion exchange heat treatments.
The literature [26] indicates that the best temperature interval to obtain sintered glass-ceramics is between Tg and the crystallization interval, which corresponds to adequate viscosity for sintering and crystallization process. Based on the obtained results presented in Fig. 2, the selected temperatures for heat treatment were 900°C for LZS glass-ceramic system and 850°C for LZSA glass-ceramic system.
Fig. 3a–d shows sodium content profiles in LZS and LZSA sintered glass-ceramics after ion exchange at 530 and 450°C, for different holding times (60–600min), respectively, using different Na2O:Li2O proportions. For LZS sintered glass-ceramics treated with 1:1 Na2O:Li2O proportion (Fig. 3a) it was possible to see that, for all studied holding times, layer depth values up to 600–700μm were obtained, with the highest value obtained with 600min holding time. Using 2:1 Na2O:Li2O proportion (Fig. 3b) maximum values, between 600 and 900μm were achieved, and the highest value verified on surface was obtained with samples treated during 60min (similar to those treated for 600min with 1:1 Na2O:Li2O proportion). This indicates that using a higher sodium-lithium proportion it is possibly to obtain layer depth values similar to those obtained with 1:1 Na2O:Li2O proportion but in shorter time.
 1:1 Na2O:Li2O proportion and (b) 2:1 Na2O:Li2O proportion; and in LZSA glass-ceramics after ion exchange carried out at 450°C for different holding times with: (c) 1:1 Na2O:Li2O proportion and (d) 2:1 Na2O:Li2O proportion.")
Sodium content profile in LZS glass-ceramics after ion exchange carried out at 530°C for different holding times with: (a) 1:1 Na2O:Li2O proportion and (b) 2:1 Na2O:Li2O proportion; and in LZSA glass-ceramics after ion exchange carried out at 450°C for different holding times with: (c) 1:1 Na2O:Li2O proportion and (d) 2:1 Na2O:Li2O proportion.
In LZSA sintered glass-ceramics case, exchange layers varying between 1500 and 2000μm in deep were obtained for both used Na2O:Li2O proportions. The maximum values achieved on the samples surfaces were obtained after 600min holding time with1:1 Na2O:Li2O proportion (Fig. 3c) and 300min with 2:1 Na2O:Li2O proportion (Fig. 3d). As verified for LZS sintered glass-ceramic, the highest sodium-lithium proportion resulted in the possibility to obtain same sodium content on surface at shorter holding time.
For all ion exchanges cycles, layer depth values higher than those indicated by literature (for other glass-ceramics systems) were obtained as the minimum necessary to promote an increase in mechanical strength, which is 50μm deep according to [9].
According to the literature [21] in studied silica-soda-lime glasses obtained by float method chemically treated (ion exchange) with K salt pastes (with 2:1 and 1:2 KNO3 and KCl proportions), after ion exchange between 460 and 520°C and 10h holding time, an average exchange layer depth of 30μm was obtained.
In similar study, Karlsson et al. [27] also using silica-soda-lime glasses obtained by float method with chloride salt pastes based on Ag, Cu, Rb and Cs, as well some mixture among them, at temperatures (ion exchange) between 460 and 540°C and 10h of holding time, the verified exchange layer depth achieved between 90 and 150μm for exchanges with Ag, 35μm for exchanges with Cu, 10μm for exchanges with Rb and 7μm for exchanges with Cs.
Table 1 shows sodium content for LZS and LZSA sintered glass-ceramics after ion exchange at 530 and 450°C, respectively, with different holding times and Na2O:Li2O proportions. These values were obtained after EDS analyses and represent the average sodium content values for each sample. For LZS sintered glass-ceramics, sodium contents varied between 0.3 and 0.8wt.% with 1:1 Na2O:Li2O proportion and between 0.4 and 0.7wt.% with 2:1 Na2O:Li2O proportion. The most significant layer depth values were obtained after 600min holding time with 1:1 Na2O:Li2O proportion and after 60min holding time with 2:1 Na2O:Li2O proportion, as already verified in Fig. 3a and b.
Sodium content and diffusion coefficient values obtained with Green's Equation and Fick’ second law for LZS and LZSA glass-ceramics after ion exchange.
| Condition | Sodium content(wt%) | Green's Equation(×10−8cm2/s) | Fick’ Second Law(×10−8cm2/s) |
|---|---|---|---|
| LZS 1:1 Na2O:Li2O proportion,530°C 60min | 0.5±0.1 | 11.0 | 13.9 |
| LZS 1:1 Na2O:Li2O proportion,530°C 300min | 0.3±0.1 | 1.6 | 1.6 |
| LZS 1:1 Na2O:Li2O proportion,530°C 600min | 0.8±0.2 | 0.5 | 0.7 |
| LZS 2:1 Na2O:Li2O proportion,530°C 60min | 0.7±0.1 | 14.1 | 17.6 |
| LZS 2:1 Na2O:Li2O proportion,530°C 300min | 0.4±0.1 | 3.3 | 5.5 |
| LZS 2:1 Na2O:Li2O proportion,530°C 600min | 0.7±0.1 | 1.1 | 1.2 |
| LZSA 1:1 Na2O:Li2O proportion,450°C 60min | 0.4±0.1 | 44.0 | 75.6 |
| LZSA 1:1 Na2O:Li2O proportion,450°C 300min | 0.4±0.1 | 5.5 | 7.7 |
| LZSA 1:1 Na2O:Li2O proportion,450°C 600min | 0.6±0.1 | 0.4 | 0.5 |
| LZSA 2:1 Na2O:Li2O proportion,450°C 60min | 0.4±0.1 | 4.3 | 5.4 |
| LZSA 2:1 Na2O:Li2O proportion,450°C 300min | 0.7±0.1 | 3.6 | 5.1 |
| LZSA 2:1 proportion,450°C 600min | 0.4±0.1 | 1.4 | 2.4 |
For the LZSA sintered glass-ceramics, with 1:1 Na2O:Li2O proportion, the verified sodium contents were between 0.4 and 0.5wt.% and the highest value was obtained at 600min holding time. With 2:1 Na2O:Li2O proportion, the sodium contents were between 0.4 and 0.7wt.%, in which the values obtained with 60 and 600min holding time are similar, as already verified in Fig. 3a and b.
From the last presented results (Fig. 3 and Table 1) and using Eqs. (2) and (3), the coefficients of diffusion were determined (also presented in Table 1).
After ion exchanges in LZS sintered glass-ceramics, the obtained diffusion coefficient values were between 0.5×10⁻⁸ and 13.9×10⁻⁸cm2/s with 1:1 Na2O:Li2O proportion and from 1.1×10⁻⁸ to 17.6×10⁻⁸cm2/s with 2:1 Na2O:Li2O proportion. For LZSA sintered glass-ceramics, the achieved values were between 0.4×10⁻⁸ and 75.6×10⁻⁸cm2/s with 1:1 Na2O:Li2O proportion and from 1.4×10⁻⁸ to 5.4×10⁻⁸cm2/s with 2:1 Na2O:Li2O proportion. For both glass-ceramic systems and proportions, the coefficient values were inversely proportional to the holding times. Besides, the obtained values from Fick's second law (Eq. (3)) were slightly higher than those obtained by Green's Equation (Eq. (2)) for both glass-ceramics systems and Na2O:Li2O proportions.
According to [21] using silica-soda-lime glass and a mixture of KNO3:KCl salts, in 2:1 and 1:2 salt proportion (chemical treatments at temperatures between 460 and 520°C, with 10h holding time), the diffusion coefficients values calculated according to Green's Equation, described in Eq. (2) were from 4.0×10⁻¹¹ to 6.8×10⁻¹¹cm2/s. The maximum values were obtained at 520°C for both used salt proportions, with a maximum exchange depth of 80μm.
Studying the influence of ion exchange parameters by salt paste method on silica-soda-lime glass properties with salts based on copper, gold, rubidium and cesium, Karlsson et al. [27] verified that, for all cases, ion concentration decreases with increasing depth. Ion exchange temperatures varied from 460 to 540°C, with 10h holding times for all cycles. Diffusion coefficients were obtained using Green's Equation (Eq. (2)) and the results were from 1.3×10⁻¹¹ to 8.9×10⁻¹¹cm2/s with depth up to 35μm for copper; between 2.8×10⁻¹⁰ and 1.1×10⁻⁹cm2/s with depths of approximately 90μm for gold; diffusion coefficients between 1.1×10⁻¹² and 1.7×10⁻¹²cm2/s with maximum depth of 10μm for rubidium; from 5.4×10⁻¹³ to 6.2×10⁻¹³cm2/s with depth up to 7μm for cesium.
For comparison, in a study with Li2O–Al2O3–SiO2 glass summited to ion exchange with NaNO3 salt bath at 520°C and immersion times between 5 and 60min, Aaldenberg et al. [28] verified diffusion coefficients (calculated from mass sample variation) was about 1.8±0.2×10⁻⁸cm2/s, value at the same magnitude verified on this research.
Comparing the obtained values in this research with the literature of [21,27], diffusion coefficients presented by LZS and LZSA glass-ceramics after ion exchange by salt past method with NaNO3 are higher, probably due to the higher diffusion presented by lithium compared with others ions, as also verified in [28].
Processing conditions that resulted in the highest sodium contents after ion exchange were characterized in terms of mechanical behavior, and results are presented in Fig. 5.
For LZS glass-ceramics (Fig. 4a), mechanical strength values increased from approximately 110 to 125MPa (14% increase) after ion exchange, and it is more significant for 2:1 Na2O:Li2O proportion, 450°C and 300min. Weibull modulus values (m) were: 10.3 before ion exchange changing to 10.7 after ion exchange at 530°C and 600min holding time with 1:1 Na2O:Li2O proportion and 16.2 after ion exchange at 530°C and 60min holding time with 2:1 Na2O:Li2O proportion. Low m values indicate a fault distribution with non-uniform behavior, whereas a high m value indicates that the presented behavior is quite homogeneous. Typical m values for ceramic materials vary from 3 to 15 according to [29].
, Weibull modulus (blue label) and porosity (red label) for: (a) LZS sintered glass-ceramics before and after ion exchange; and (b) LZSA sintered glass-ceramics before and after ion exchange.")
In LZSA glass-ceramics (Fig. 4b), a decrease in mechanical strength values from 130MPa to approximately 75MPa (reduction of 42%) was verified after ion exchange. This result could be a consequence of the excessive exchange layer formed (>2000μm as verified in Fig. 3c and d), which probably ends up changing the layer/substrate configuration, that is, the absence of superficial compressive stresses. The body is comprised as a single material (that of the formed layer).
Corresponding values to Weibull modulus were 6.5 before ion exchange to 15.4 after ion exchange at 450°C and 600min holding time with 1:1 Na2O:Li2O proportion and 6.7 after ion exchange at 450°C and 300min holding time with 2:1 Na2O:Li2O proportion. This indicates that, despite decrease in mechanical strength after ion exchange, there was a slightly decrease in obtained values dispersion for condition with 2:1 proportion and a significant one for condition with 1:1 proportion.
Related to porosity after ion exchange for both glass-ceramics systems, an increase is verified, which is probably due to an increase in porous radius, and once no true density variation was observed, this meaning that there is not an ion implantation, but there is an ion insertion at structure, according to literature [9,30]. The porosity obtained with two ion exchange conditions were not significantly different from each other, considering the associated error.
Statistical analysis quality is presented in Fig. 5, which corresponds to Weibull plots for discussed conditions in previous paragraphs. Regardless ion exchange condition used, R2 values presented were greater than 0.90, indicating high quality of results linearization.

Fig. 6 illustrates the ion stuffing tension, after ion exchange for LZS and LZSA sintered glass-ceramic, calculated according to Eq. (1). Young's modulus values were calculated from the “Stress×Deformation” graphs obtained with the mechanical strength test, analyzing the angular coefficient on the linear part in the obtained graphs. Sample volume variation was geometrically measure and theoretical values were obtained from theoretical volume difference between lithium and sodium, which corresponds to an increase of 58% according to [13]. The Poisson's coefficient applied was 0.22, a typical value for glass-ceramics, according to [13]. It was verified that the experimental values were smaller than the theoretical for LZS glass-ceramics (Fig. 6a) and greater for LZSA glass-ceramics (Fig. 6b). This result also explains why the mechanical strength decrease after ion exchange for LZSA glass-ceramics.
 of LZS and LZSA sintered glass-ceramics before and after ion exchange, at 530 and 450°C, respectively, for 60 and 600min holding time, using 1:1 and 2:1 Na2O:Li2O proportions.")
In a study by Yunqiu et al. [31], mixtures of KCl+KNO3 and KCl+ZnCl2 salts were used in different proportions, at 500°C and holding times between 1 and 24h. Mechanical strength, verified by Ring-on-Ring method varied from 14MPa (before exchange) to 40MPa (after exchange) when a KCl+KNO3 salt mixture was used; with 70μm exchange layer and diffusion rates between 8 and 20×10−11cm2/s (calculated by Fick's second law). For KCl+ZnCl2 mixtures, mechanical strength after ion exchanges achieved values between 17 and 60MPa, with exchange layers up to 50μm.
To evaluate mechanical behavior of silica-soda-lime glasses after ion exchange on a single side, using the salt paste method, Hild [29] used temperatures of 450 and 515°C, with 10h of holding time and a mixture of KCl:KNO3 in 1:2 proportion. In order to verify the variation of the mechanical characterization after ion exchange on a single side of silica-soda-lime glasses, Karlsson et al. [32] used a mixture of potassium salts (chloride and nitrate), with 1:2 proportion, at 450 and 515°C for 10h holding time. Mechanical test performed by Ring-on-Ring test, varied from 120MPa before ion exchange to 290MPa (lower temperature) and 235MPa (higher temperature). An increase in Weibull's modulus was observed even with a decrease in mechanical strength, presenting greater magnitude for 450°C, i.e., it varied from 4.6 to 12.1, compared to a slight increase to 4.8at 515°C.
In a research study with Li2O–Al2O3–SiO2 glass, Aaldenberg et al. [28] performed ion exchange using the salt bath method with NaNO3 at 520°C for 5–60min immersion times. The mechanical strength and Weibull modulus varied from 100MPa and 4.7 (before ion exchange) to 340–400MPa and 10.5 (after ion exchange), respectively. The increase in mechanical strength verified by the authors is bigger than those verified in this research, but the Weibull modulus is smaller.
Micrographs of the studied LZS and LZSA sintered glass-ceramic samples, before and after ion exchange in different conditions are presented in Fig. 7 and photographs of samples are shown in Fig. 8. The porosity increase, verified in both glass-ceramics systems after ion exchange in Fig. 7, may be associated with the increase in the pore diameter as consequence of the ion stuffing presented by samples. In Fig. 8 is possible to verify that no significant variation on LZS glass-ceramics is verified after ion exchange, but on LZSA glass-ceramics many physical compromises, such as breaking on sample edge and pores stretching were observed, which helps to explain the decrease in mechanical strength verified.
 of LZS and LZSA sintered glass-ceramics before and after ion exchange, at 530 and 450°C, respectively, for 60 and 600min holding time, using 1:1 and 2:1 Na2O:Li2O proportions.")

X-ray diffraction (XRD) patterns of LZS and LZSA sintered glass-ceramics before and after ion exchange cycles for samples in which the highest exchange layers were formed and the pattern from literature [33] for theses crystalline phases, are shown in Fig. 9b show XRD of LZS and LZSA sintered glass-ceramics before ion exchange that is, without chemical tempering. From the XRD it can be seen a high crystallinity degree of the analyzed materials since the amorphous profile in both glass-ceramics are very low.
 LZS glass-ceramic before ion exchange, (b) LZSA glass-ceramic before ion exchange, (c) LZS glass-ceramic after exchange using different cycles and Na2O:Li2O proportions and (d) LZSA glass-ceramic after exchange using different cycles and Na2O:Li2O proportions.")
X-ray diffraction patterns: (a) LZS glass-ceramic before ion exchange, (b) LZSA glass-ceramic before ion exchange, (c) LZS glass-ceramic after exchange using different cycles and Na2O:Li2O proportions and (d) LZSA glass-ceramic after exchange using different cycles and Na2O:Li2O proportions.
For LZS sintered glass-ceramic, zirconium and lithium silicates (Li2ZrSiO6), lithium metasilicate (Li2SiO3) and zirconium silicate (ZrSiO4) were identified as the main crystalline formed phases, as shown in Fig. 9a. These same crystalline phases were also verified by Teixeira et al. [34,25] for LZS glass-ceramics.
For LZSA sintered glass-ceramics (Fig. 9b), it was verified that lithium metasilicate turns into lithium disilicate (Li2Si2O5), and there is also the presence of ß-spodumene (LiAlSi2O6), zirconium and lithium silicate (Li2ZrSiO6) and zirconium silicate (ZrSiO4). These crystalline phases were also identified by Mondeto et al. [26] and by Teixeira et al. [25]
From Fig. 9 it was also possible to verify that in both glass-ceramic compositions, the crystalline phases identified before ion exchange remains after chemical treatment, with a slight decrease in its intensities. Besides, a decrease in background indicated a decrease in the amorphous fraction. The same crystalline phases were observed in different ion exchange conditions for two glass-ceramics systems analyzed.
For LZS sintered glass-ceramics, partial replacement of lithium by sodium occurred in same crystalline phases, resulting in sodium disilicate (Na2Si2O5) and sodium, lithium and zirconium silicate (NaLiZrSi6O15), as seen in Fig. 9c. For LZSA sintered glass-ceramics, after ion exchange, sodium metasilicate (Na2SiO3, PDF #01-072-0079), sodium, lithium and zirconium silicate (NaLiZrSi6O15) and aluminum-sodium silicate (NaAlSi2O6) were also detected, as shown in Fig. 9d.
The characteristics of crystalline phases are presented in Table 2, in which it is possible to verify that the crystalline phases containing sodium have bigger volume and density than their equivalent with lithium, as example, Li2SiO3 (cell volume=236.32Å and density=2.53g/cm3) and Na2SiO3 (cell volume=306.62Å and density=2.64g/cm3). Those crystalline phases that contain zirconium are the densest ones, once this element is heavier and has greater volume than the others [13,34].
Characteristic of the crystalline phases before and after ion exchange.
| LZS sintered glass-ceramic | ||||
|---|---|---|---|---|
| Crystalline phase | ICSD | Cell volume (Å3) | Density (g/cm3) | Thermal expansion coefficient (×10−6°C−1) |
| Li2SiO3 | 01-083-1517 | 236.32 | 2.53 | 10.7 |
| Li2ZrSiO5 | 01-036-0049 | 1247.42 | 3.97 | 14.0 |
| ZrSiO4 | 01-070-9052 | 260.46 | 4.67 | 3.4 |
| Na2Si2O5 | 01-074-3429 | 470.41 | 2.57 | 15.9 |
| NaLiZrSi6O15 | 01-083-1726 | 2527.61 | 2.78 | 12.2 |
| LZSA sintered glass-ceramic | ||||
|---|---|---|---|---|
| Crystalline phase | ICSD | Cell volume (Å3) | Density (g/cm3) | Thermal expansion coefficient (×10−6°C−1) |
| Li2Si2O5 | 01-070-4856 | 404.17 | 2.47 | 9.0 |
| Li2ZrSiO5 | 01-036-0049 | 1247.42 | 3.97 | 14.0 |
| LiAlSi2O6 | 01-073-7630 | 389.65 | 3.17 | 3.8 |
| ZrSiO4 | 01-070-9052 | 260.46 | 4.67 | 3.4 |
| Na2SiO3 | 01-072-0079 | 306.62 | 2.64 | 21.3 |
| NaLiZrSi6O15 | 01-083-1726 | 2527.61 | 2.78 | 12.2 |
| NaAlSi2O6 | 01-080-1561 | 539.18 | 2.49 | 8.5 |
Refs.: [33,35–40].
It is also possible to verify from Table 2 that the crystalline phases that contains sodium have bigger thermal expansion coefficients that the lithium equivalent and those containing zirconium or aluminum have the smallest ones. The presence of crystalline phases with thermal expansion coefficients so different creates a compressive tension state during cooling, which can increase the mechanical strength.[36] For comparison, the LZS parent glass have thermal coefficient value of 14.6×10⁻⁶°C−1 and the LZSA parent glass have 12.1×10⁻⁶°C−1[25].
LZSA sintered-glass ceramics present crystalline phases after ion exchange with bigger thermal expansion coefficient than LZS sintered-glass ceramics, as verified in Table 2. Also, ion stuffing stresses are bigger in LZSA system than in LZS system, as verified from Fig 6. The sum of these superficial tension probably resulted in some large value that, combined with the elevate porosity of the LZSA system (as verified in Fig. 4b), compromise mechanical strength.
From the results presented in Fig. 9 it was possible to verify the efficiency in ion exchange with the salt paste method in which the mechanism acting during chemical treatments in LZS and LZSA sintered glass-ceramics is the ion exchange in crystalline phase, characterized by slight displacement on corresponding peaks, according to definition by Beall et al. [15].
Table 3 presents the results of the chemical analyzes carried out on LZS and LZSA sintered glass-ceramics, before and after ion exchange. The ion exchange cycle characterized for LZS was 2:1 Na2O:Li2O proportion at 530°C and 60min holding time and for LZSA, the cycle was 1:1 Na2O:Li2O proportion at 450°C and 300min holding time. Only one of the two conditions studied was chemical characterized due to the small difference between mechanical and mineralogical characterization.
Chemical analysis of LZS e LZSA sintered glass-ceramics before and after ion exchange.
| Oxides constituents | LZS sintered glass-ceramic(wt%) | LZSA sintered glass-ceramic (wt%) | ||
|---|---|---|---|---|
| Before ion exchange | After ion exchange | Before ion exchange | After ion exchange | |
| Al2O3 | 0.9 | 1.1 | 7.4 | 8.6 |
| Li2O | 7.9 | 6.3 | 9.9 | 7.6 |
| Na2O | <0.1 | 0.3 | <0.1 | 0.4 |
| SiO2 | 67.8 | 65.2 | 68.6 | 65.3 |
| ZrO2 | 22.4 | 26.8 | 13.6 | 17.6 |
| Others | 0.9 | 0.3 | 0.4 | 0.5 |
For compositions before ion exchange process, there was a small difference between the desired values by the theoretical composition and those obtained experimentally due to the presence of some impurities. Also, it was verified a decrease in lithium oxide content, probably due to its evaporation in melting process. The aluminum oxide content was above the theoretical value, for both systems, due to probable contamination during the milling process.
After ion exchange process, for both compositions, the zirconium content increase in the same proportion which lithium and silica content decrease. A sodium content increase, in amount of 0.2–0.3wt.%, was verified, indicating the efficiency of ion exchange process. These results were in accordance with EDS characterization, presented in Fig. 3 and Table 1, corroborating the good results obtained for diffusion coefficients.
ConclusionAfter ion exchange of LZS sintered glass-ceramics at 530°C for different holding times (60–600min) it was possible to obtain layer depth values up to 600–700μm with 1:1 Na2O:Li2O proportion and between 600 and 900μm with 2:1 Na2O:Li2O proportion. This resulted in sodium contents between 0.3 and 0.8wt.% (measured by EDS and confirmed by FRX) and a 14% increase in mechanical strength.
For LZSA glass-ceramics, after ion exchanges at 450°C and 60–600min of holding times, it was possible to obtain exchange layers varying between 1500 and 2000°μm in depth for both Na2O:Li2O proportions. The sodium content varied from 0.4 to 0.7wt.% and a 42% reduction in mechanical strength, as a result of excessive exchange layer, ion stuffing stress greater than the theoretical ones, porosity and elevate superficial stress as a consequence of thermal expansion coefficient of the crystalline phases, was observed.
For both glass-ceramics systems, using a higher sodium-lithium proportion it was possibly to obtain layer depth values similar to those obtained with the lower proportion, but in a shorter time. Besides, the diffusion coefficient values (obtained by Fick's second law or Green's Equation) decreased when the holding times increased. Related to Weibull modulus, it was observed an increase in the obtained values for all studied conditions. Mineralogical characterization indicated a partial lithium substitution for sodium in the obtained crystalline phases, and the ion exchange mechanism acts in these glass-ceramics at the crystalline phases.
Conflict of interestThe authors declare that they have no known competing financial interests or personal relationships that could have appeared to influence the work reported in this paper.
This study was financed in part by the Coordenação de Aperfeiçoamento de Pessoal de Nível Superior – Brasil (CAPES), Grant No. 88881.310728/2018-01. The authors are grateful for the support also provided by Conselho Nacional de Desenvolvimento Científico e Tecnológio – Brasil (CNPq), Grant numbers: 444249/2014-1 and 407032/2013-4, and also to the technical staff from Central Laboratory of Electronic Microscopy (LCME) at the Federal University of Santa Catarina (UFSC).

