


The hydrolysis and self-condensation reactions of 3-(2-amino-ethylamino)propyl-trimethoxy silane have been studied by means FT-IR spectroscopy for different water and ethanol concentrations. The hydrolysis of 3-(2-amino-ethylamino)propyl-trimethoxy silane occurs at a high rate and depends if the water concentration is lower or higher than the stoichiometric one for hydrolysing all the hydrolysable groups. The presence of ethanol delays the hydrolysis reaction. The hydrolysis of 3-(2-amino-ethylamino)propyl-trimethoxy silane gives hydroxyl groups (Si–OH) that self-condense to form Si–O–Si bonds in linear and cyclic structures. For high water and low ethanol concentrations not all Si–OH groups self-condense, whereas for low water or high ethanol concentrations the major part of the Si–OH groups self-condense and tends to disappear in the gel state.
Las reacciones de hidrólisis y autocondensación del 3-(2-amino-etilamino)propil-trimetoxi silano han sido estudiadas mediante espectroscopía FT-IR para concentraciones diferentes de agua y etanol. La hidrólisis del 3-(2-amino-etilamino)propil-trimetoxi silano tiene lugar a alta velocidad y depende de si la concentración de agua es menor o mayor que la requerida estequiométricamente para hidrolizar todos los grupos hidrolizables. La presencia de etanol retrasa la reacción de hidrólisis. La hidrólisis del 3-(2-amino-etilamino)propil-trimetoxi silano proporciona grupos hidroxilo (Si-OH) que auto-condensan para formar enlaces Si-O-Si en estructuras lineales y cíclicas. Para concentraciones de agua elevadas y bajas de etanol, no todos los grupos Si-OH auto-condensan, mientras que para concentraciones bajas de agua y altas de etanol, parte de estos grupos Si-OH auto-condensan y tienden a desaparecer en el estado de gel.
Functional organosilanes, commonly known as silane coupling agents, have been studied and used in many different applications for decades [1–3]. In the last century, functional organosilanes were extensively used in the fabrication of lightweight composite in transportation, principally. The most common materials of this kind are fibre reinforced plastic composites (FRPC) where high resistance inorganic fibres are mixed with organic matrices. The improvement of the mechanical properties in FRPC is only reached when it exist a chemical compatibility between the matrix and the reinforcements. The use of silane coupling agents promotes interfacial adhesion and thus, the mechanical properties of the composite materials are strengthened. Since then, multiple and important applications for silanes have been reported in the literature, being most of them related to surface modification of support materials for biomolecule transport [4,5], enzyme [6] and bioactive substances immobilization [7] or smart drug delivery systems [8]. In the field of composite materials, we also find a wide variability of applications such as the surface modification of natural organic or inorganic fibres [9] and particles [10], the modification of synthetic carbon nanofibers [11,12] or as promoters of the adhesion between carbon nanotubes and glass fibres [13,14]. Silanes can be also used in the preparation of proton—conducting membranes obtained by the sol–gel method [15], in the synthesis of organic–inorganic hybrids [16] and in the preparation of temperature-resistant silicon oxycarbonitride ceramics [17].
In a typical silane structure, one silicon atom is bonded to three hydrolysable alkoxy groups and to one non-hydrolysable organic moiety. The hydrolysable groups form Si–OH terminations which are able to interact with active hydroxyl groups existing on the solid surface subjected to condensation reactions [1,18] or some other adjacent molecules. The hydrolysis rate and the formation of these Si–OH termination depend upon the number of carbon atoms of the hydrolysable alkoxy group as well as some other factors such as pH, H2O concentration, nature of the solvent, etc. [19]. Silane condensation reactions, either with Si–OH groups existing on the solid surface, with other hydrolysed silanes (polycondensation reactions) or with other hydrolysed molecules of the same silane (self-condensation), also depend upon the pH of the solution, silane concentration, catalysts, type of solvent, steric and inductive effects, etc. [20]. The chemical nature of the un-hydrolysable organic moiety is selected according to the required functionality. Silanes containing amino groups (–NH2) in the organic chain have been, by far, the most extensively used in many of the above referred applications, and the position of the amino group within the organic chain provides different molecular conformations of the silane when it is attached to the solid surface [11,21–23]. Hydrolysis and condensation reactions of aminosilanes have been reported in the literature [1,24,25], standing out the systematic studies carried out by Belgacem et al. [19,26,27]. In a previous work, we also detailed the different steps involved in the hydrolysis and condensation of 3-aminopropyltriethoxysilane (APS) [25]. For these studies, we selected the FT-IR spectroscopy as the preferred characterization technique since it requires a minimum volume and the results can be obtained in just a few seconds. In a similar way as we did before, we now focus our attention on the hydrolysis and condensation reactions occurring in solutions containing N-(2-aminoethyl)-3-aminopropyltrimethoxysilane (DAMO) since it accomplishes a necessary step in the functionalization process of solid surfaces. In this work, we report on the competitiveness of the H2O and EtOH molecules against the hydrolysis and condensation reaction of DAMO silane. In the presence of large amounts of H2O, hydrolysis occurs fast but self-condensation reactions are delayed and many Si–OH groups remain un-condensed. Increasing EtOH ratios lead to a delay in the hydrolysis rate.
Experimental3-(2-aminoethyl)-3-aminopropyltrimethoxysilane (DAMO, Gelest, 98%), ethanol (EtOH, Merck 99%) and distilled-deionized H2O were the reactants used. DAMO and H2O were thermosthated into two different vessels in a silicone bath at 25°C for 30min. If used, the total amount of EtOH was divided in two and added equally to the two different vessels. After temperature stabilization, both solutions were then mixed and maintained under vigorous stirring for reaction. After the condensation reactions finished and once gelling was achieved, white solid materials were obtained and dried in an oven at 50°C. Two reactions sets were studied: In the first set, no EtOH was used and the amount of H2O was fixed to 1 or 3 moles respect to 1 mole of DAMO (samples named DH1 and DH3, respectively) and, in the second reaction set, the molar ratio DAMO/H2O/EtOH was 1/3/2, 1/3/4, 1/3/8 and 1/3/16. The samples corresponding to this set are labelled as DH3E (number of EtOH molecules).
The FT-IR spectra were collected in the attenuated total reflectance mode (FTIR-ATR) by dropping 1μl solution over the diamond crystal which was rapidly covered with a glass plate to avoid evaporation. It was considered that the extraction of 1μl from a 100ml solution does not affect the reaction kinetics. Solution aliquots were taken at different reaction times starting from 1min intervals to several hours. The spectra were obtained by a Perkin–Elmer FT-IR instrument X-spectrum model in the 4000–600cm−1 spectral range and 2cm−1 resolution. 16 scans were recorded for each spectrum and background was subtracted in all cases. Methanol (MeOH, Merck 99.9%) was used for FT-IR calibration.
The analysis of the FT-IR spectra was carried out by using commercially available software for spectral analysis (Renishaw, U.K.). The obtained spectra were fitted to Gaussian/Lorentzian type bands. Half bandwidth, intensity and position was determined by band deconvolution analysis and assigned according to the existing literature. The criteria for choosing the most adequate fitting was the minimum value for the sum of the error squares between experimental and deconvoluted spectra.
ResultsHydrolysis and condensation of amino-containing silanes finishes with the obtaining of gels and, as occurs in the well-known APS silane [25], the addition of H2O to DAMO produces transparent gels for times that depend upon the H2O and EtOH concentrations. When using the stoichiometric amount of H2O to hydrolyse all the hydrolysable groups (DH3 sample), it was necessary 11 days to obtain a solid gel but, when the amount of H2O is decreased (DH1 sample) even after 70 days the reaction is still on liquid state. The addition of EtOH significantly modifies the hydrolysis and condensation rate and if DH3E1 sample needed 35 days to provide a solid gel, the samples DH3E2, DH3E4 and DH3E8 lasted in liquid state for 42 days.
Fig. 1 shows the FT-IR spectra of DAMO, MeOH and the assignation of the main bands in the 1250–600cm−1 spectral range. Centred at 1189cm−1, it appears the rocking mode of C-H in methoxy groups bonded to the Si atom. The Si–O–C asymmetric stretching is located at 1074cm−1 and, at 807 and 776cm−1 we can find two medium bands and a shoulder (776cm−1) which are probably due to symmetric stretching of the Si-X4 tetrahedral (where X=0 and C) of DAMO [11,28]. In the spectra of EtOH and MeOH, the bands centred at 1113 and 1088cm−1, respectively, correspond to the C–O asymmetric stretching, and at 1023 and 1046cm−1 their corresponding symmetric stretching modes. At 880cm−1 it appears a medium band assigned to the skeletal vibration of EtOH and, two medium and wide bands at 647 and 620cm−1 are assigned to the deformation vibration of OH groups in MeOH and EtOH, respectively. In general the majority of these bands are not overlapped and can be used to follow the hydrolysis and condensation reactions of the alkoxyde DAMO.
Hydrolysis and condensation in pure water
Fig. 2 presents the most representative FTIR-ATR spectra showing the evolution of the DH1 and DH3 samples in the sol state (Fig. 2a and b) and once the solid gel is obtained (Fig. 2c and d). In the sol state, after 1min reaction, it appears a new band unambiguously attributed to MeOH formed in the hydrolysis of DAMO. The spectrum of DH3 at 1min is very similar to that of DH1 at 8min indicating the acceleration of the hydrolysis rate in presence of H2O. The interaction between the freshly produced MeOH and DAMO might be the responsible of the band shift to higher wavenumbers at low reaction time. The band corresponding to MeOH moves to its natural frequency value (around 1023cm−1) at the end of the hydrolysis reaction due to the concentration increase of MeOH in the media. As reaction time increases, it is also appreciated the appearance of two new bands at 690cm−1 and 1100cm−1 occurring together with the broadening of the main band of MeOH, specially for the DH3 reaction. These two new bands are attributed to the formation of Si–O–Si bonds by polycondensation reactions of Si–OH groups in hydrolysed DAMO molecules [25].
 1mol H2O, (b) 3mol H2O per mole of 3-(2-aminoethyl)-3-aminopropyltrimethoxysilane obtained at different reaction times and the spectra of the solid gels containing, (c) 1mol H2O and (d) 3mol H2O per mole of DAMO dried at different periods of time.")
FTIR-ATR spectra of the solutions containing, (a) 1mol H2O, (b) 3mol H2O per mole of 3-(2-aminoethyl)-3-aminopropyltrimethoxysilane obtained at different reaction times and the spectra of the solid gels containing, (c) 1mol H2O and (d) 3mol H2O per mole of DAMO dried at different periods of time.
The wide and medium intensity band close to 925cm−1 has been assigned to the formation of Si–OH and Si–O− groups in the hydrolysis of silicon alkoxydes [29,30]. This band appears in the first moments of hydrolysis and tends to disappear for the DH1 sample while it is still evident after 30 days reaction in DH3. In the spectra of the solid gels (Fig. 2c and d), the referred band appears again after 50 days in the oven at 50°C. Chmel et al. assigned to Si–OH groups the band appearing at 960cm−1 while it is shifted to 920cm−1 in the case of Si–O− broken bonds [29,30]. The band in Fig. 2 is located between 921cm−1 and 927cm−1 and could be tentatively assigned to Si–O− groups rather than Si–OH, however, in the dried gel, it is quite improbable such a large amount of free Si–O− groups. The most plausible explanation for this shift and the presence of the band in the dried gels is the effect of the organic moiety bonded to the Si atom. When the amount of H2O is lower than stoichiometric (DH1), the Si–OH are rapidly formed and condensed, but for stoichiometric H2O concentrations (DH3) the condensation of Si–OH groups is incomplete.
As commented before, the obtaining of a solid gel was achieved in 11 days when using under-stoichiometric amounts of H2O for the hydrolysis whereas if the molar ratio H2O/Si=3 (DH3), the reaction remained in the sol state after 70 days. To accelerate gelling, DH3 was introduced in the oven at 50°C and then dried. In the dried gels (Fig. 2c and d), the band centred around 1100cm−1 broadens and increases in intensity and it is also observed that the band centred at 1023cm−1 and initially attributed to MeOH is also shifted to lower wavenumbers. Since MeOH no longer exists on the dried samples, we must consider the appearance of some other species whose vibration wavelength were located at this position. To conclude the description of the band evolution, we now focus our attention on the bands at 807cm−1 and 1190cm−1 that are assigned to the condensation of DAMO molecules. These two bands decrease in intensity during the drying process suggesting that the hydrolysis reaction continues during drying but, the limited mobility of the atoms in the solid state limits the evolution of the condensation reaction [31].
The position, intensity and width of each band in the spectra have been determined through spectral deconvolution. Since the spectra were recorded in ATR-FTIR mode covered with a glass plate, it is difficult to ensure a homogeneous pressure and contact between the liquid and the diamond crystal (also considering minor EtOH evaporation). Therefore, some sort of spectral normalization which are based on band intensity ratios are required. The most intense band of the spectrum was used for normalization. The relative intensity of the referred bands during the analysis will correspond to the relative intensity area of the band with respect to the integrated spectral area.
The data obtained from the deconvoluted spectra of pure DAMO and MeOH were used as the input parameters for the subsequent fittings. During hydrolysis, the relative intensity of DAMO bands tends to decrease while the intensity of MeOH bands follows an opposite trend. It must be clarified that in some cases we could not get an adequate fitting just by using the DAMO and MEOH bands; in these cases we added additional bands assuming Gaussian shape.
Fig. 3a shows the band area of the DAMO molecules (1074 and 1190cm−1) as a function of the reaction time. It is clearly observed the fast hydrolysis when the stoichiometric H2O is used (DH3 samples, open symbols in Fig. 3). In the case of using 1mol H2O per mol DAMO (DH1), the band intensity is continuously decreasing for 1 hour and afterwards it stabilizes. This effect is especially noticeable in the band corresponding to the asymmetric stretching of the Si–O–C bond and located at 1074cm−1. The bands attributed to the hydrolysable bonds do not completely disappear at high reaction times although the minimum intensities are reached when the stoichiometric amount of water is used. The remainder bands assigned to DAMO (not shown here) show also a gentle decrease in intensity with reaction time. These bands (807, 776cm−1 and the 753cm−1 shoulder) are related to the [SiX4] tetrahedral which is maintained with different substituents after hydrolysis.
 3-(2-aminoethyl)-3-aminopropyltrimethoxysilane and (b) MeOH vs reaction time.")
MeOH appears in the spectra as a sub-product of the hydrolysis reaction. The bands show the opposite behaviour with time than DAMO (Fig. 3b). For DH3, the formation of MeOH occurs within the first minute reaction and the main band reaches the normal position of 1023cm−1. In the case of DH1, the hydrolysis lasts for one hour and the MeOH band shifts progressively from 1040 to 1023cm−1. During the drying process, the amount of MeOH decreases but does not completely disappear, indicating that some MeOH molecules remain strongly adsorbed on the gel surface.
After hydrolysis, freshly formed Si–OH groups start to self-condensate to form Si–O–Si bonds where each Si atom is bonded to three O atoms and one C corresponding to the organic moiety. Saturation is reached when three of the four possible coordination linkages are formed by Si–O–Si bonds. As mentioned before, the deconvolution of the IR spectra required to add new bands to reach the minimum error between the experimental and convoluted spectra. These additional bands were located at 690, 950, 1013, 1053, 1107 and 1153cm−1 and must be due to the formation of new Si–OH groups or Si–O–Si bonds. As described in the hydrolysis and condensation reactions of γ-APS [25] similar bands can be assigned to the symmetric and asymmetric stretching vibrations of 8-membered cyclic siloxane structures (1020 and 1050cm−1, respectively) and to long linear chains in poorly cross-linked structures formed by self-condensation of hydrolysed DAMO molecules (1110 and 1150cm−1, respectively) [24,32,33]. The 950cm−1 band is usually assigned to Si–OH groups in hydroxyl-rich silica materials [30,34,35] whereas the band at 690cm−1 is attributed to Si–O–Si bonds [32,34]. Recently, some authors have assigned the 693, 906, 1011, 1097 and 1162cm−1 bands to Si–O–Si antisymmetric and symmetric stretching in SiO2-based nanotubes where –Si(OSi)3 groups are separated with a –CH2–CH2– organic group [36]. Nevertheless, it is generally recognized that the right assignment of the IR bands observed in silicate spectra to structural groups in silicate structures is a difficult task.
Considering the above mentioned limitations, we have selected the 1013 and 1107cm−1 bands as the most representatives in the study of the self-condensation reactions of Si–OH groups to form 8-membered cyclic siloxane structures and long linear chains in poorly cross-linked structures, respectively. Fig. 4 shows the evolution of these bands with reaction time. Here it is observed that self-condensation starts at the first stages of DAMO hydrolysis. In DH1, these bands experiment a progressive increase up to 10h reaction but afterwards the intensity is constant for the next 1000h (or 31 days). After 6min reaction, the intensity of the bands at 1013 and 1107cm−1 in DH3 material is maintained constant and, in the case of the band assigned to cyclic siloxane structures, it is observed a sudden increase after 100h reaction. Once the material acquired the gel state, similar intensity values of the band centred at 1013cm−1 is found in the DH1 and DH3 materials, i.e. at this point, the number of cyclic siloxane units is independent on the initial amount of H2O used for the hydrolysis. Similar behaviour is found in the remainder bands assigned to Si–O–Si stretching modes centred at 1060cm−1 and 690cm−1 (not shown here).
 and linear chains (1107cm−1) with reaction time.")
The convoluted area of the band attributed to free hydroxyl groups (930cm−1) is shown in Fig. 5. The band appears at the beginning of the hydrolysis reaction with similar intensity values for both samples. In DH1, it is observed a rapid decrease of the band intensity reaching values close to zero. After 40 days reaction, once the sample is gelled, the band increases its intensity due to the elimination of H2O adsorbed on the surface. When the stoichiometric H2O amount is used (DH3), the formation of Si–OH bonds takes place within the first minute reaction and afterwards no more free Si–OH bonds per Si atom is formed, i.e. the hydrolysis occurs simultaneously with condensation. After 24h reaction the number of free hydroxyl groups increases again and occurs simultaneously with the formation of cyclic siloxane structures, as shown in Fig. 4.
Hydrolysis and condensation in ethanol
In a similar way as we proceed in the hydrolysis and condensation of DAMO with H2O, we carried out the study of the band evolution in the presence of different amounts of EtOH. The spectrum of pure EtOH (Fig. 1) presents 4 bands located at 646, 882, 1045 and 1087cm−1 which can be fitted to Gaussian (646cm−1) or Lorentzian curves (882, 1045 and 1087cm−1). The most intense band in the spectra is the one centred at 1045cm−1 and, similarly to the bands centred at 882 and 1045, it is well defined and presents a low band width at medium height. In the present study we have used as a reference band the one centred at 882cm−1 since it is not overlapped with any other band from DAMO or MeOH molecules.
The first band of interest in the DAMO hydrolysis is the one fitted to 1074cm−1 that corresponds to the asymmetric stretching of the hydrolysable Si–O–C bonds (Fig 6a). As observed, the hydrolysis of DAMO is delayed because of the presence of EtOH and occurs in a sustained manner depending on the amount of alcohol. In the absence of EtOH, hydrolysis takes place within the first 8min (Fig. 3) but in this case the band intensity does not stabilize until 1h reaction time passes. For the largest amount of EtOH (DH3E16) it is observed that the solution requires 100h to reach the minimum band intensity value. The fact that in any case the band intensity approaches the zero value (and it is even higher with increasing EtOH amounts) indicates that the hydrolysis does not take place in its full extension and there are still some hydrolysable groups that remain intact. The formation of MeOH is followed through the band centred at 1034cm−1 and presented in Fig. 6b. The decrease of the band intensity after 100h fits with the drying period of the gelled material.
 the asymmetric stretching of Si–O–C bonds in the 3-(2-aminoethyl)-3-aminopropyltrimethoxysilane molecule and (b) MeOH vs reaction time.")
The formation of cyclic and linear Si–O–Si structures is delayed in the presence of EtOH (Fig. 7) and also, the number of these bonds decreases with respect to the samples prepared with no solvent added. In the case of the cyclic structures (Fig. 7a), the different EtOH concentrations provide a similar evolution showing a first and rapid increase of the band intensity within the 1st hour of reaction and then, no apparent increase in the number of cyclic structures is shown in the following 100h but once the material is on the gel state, these cyclic structures suddenly increase their concentration. This increase is more sustained in the samples obtained with the lowest amount of EtOH (DH3E2).
 and linear chains (1107cm−1) with reaction time for different EtOH concentrations.")
Regarding to the linear structures (Fig. 7b), their concentration increases progressively from the first minute reaction to 100h and this increase is less pronounced for high EtOH concentrations. It is significant to notice the decrease of the amount of linear structures in the case of the sol DH3E2 at long reaction times however, once the material is left to dry, the intensity of the band centred around 1107cm−1 acquires a value that is similar to the remainder samples processed with different solvent concentrations.
It is interesting to analyze the evolution of the band corresponding to Si–OH bonds that is shown in Fig. 8. The behaviour of this band seems to combine the two possibilities of the samples produced in the absence of any solvent (Fig. 5). At low EtOH concentrations, the band behaves similarly to the solvent-free sample processed with 3 mole H2O (DH3). When using more EtOH, the 930cm−1 band appears with high intensity at the very first moments of reaction and then decreases until the moment the sample acquired the gel state, i.e. more than 1000h reaction.

The evolution for the high EtOH concentration reaction is similar to that found for the reaction with only 1 mole of H2O (Fig. 5), suggesting that the more difficult the hydrolysis is, the favourable are the self-condensation reactions.
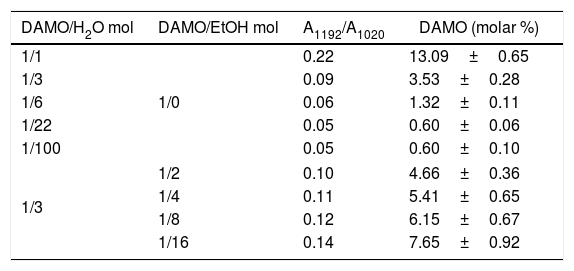
DiscussionThe above results have shown the high reactivity of DAMO molecules against hydrolysis when it is put in contact with H2O (Figs. 3 and 6). The hydrolysis reaction rate depends upon the amount of H2O and it occurs faster when using the stoichiometric amount of H2O necessary to hydrolyse all the hydrolysable groups. The presence of other solvent such as EtOH leads to a delay on the hydrolysis reaction rate which is greater with increasing amounts of EtOH. In all the cases, the hydrolysis reaction occurs in two steps perfectly differentiated, as can be deduced from the analysis of the FTIR bands. The first step occurs very fast, within the 1st hour reaction and the second step takes place at low rates at the end of the reaction. During this slow hydrolysis step, the self-condensation reactions between Si–OH groups prevail. Similar results have been found by Belgacem et al. through 29Si RMN studies in aqueous silane solutions [19,26] although the differences between Belgacem's work and this study reside in that they claim for a complete hydrolysis of the DAMO molecule and we have observed that such hydrolysis is no completed even for high reaction times since the 1192cm−1 IR band still appears in all the spectra. Instead of using excess H2O [26], either in the presence or in the absence of EtOH we have used the stoichiometric amount so, that may be the reason for the incomplete hydrolysis of the DAMO molecule even after gelling. In order to compare Belgacem's results with ours, we added 6, 22 and 100 mole H2O per mol DAMO and maintained reacting for 100h (until no change in the intensity of the 1192cm−1 band was observed). We firstly performed a calibration curve for DAMO/MeOH solutions containing 2.2×10⁻³ to 98.9 in mole % (regression coefficient=0.998) and afterwards we determined the relative number of hydrolysed DAMO molecules in solution from the band area ratio A1192/A1020. Table 1 presents the concentration of un-hydrolysed DAMO molecules after hydrolysis for 100h in pure H2O or H2O/EtOH. From these results it is clear that the hydrolysis of DAMO is not complete even for large amounts of H2O. Moreover, if the amount of H2O is just 1/3 of the stoichiometric one, the remainder un-hydrolysed DAMO concentration is just 13.1%, i.e. more than 86% of DAMO becomes hydrolysed.
3-(2-aminoethyl)-3-aminopropyltrimethoxysilane concentration (molar) after hydrolysis in pure H2O or H2O/EtOH.
| DAMO/H2O mol | DAMO/EtOH mol | A1192/A1020 | DAMO (molar %) |
|---|---|---|---|
| 1/1 | 1/0 | 0.22 | 13.09±0.65 |
| 1/3 | 0.09 | 3.53±0.28 | |
| 1/6 | 0.06 | 1.32±0.11 | |
| 1/22 | 0.05 | 0.60±0.06 | |
| 1/100 | 0.05 | 0.60±0.10 | |
| 1/3 | 1/2 | 0.10 | 4.66±0.36 |
| 1/4 | 0.11 | 5.41±0.65 | |
| 1/8 | 0.12 | 6.15±0.67 | |
| 1/16 | 0.14 | 7.65±0.92 | |
The formation of Si–OH terminations during hydrolysis was followed through the evolution of the band centred at 930cm−1, as pictured in Figs. 5 and 8. The behaviour shown is very similar to the one we already reported in the hydrolysis of an aminosilane [25] and is related to the evolution of T0H units [26]. The T0H units in DAMO correspond to three hydrolysed and non-condensed Si–OH terminations, or a R-Si(OH)3 unit where R is the di-amine moiety. In pure aqueous medium, these studies demonstrated that some free T0H groups still remain after 48h reaction whereas in the presence of EtOH, self-condensation reaction occurs in a large extent until all the free silanol groups condense. As shown in Figs. 5 and 8, the evolution of the Si–OH groups depend upon the H2O/DAMO and EtOH/DAMO ratios since for H2O/DAMO ratios equal or higher than the stoichiometric one, self-condensation reactions are somehow limited whereas if this ratio is lower than the stoichiometric one, the Si–OH groups are rapidly formed but then their concentration decreases with time until disappearance when the solution transforms to a gel. These results are in line to the ones discussed before concerning the evolution of the Si–O–Si bonds. When self-condensation reactions between hydrolysed groups take place, they generate more H2O molecules capable of continue hydrolysis. In presence of EtOH, hydrolysis reaction is hindered and, for the same amount of H2O, the increase of EtOH leads to more un-hydrolysed DAMO molecules after 100h reaction. We attribute this finding to possible steric effects or the equilibrium between non-hydrolysed and hydrolysed DAMO molecules.
Similarly, in the excess of EtOH, hydrolysis reaction occurs at low rate and the Si–OH groups tends to condensate to form new Si–O–Si bridges which release new H2O molecules allowing the continuation of the hydrolysis reaction. Considering the minimum values in Fig. 8 and the EtOH/DAMO ratio, it turns out that it is necessary 20 moles of EtOH to obtain a complete disappearance of the 960cm-1 band, 35% less than the EtOH amount claimed by Belgacem's group for the complete disappearance of T0H units [26]. Free hydroxyl groups are still available over long periods of time if both high H2O and low EtOH concentrations are used.
When Si–O–Si bonds are formed, the bands located at 1013 and 1107cm−1 inform about the presence of cyclic siloxane structures or long linear chains in poorly cross-linked structures, respectively (Figs. 4 and 7). Due to the broadness of the band and the possible contribution of some other adjacent FTIR features, it is difficult their definite assignation to T1, T2 and T3 units corresponding to dimers or end chain units (T1), part of linear chains (T2) and tri-dimensional network (T3), respectively [26]. Nevertheless, we can consider this band as an overall contribution of the three mentioned units. It is reported that T1, T2 and T3 units are formed immediately during the first 10min of reaction when DAMO is treated in pure H2O. As we observed in Fig. 4, the bands at 1013 and 1107cm−1 increase very rapidly reaching their maximum values during the first 6min. In the case of using EtOH, the work of Belgacem [26] described a progressive increase of T3 units in the first 24h whereas the T2 units are rapidly formed in the first few minutes of reaction and then show a continuous decrease of their concentration until stabilization after 24h. In this work, the band assigned to cyclic units and centred at 1013cm−1 increases during the first hour while the 1107cm−1 band, assigned to linear species, increases continuously until solution gels. 1013 and 1107cm−1 bands determined by FT-IR spectroscopy can be considered an average of the T2 and T3 units. The decrease in their intensity with the increase of EtOH suggests that the presence of the solvent impedes the formation of the tri-dimensional network.
All these results indicate that the self-condensation process results in the formation of cyclic or linear siloxane structures being the first ones that control the gelling process, i.e., it is necessary to get a given quantity of cyclic siloxane structures for gelling. Once the sample has gelled the formation of more cyclic or linear siloxane structures does not increase. FT-IR spectroscopy is a powerful technique for studying the hydrolysis and condensation of amino-silanes being possible to determine in a few seconds the moments at which the hydrolysis is completed and how the self-condensation proceeds in both pure water and alcoholic media. Results are comparable with those obtained by 29Si NMR spectroscopy.
ConclusionThe hydrolysis and self-condensation reactions of 3-(2-amino-ethylamino)propyl-trimethoxy silane (DAMO) have been studied by means of FT-IR spectroscopy in presence of different amounts of H2O and EtOH. The spectra were convoluted to several bands which were assigned to the different bonds in DAMO or MeOH molecules. It has been observed that the hydrolysis reaction occurs at a very fast rate and this rate increases with H2O concentration. Not all the hydrolysable groups became hydrolyzed even for high H2O concentrations and long reaction times and also, the presence of ethanol delays the hydrolysis reaction. The Si–OH groups formed after DAMO hydrolysis start to self-condense during the first moments of reaction and their concentration increase with the amount of H2O in the reaction since a given quantity of free Si–OH groups remains un-condensed. Self-condensation leads to the formation of Si–O–Si bonds to form cyclic structures long linear chains in poorly cross-linked structures. Both siloxane structures grow during the hydrolysis and condensation reactions and when the solution acquires the gelled form the cyclic structures rapidly increases their respective amount. The results of this work are of interest in a wide number of applications where DAMO is used as surface modifier or as reagent in the preparation of sol–gel derived materials. Moreover, the easiness and fastness of the FTIR technique make this technique very powerful for the analysis of this sort of fast hydrolysis reactions.
This work has been financially supported by Spanish Ministry of Economics and Competitiveness (MAT2016-76516-R)

