


In this communication, diindium tristungstate (In2W3O12) and hexaindium tungstate (In6WO12) powders were synthesized by the co-precipitation method at different pH values and heat treatment at 1073K for 2h. X-ray diffraction patterns and Rietveld refinements were employed to analyze the long-range structural ordering as well as quantify the presence crystallographic phases, respectively. All powders obtained in pH ranging from 2 to 3.5 exhibited a mixture of In2W3O12 and gamma-tungsten oxide (γ-WO3) phases. When prepared at pH close to 4, the powders presented both In2W3O12 and In6WO12 phases. All these crystalline structures were simulated in a three-dimensional visualization program by adopting the Rietveld refinements analysis as input data. The ultraviolet–visible spectra were employed to estimate the optical band gap energy of all powders for the first time.
En esta comunicación, los polvos tristungstate de diindio (In2W3O12) y tungstato de hexaindio (In6WO12) se sintetizaron mediante el método de co-precipitación a diferentes valores de pH y tratamiento térmico a 1.073K durante 2h. Se emplearon patrones de difracción de rayos X y refinamientos de Rietveld para analizar el ordenamiento estructural de largo alcance y cuantificar las fases cristalográficas de presencia, respectivamente. Todos los polvos obtenidos en un pH de 2 a 3,5 mostraron una mezcla de fases In2W3O12 y óxido de tungsteno gamma (γ-WO3). Cuando se prepararon a un pH cercano a 4, los polvos presentaron las fases In2W3O12 e In6WO12. Todas estas estructuras cristalinas se simularon en un programa de visualización tridimensional mediante la adopción del análisis de refinamiento de Rietveld como datos de entrada. Los espectros ultravioleta-visibles se emplearon para estimar la energía del intervalo de banda óptica de todos los polvos por primera vez.
In the last years, trivalent tungstates, as diindium tristungstate [In2(WO4)3 or In2W3O12] and hexaindium tungstate (In6WO12), have been especially synthesized by using top down (TD) approaches [1–6]. The TD approach involves the breaking down of bulk materials up to achieve nanometer-size particles. The most popular TD methods employ mixture of precursor powders, repeated attrition or milling cycles, and heat treatments performed at high temperatures for long reaction times [7–11]. Despite the simplicity and easy handling, the final products are able to present large grains, reduced surface area, nonuniform particle shapes and sizes, broad particle size distribution, and a significant amount of impurities [12].
In order to minimize theses drawbacks, a good strategy to prepare crystalline In2W3O12 or In6WO12 oxides is by means of bottom-up (BU) approaches. In BU approach, small building blocks (atomic and/or molecular species) are self-assembled to produced complex nanostructures, but with an efficient control on the particle sizes and shapes (nano-, meso-, or microscale) [13,14]. In general, trivalent tungstates (powder or thin film) have been synthesized by co-precipitation reaction, sol–gel, salt molten, and hydrothermal processing [15–18].
In terms of crystalline structure, In2W3O12 exhibits an orthorhombic structure with space group (Pnca) at room temperature. On the other hand, at approximately 531K, this tungstate crystallize in a monoclinic structure with space group (P21/a) [19,20]. A curious feature of In2W3O12 is that its orthorhombic structure has a negative thermal expansion coefficient for temperatures above 523K, while the monoclinic structure exhibit a positive thermal expansion coefficient for temperatures lower than 523K [21].
Different electronic properties of both In2W3O12 and In6WO12 oxides have been investigated, such as inorganic scintillators [22], luminescence [23], electrochromic [24], n-type semiconductor with low conductivity [25], trivalent-cation conductor [26], and photocatalysis [27]. However, in our understanding, the literature yet not reported the optical band gap behavior at room temperature of these kinds of trivalent tungstates.
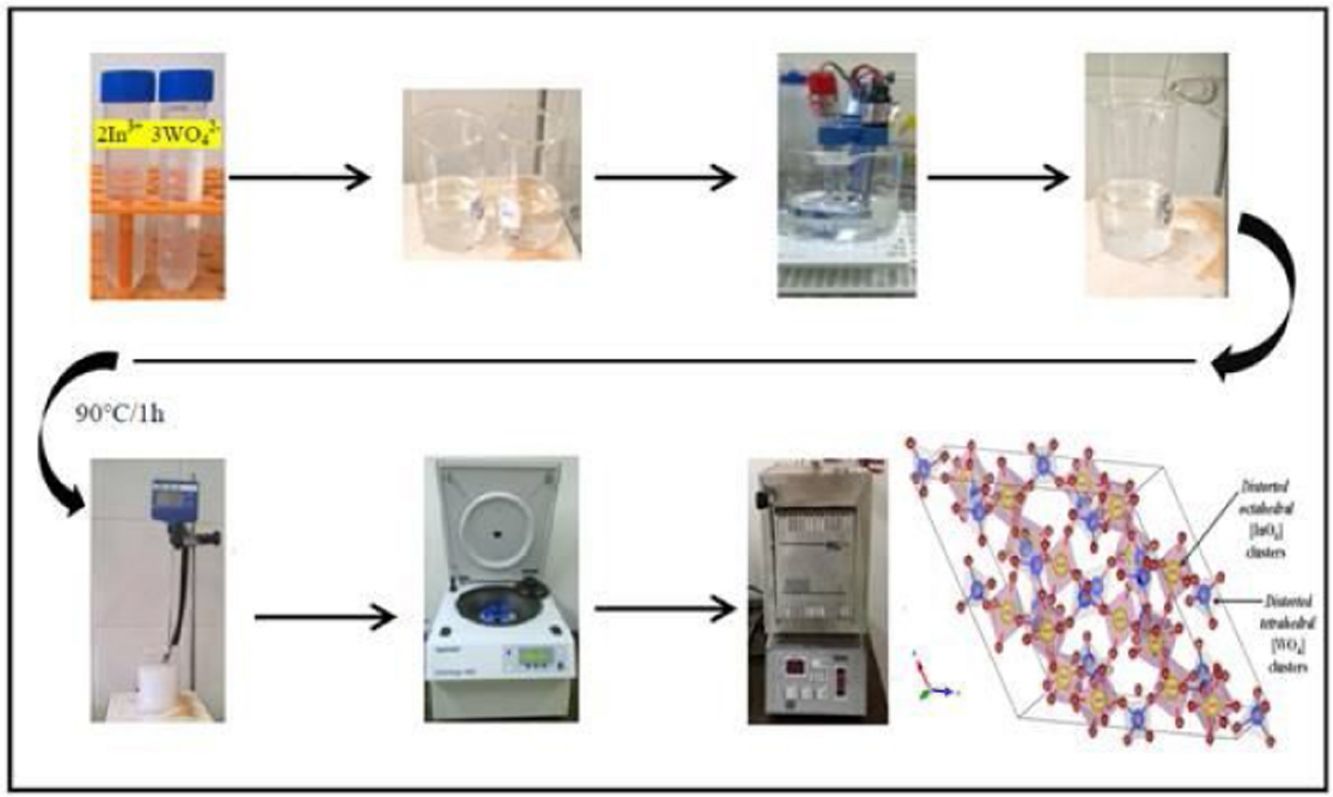
Therefore, in this short communication, we report on the formation of In2W3O12 and In6WO12 powders prepared by the co-precipitation method (at 363K for 1h) at different pH pre-adjustment values (from 2 to 4). The obtained amorphous precipitates were crystallized by means of heat treatments at 1073K for 2h. The structural ordering as well as crystalline phase identification and quantification were investigated in details by X-ray diffraction (XRD) and Rietveld refinement analysis, respectively. The ultraviolet–visible (UV–Vis) spectroscopy was a powerful tool in order to estimate the optical band gap energies of these tungstates.
Experimental detailsSynthesis of In2W3O12 and In6W3O12 powdersThe synthesis of In2W3O12 and In6W3O12 powders is described as follows: 3×10⁻³ mol of sodium tungstate (VI) dihydrate (Na2WO4·2H2O; 99.0% purity, Sigma–Aldrich) and 2×10⁻³ mol of indium (III) nitrate hydrate [In(NO3)3·H2O; 99.99% purity, Sigma–Aldrich] were separately placed in two plastic tubes (Falcon, capacity of 60mL) and dissolved with 50mL of deionized water (DI-H2O). The first solution, containing, Naaq+ and WO4aq2− ions, was transferred into a beaker and the volume was completed with 50mL of DI-H2O. This same procedure was adopted for the second solution containing Inaq3+ and NO3aq− ions. The pHmeter (QUIMIS®, Brazil) registered pH values of 9.6 and 3.1 for these solutions, respectively. The complete dissolution of their respective chemical precursors [Na2WO4·2H2O and In(NO3)3·H2O] is described in the following equations:


This experimental procedure was performed five times. Before mixing the solutions for the formation of amorphous precipitates, we perform a fine pH adjustment in the first solution by means of nitric acid (HNO3; 70% purity, Meck). The pH values used in this solution were 2; 2.5; 3; 3.5 and 4. Similar the first solution, ammonium hydroxide solution (NH3·H2O; 30% purity, Vetec) and HNO3 were employed to adjust the pH of the second solution. In this case, NH3·H2O to acquire pH at 3.5 and 4.0, while the HNO3 for pH from 2 to 3. Finally, after these pH adjustments, the second solution (100mL) was mixed with the first solution (100mL) in a same pH condition. This mixture was maintained under constant stirring at 363K for 1h. After this process, the formation of a white suspension with precipitates was verified. This reaction is described by Eq. (3):
These suspensions containing white precipitates were washed fifteen times (water and acetone), centrifuged (8500rpm for 10min), and subsequently dried in a conventional furnace for 338K for 10h. Finally, the amorphous precipitates were calcined at 1073K for 2h, maintaining a heating rate of 274K/min (Electronic Supplementary Material with XRD patterns and TGA analysis of both In2W3O12 and In6W3O12 powders obtained at pH 4).
Characterizations of In2W3O12 and In6W3O12 powdersThe structural analysis of all powders was performed by means of XRD patterns by using a LabX XRD-6000 diffractometer (Shimadzu®, Japan) with CuKα radiation (λ=0.154184nm). Data were collected over 2θ ranging from 10° to 40° with a scanning scan rate and step size of 2°/min and 0.02°, respectively. The PowderCell software [28] was employed to identify all crystallographic phases. For Rietveld analysis, XRD patterns were acquired by using a D/Max-2500PC diffractometer (Rigaku, Japan) with CuKα radiation. Data were collected over 2θ ranging from 10° to 110° with a scanning scan rate and step size of 0.2°/min and 0.02°, respectively. Ultraviolet–Visible (UV–Vis) spectra were measured on a Cary 5G Spectrophotometer (Varian, USA) operated in diffuse-reflectance mode.
Results and discussionStructural analysis of In2W3O12 –In6W3O12 powdersFigs. 1(a, b) illustrate XRD patterns of all powders synthesized by the co-precipitation with different pH values and heat treated at 1073K for 2h.
XRD patterns were employed to identify the crystallographic phases and analyze the degree of crystallization of In2W3O12 powders. Firstly, two different crystalline phases were identified in XRD patterns for the powders synthesized with pH ranging from 2 to 3.5 (Fig. 1(a)). The majority phase was indexed to In2W3O12 with a monoclinic structure and space group (P21/a) (“Inorganic Crystal Structure Data” (ICSD) No. 99607) [5], while the secondary phase was ascribed to the polymorph of γ-WO3 with monoclinic structure and space group (P21/n) (ICSD No. 50727) [29]. However, when the pH was adjusted at 4, diffraction peaks related to γ-WO3 disappeared completely (Fig. 1(b)). Besides the In2W3O12, the appearing of a new phase indexed to In6WO12 with rhombohedral structure and space group (R3¯) was clearly detected in this system (ICSD No. 27197) [7]. In principle, pH values superior to 4 considerably favors the crystallization of In6WO12. All these XRD patterns confirm that the pH plays a fundamental role for the formation of the desired In2W3O12 phase. All our results are consistent with the data previously published in the literature [30].
Quantitative analysis of In2W3O12 and In6W3O12 powders by Rietveld method and pH at 4 (b) with posterior heat treatment at 1073K for 2h.")
The indexing of the phases was conducted by using the structural characterization data obtained from XRD patterns (experimental) with the respective crystallographic files (theoretical) [ICSD No. 99607 (In2W3O12), 50727 (γ-WO3), and 27197 (In6WO12)] by using the ReX.Cell software [31]. In addition, the general structure analysis software (GSAS) software was used [32] to perform the Rietveld refinement analysis and quantify the crystalline phases in the samples.
The Rietveld refinement method is a least squares refinement procedure wherein the experimental step-scanned values are adapted to the calculated ones. The profiles are considered to be known, and a model for the crystal structure is available [33]. This structural refinement method presents several advantages over conventional quantitative analysis methods. As the method uses a whole pattern fitting algorithm, all lines for each phase are explicitly considered, and even severely overlapped lines are usually not a problem. Thus, it is not necessary to decompose patterns into separate Bragg peaks, as is often the case in traditional methods. The use of all reflections in a pattern rather than only the strongest ones minimizes both the uncertainty in the derived weight fractions and the effects of preferred orientation, primary extinction, and nonlinear detection systems [34].
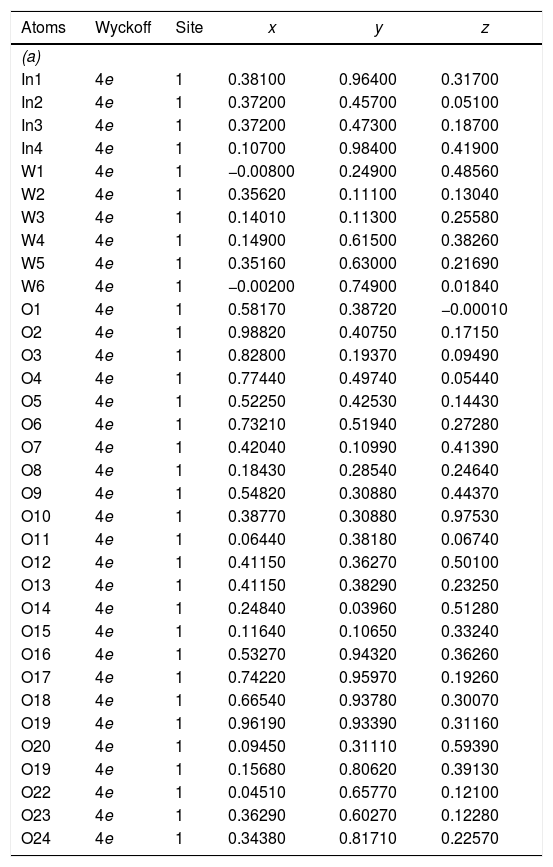
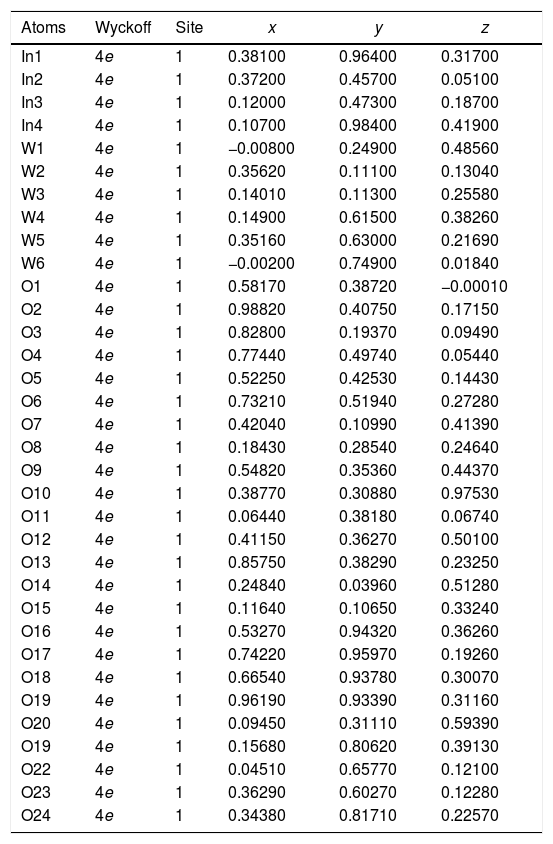
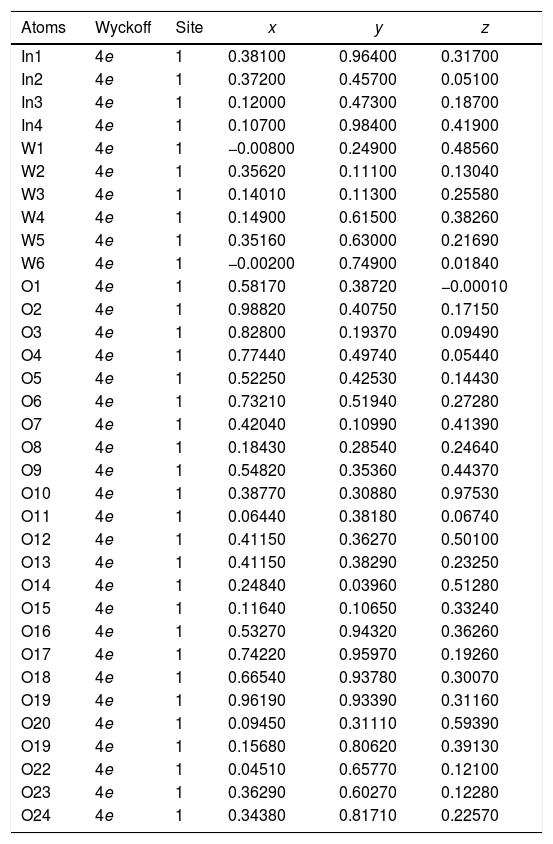
The experimental lattice parameters, unit cell volumes, phase percentage, length of the chemical bonds, and bond angles between (OInO) and (OWO) in In2W3O12, γ-WO3, and In6WO12 powders were obtained and calculated by using the Rietveld refinement method [35,36] with the GSAS software [32]. The structural refinement results of In2W3O12 powders obtained at different pH values and heat treated at 1073K for 2h are showed in Figs. 2(a–e). In addition, below the respective Rietveld refinements are illustrated in the pie charts indicating the weight percentage for each of the phases found in XRD patterns. The Rietveld refinement results are displayed in Tables 1a-1e (Electronic Supplementary Material with validation of CIF files and structure factors in PLATON).
 pH=2; (b) pH=2.5; (c) pH=3; (d) pH=3.5; and (e) pH=4 with posterior heat treatment at 1073K for 2h. The weight percentage of all crystallographic phases for each sample is shown as pie chart.")
Rietveld refinement results for In2W3O12 and In6WO12 powders synthesized by the co-precipitation method at (a) pH=2, (b) pH=2.5, (c) pH=3, (d) pH=3.5 and (e) pH=4, and heat treated at 1073K for 2h.
| Atoms | Wyckoff | Site | x | y | z |
|---|---|---|---|---|---|
| (a) | |||||
| In1 | 4e | 1 | 0.38100 | 0.96400 | 0.31700 |
| In2 | 4e | 1 | 0.37200 | 0.45700 | 0.05100 |
| In3 | 4e | 1 | 0.37200 | 0.47300 | 0.18700 |
| In4 | 4e | 1 | 0.10700 | 0.98400 | 0.41900 |
| W1 | 4e | 1 | −0.00800 | 0.24900 | 0.48560 |
| W2 | 4e | 1 | 0.35620 | 0.11100 | 0.13040 |
| W3 | 4e | 1 | 0.14010 | 0.11300 | 0.25580 |
| W4 | 4e | 1 | 0.14900 | 0.61500 | 0.38260 |
| W5 | 4e | 1 | 0.35160 | 0.63000 | 0.21690 |
| W6 | 4e | 1 | −0.00200 | 0.74900 | 0.01840 |
| O1 | 4e | 1 | 0.58170 | 0.38720 | −0.00010 |
| O2 | 4e | 1 | 0.98820 | 0.40750 | 0.17150 |
| O3 | 4e | 1 | 0.82800 | 0.19370 | 0.09490 |
| O4 | 4e | 1 | 0.77440 | 0.49740 | 0.05440 |
| O5 | 4e | 1 | 0.52250 | 0.42530 | 0.14430 |
| O6 | 4e | 1 | 0.73210 | 0.51940 | 0.27280 |
| O7 | 4e | 1 | 0.42040 | 0.10990 | 0.41390 |
| O8 | 4e | 1 | 0.18430 | 0.28540 | 0.24640 |
| O9 | 4e | 1 | 0.54820 | 0.30880 | 0.44370 |
| O10 | 4e | 1 | 0.38770 | 0.30880 | 0.97530 |
| O11 | 4e | 1 | 0.06440 | 0.38180 | 0.06740 |
| O12 | 4e | 1 | 0.41150 | 0.36270 | 0.50100 |
| O13 | 4e | 1 | 0.41150 | 0.38290 | 0.23250 |
| O14 | 4e | 1 | 0.24840 | 0.03960 | 0.51280 |
| O15 | 4e | 1 | 0.11640 | 0.10650 | 0.33240 |
| O16 | 4e | 1 | 0.53270 | 0.94320 | 0.36260 |
| O17 | 4e | 1 | 0.74220 | 0.95970 | 0.19260 |
| O18 | 4e | 1 | 0.66540 | 0.93780 | 0.30070 |
| O19 | 4e | 1 | 0.96190 | 0.93390 | 0.31160 |
| O20 | 4e | 1 | 0.09450 | 0.31110 | 0.59390 |
| O19 | 4e | 1 | 0.15680 | 0.80620 | 0.39130 |
| O22 | 4e | 1 | 0.04510 | 0.65770 | 0.12100 |
| O23 | 4e | 1 | 0.36290 | 0.60270 | 0.12280 |
| O24 | 4e | 1 | 0.34380 | 0.81710 | 0.22570 |
| W1 | 4e | 1 | 0.25300 | 0.02600 | 0.28300 |
| W2 | 4e | 1 | 0.24600 | 0.03300 | 0.78110 |
| O1 | 4e | 1 | 0.00000 | 0.03000 | 0.21800 |
| O2 | 4e | 1 | 0.00200 | 0.46400 | 0.22100 |
| O3 | 4e | 1 | 0.28200 | 0.26400 | 0.27700 |
| O4 | 4e | 1 | 0.21400 | 0.25700 | 0.74200 |
| O5 | 4e | 1 | 0.27700 | 0.02800 | 0.00020 |
| O6 | 4e | 1 | 0.28800 | 0.49800 | 0.00000 |
[Phase 1: In2W3O12; P21/a (14) – Monoclinic (a=16.3624(8)Å, b=9.6366(3)Å, c=19.0316(8)Å; V=2448.7(2)Å3; β=125.3149(3)°, Z=8 and ρ=5.27932g/cm3)] and [Phase 2: γ-WO3; P21/n (14)−Monoclinic (a=7.3072(2)Å, b=7.5376(2)Å, c=7.6961(2)Å, V=423.86(1)Å3; β=90.735(4)°, Z=8 and ρ=7.26599g/cm3]; Rp=5.88%; Rwp=7.79%; RBragg=4.12%; χ2=2.89 and S=1.70. Weights of the phases in the In2W3O12 Monoclinic=51.11% and γ-WO3 Monoclinic=48.89%.
aaaa.
| Atoms | Wyckoff | Site | x | y | z |
|---|---|---|---|---|---|
| In1 | 4e | 1 | 0.38100 | 0.96400 | 0.31700 |
| In2 | 4e | 1 | 0.37200 | 0.45700 | 0.05100 |
| In3 | 4e | 1 | 0.12000 | 0.47300 | 0.18700 |
| In4 | 4e | 1 | 0.10700 | 0.98400 | 0.41900 |
| W1 | 4e | 1 | −0.00800 | 0.24900 | 0.48560 |
| W2 | 4e | 1 | 0.35620 | 0.11100 | 0.13040 |
| W3 | 4e | 1 | 0.14010 | 0.11300 | 0.25580 |
| W4 | 4e | 1 | 0.14900 | 0.61500 | 0.38260 |
| W5 | 4e | 1 | 0.35160 | 0.63000 | 0.21690 |
| W6 | 4e | 1 | −0.00200 | 0.74900 | 0.01840 |
| O1 | 4e | 1 | 0.58170 | 0.38720 | −0.00010 |
| O2 | 4e | 1 | 0.98820 | 0.40750 | 0.17150 |
| O3 | 4e | 1 | 0.82800 | 0.19370 | 0.09490 |
| O4 | 4e | 1 | 0.77440 | 0.49740 | 0.05440 |
| O5 | 4e | 1 | 0.52250 | 0.42530 | 0.14430 |
| O6 | 4e | 1 | 0.73210 | 0.51940 | 0.27280 |
| O7 | 4e | 1 | 0.42040 | 0.10990 | 0.41390 |
| O8 | 4e | 1 | 0.18430 | 0.28540 | 0.24640 |
| O9 | 4e | 1 | 0.54820 | 0.35360 | 0.44370 |
| O10 | 4e | 1 | 0.38770 | 0.30880 | 0.97530 |
| O11 | 4e | 1 | 0.06440 | 0.38180 | 0.06740 |
| O12 | 4e | 1 | 0.41150 | 0.36270 | 0.50100 |
| O13 | 4e | 1 | 0.85750 | 0.38290 | 0.23250 |
| O14 | 4e | 1 | 0.24840 | 0.03960 | 0.51280 |
| O15 | 4e | 1 | 0.11640 | 0.10650 | 0.33240 |
| O16 | 4e | 1 | 0.53270 | 0.94320 | 0.36260 |
| O17 | 4e | 1 | 0.74220 | 0.95970 | 0.19260 |
| O18 | 4e | 1 | 0.66540 | 0.93780 | 0.30070 |
| O19 | 4e | 1 | 0.96190 | 0.93390 | 0.31160 |
| O20 | 4e | 1 | 0.09450 | 0.31110 | 0.59390 |
| O19 | 4e | 1 | 0.15680 | 0.80620 | 0.39130 |
| O22 | 4e | 1 | 0.04510 | 0.65770 | 0.12100 |
| O23 | 4e | 1 | 0.36290 | 0.60270 | 0.12280 |
| O24 | 4e | 1 | 0.34380 | 0.81710 | 0.22570 |
| W1 | 4e | 1 | 0.25300 | 0.02600 | 0.28300 |
| W2 | 4e | 1 | 0.24600 | 0.03300 | 0.78110 |
| O1 | 4e | 1 | 0.00000 | 0.03000 | 0.21800 |
| O2 | 4e | 1 | 0.00200 | 0.46400 | 0.22100 |
| O3 | 4e | 1 | 0.28200 | 0.26400 | 0.27700 |
| O4 | 4e | 1 | 0.21400 | 0.25700 | 0.74200 |
| O5 | 4e | 1 | .27700 | 0.02800 | 0.00020 |
| O6 | 4e | 1 | 0.28800 | 0.49800 | 0.00000 |
[Phase 1: In2W3O12; P21/a (14) – Monoclinic (a=16.3664(7) Å, b=9.6372(3) Å, c=19.0353(7) Å; V=2449.7(1) Å3; β=125.3216(25)°, Z=8 and ρ=5.27708g/cm3)] and [Phase 2: γ-WO3; P21/n (14) – Monoclinic (a=7.3106(3) Å, b=7.5343(2) Å, c=7.6991(2) Å, V=424.05(2) Å3; β=90.613(7)°, Z=8 and ρ=7.26282g/cm3]; Rp=5.57%; Rwp=7.46%; RBragg=4.29%; χ2=2.22 and S=1.49. Weights of the phases in the In2W3O12 Monoclinic=57.96% and γ-WO3 Monoclinic=42.04%.
aaaa.
| Atoms | Wyckoff | Site | x | y | z |
|---|---|---|---|---|---|
| In1 | 4e | 1 | 0.38100 | 0.96400 | 0.31700 |
| In2 | 4e | 1 | 0.37200 | 0.45700 | 0.05100 |
| In3 | 4e | 1 | 0.12000 | 0.47300 | 0.18700 |
| In4 | 4e | 1 | 0.10700 | 0.98400 | 0.41900 |
| W1 | 4e | 1 | −0.00800 | 0.24900 | 0.48560 |
| W2 | 4e | 1 | 0.35620 | 0.11100 | 0.13040 |
| W3 | 4e | 1 | 0.14010 | 0.11300 | 0.25580 |
| W4 | 4e | 1 | 0.14900 | 0.61500 | 0.38260 |
| W5 | 4e | 1 | 0.35160 | 0.63000 | 0.21690 |
| W6 | 4e | 1 | −0.00200 | 0.74900 | 0.01840 |
| O1 | 4e | 1 | 0.58170 | 0.38720 | −0.00010 |
| O2 | 4e | 1 | 0.98820 | 0.40750 | 0.17150 |
| O3 | 4e | 1 | 0.82800 | 0.19370 | 0.09490 |
| O4 | 4e | 1 | 0.77440 | 0.49740 | 0.05440 |
| O5 | 4e | 1 | 0.52250 | 0.42530 | 0.14430 |
| O6 | 4e | 1 | 0.73210 | 0.51940 | 0.27280 |
| O7 | 4e | 1 | 0.42040 | 0.10990 | 0.41390 |
| O8 | 4e | 1 | 0.18430 | 0.28540 | 0.24640 |
| O9 | 4e | 1 | 0.54820 | 0.35360 | 0.44370 |
| O10 | 4e | 1 | 0.38770 | 0.30880 | 0.97530 |
| O11 | 4e | 1 | 0.06440 | 0.38180 | 0.06740 |
| O12 | 4e | 1 | 0.41150 | 0.36270 | 0.50100 |
| O13 | 4e | 1 | 0.85750 | 0.38290 | 0.23250 |
| O14 | 4e | 1 | 0.24840 | 0.03960 | 0.51280 |
| O15 | 4e | 1 | 0.11640 | 0.10650 | 0.33240 |
| O16 | 4e | 1 | 0.53270 | 0.94320 | 0.36260 |
| O17 | 4e | 1 | 0.74220 | 0.95970 | 0.19260 |
| O18 | 4e | 1 | 0.66540 | 0.93780 | 0.30070 |
| O19 | 4e | 1 | 0.96190 | 0.93390 | 0.31160 |
| O20 | 4e | 1 | 0.09450 | 0.31110 | 0.59390 |
| O19 | 4e | 1 | 0.15680 | 0.80620 | 0.39130 |
| O22 | 4e | 1 | 0.04510 | 0.65770 | 0.12100 |
| O23 | 4e | 1 | 0.36290 | 0.60270 | 0.12280 |
| O24 | 4e | 1 | 0.34380 | 0.81710 | 0.22570 |
| W1 | 4e | 1 | 0.25300 | 0.02600 | 0.28300 |
| W2 | 4e | 1 | 0.24600 | 0.03300 | 0.78110 |
| O1 | 4e | 1 | 0.00000 | 0.03000 | 0.21800 |
| O2 | 4e | 1 | 0.00200 | 0.46400 | 0.22100 |
| O3 | 4e | 1 | 0.28200 | 0.26400 | 0.27700 |
| O4 | 4e | 1 | 0.21400 | 0.25700 | 0.74200 |
| O5 | 4e | 1 | 0.27700 | 0.02800 | 0.00020 |
| O6 | 4e | 1 | 0.28800 | 0.49800 | 0.00000 |
[Phase 1: In2W3O12; P21/a (14) – Monoclinic (a=16.3752(2) Å, b=9.6415(6) Å, c=19.0521(2) Å; V=2454.65(2) Å3; β=125.309(6)°, Z=8 and ρ=5.26644g/cm3)] and [Phase 2: γ-WO3; P21/n (14) – Monoclinic (a=7.3126(6) Å, b=7.5398(7) Å, c=7.7023(7) Å, V=424.65(6) Å3; β=90.615(15)°, Z=8 and ρ=7.25259g/cm3]; Rp=7.60%; Rwp=10.16%; RBragg=3.20%; χ2=1.99 and S=1.41. Weights of the phases in the In2W3O12 Monoclinic=65.74% and γ-WO3 Monoclinic=34.26%.
aaaa.
| Atoms | Wyckoff | Site | x | y | z |
|---|---|---|---|---|---|
| In1 | 4e | 1 | 0.38100 | 0.96400 | 0.31700 |
| In2 | 4e | 1 | 0.37200 | 0.45700 | 0.05100 |
| In3 | 4e | 1 | 0.12000 | 0.47300 | 0.18700 |
| In4 | 4e | 1 | 0.10700 | 0.98400 | 0.41900 |
| W1 | 4e | 1 | −0.00800 | 0.24900 | 0.48560 |
| W2 | 4e | 1 | 0.35620 | 0.11100 | 0.13040 |
| W3 | 4e | 1 | 0.14010 | 0.11300 | 0.25580 |
| W4 | 4e | 1 | 0.14900 | 0.61500 | 0.38260 |
| W5 | 4e | 1 | 0.35160 | 0.63000 | 0.21690 |
| W6 | 4e | 1 | −0.00200 | 0.74900 | 0.01840 |
| O1 | 4e | 1 | 0.58170 | 0.38720 | −0.00010 |
| O2 | 4e | 1 | 0.98820 | 0.40750 | 0.17150 |
| O3 | 4e | 1 | 0.82800 | 0.19370 | 0.09490 |
| O4 | 4e | 1 | 0.77440 | 0.49740 | 0.05440 |
| O5 | 4e | 1 | 0.52250 | 0.42530 | 0.14430 |
| O6 | 4e | 1 | 0.73210 | 0.51940 | 0.27280 |
| O7 | 4e | 1 | 0.42040 | 0.10990 | 0.41390 |
| O8 | 4e | 1 | 0.18430 | 0.28540 | 0.24640 |
| O9 | 4e | 1 | 0.54820 | 0.35360 | 0.44370 |
| O10 | 4e | 1 | 0.38770 | 0.30880 | 0.97530 |
| O11 | 4e | 1 | 0.06440 | 0.38180 | 0.06740 |
| O12 | 4e | 1 | 0.41150 | 0.36270 | 0.50100 |
| O13 | 4e | 1 | 0.41150 | 0.38290 | 0.23250 |
| O14 | 4e | 1 | 0.24840 | 0.03960 | 0.51280 |
| O15 | 4e | 1 | 0.11640 | 0.10650 | 0.33240 |
| O16 | 4e | 1 | 0.53270 | 0.94320 | 0.36260 |
| O17 | 4e | 1 | 0.74220 | 0.95970 | 0.19260 |
| O18 | 4e | 1 | 0.66540 | 0.93780 | 0.30070 |
| O19 | 4e | 1 | 0.96190 | 0.93390 | 0.31160 |
| O20 | 4e | 1 | 0.09450 | 0.31110 | 0.59390 |
| O19 | 4e | 1 | 0.15680 | 0.80620 | 0.39130 |
| O22 | 4e | 1 | 0.04510 | 0.65770 | 0.12100 |
| O23 | 4e | 1 | 0.36290 | 0.60270 | 0.12280 |
| O24 | 4e | 1 | 0.34380 | 0.81710 | 0.22570 |
| W1 | 4e | 1 | 0.25300 | 0.02600 | 0.28300 |
| W2 | 4e | 1 | 0.24600 | 0.03300 | 0.78110 |
| O1 | 4e | 1 | 0.00000 | 0.03000 | 0.21800 |
| O2 | 4e | 1 | 0.00200 | 0.46400 | 0.22100 |
| O3 | 4e | 1 | 0.28200 | 0.26400 | 0.27700 |
| O4 | 4e | 1 | 0.21400 | 0.25700 | 0.74200 |
| O5 | 4e | 1 | 0.27700 | 0.02800 | 0.00020 |
| O6 | 4e | 1 | 0.28800 | 0.49800 | 0.00000 |
[Phase 1: In2W3O12; P21/a (14) – Monoclinic (a=16.3679(6)Å, b=9.6402(3) Å, c=19.0454(7) Å; V=2451.63(9) Å3; β=125.3327(3)°, Z=8 and ρ=5.27292g/cm3)] and [Phase 2: γ-WO3; P21/n (14) – Monoclinic (a=7.30724(2), b=7.53764(2) Å, c=7.69613(2) Å, V=423.863(2) Å3; β=90.735(4)°, Z=8 and ρ=7.26628g/cm3]; Rp=5.46%; Rwp=7.30%; RBragg=3.30%; χ2=1.59 and S=1.26. Weights of the phases in the In2W3O12 Monoclinic=71.95% and γ-WO3 Monoclinic=28.05%.
aaaa.
| Atoms | Wyckoff | Site | x | y | z |
|---|---|---|---|---|---|
| In1 | 4e | 1 | 0.38100 | 0.96400 | 0.31700 |
| In2 | 4e | 1 | 0.37200 | 0.45700 | 0.05100 |
| In3 | 4e | 1 | 0.12000 | 0.47300 | 0.18700 |
| In4 | 4e | 1 | 0.10700 | 0.98400 | 0.41900 |
| W1 | 4e | 1 | −0.00800 | 0.24900 | 0.48560 |
| W2 | 4e | 1 | 0.35620 | 0.11100 | 0.13040 |
| W3 | 4e | 1 | 0.14010 | 0.11300 | 0.25580 |
| W4 | 4e | 1 | 0.14900 | 0.61500 | 0.38260 |
| W5 | 4e | 1 | 0.35160 | 0.63000 | 0.21690 |
| W6 | 4e | 1 | −0.00200 | 0.74900 | 0.01840 |
| O1 | 4e | 1 | 0.58170 | 0.38720 | −0.00010 |
| O2 | 4e | 1 | 0.98820 | 0.40750 | 0.17150 |
| O3 | 4e | 1 | 0.82800 | 0.19370 | 0.09490 |
| O4 | 4e | 1 | 0.77440 | 0.49740 | 0.05440 |
| O5 | 4e | 1 | 0.52250 | 0.42530 | 0.14430 |
| O6 | 4e | 1 | 0.73210 | 0.51940 | 0.27280 |
| O7 | 4e | 1 | 0.42040 | 0.10990 | 0.41390 |
| O8 | 4e | 1 | 0.18430 | 0.28540 | 0.24640 |
| O9 | 4e | 1 | 0.54820 | 0.35360 | 0.44370 |
| O10 | 4e | 1 | 0.38770 | 0.30880 | 0.97530 |
| O11 | 4e | 1 | 0.06440 | 0.38180 | 0.06740 |
| O12 | 4e | 1 | 0.41150 | 0.36270 | 0.50100 |
| O13 | 4e | 1 | 0.41150 | 0.38290 | 0.23250 |
| O14 | 4e | 1 | 0.24840 | 0.03960 | 0.51280 |
| O15 | 4e | 1 | 0.11640 | 0.10650 | 0.33240 |
| O16 | 4e | 1 | 0.53270 | 0.94320 | 0.36260 |
| O17 | 4e | 1 | 0.74220 | 0.95970 | 0.19260 |
| O18 | 4e | 1 | 0.66540 | 0.93780 | 0.30070 |
| O19 | 4e | 1 | 0.96190 | 0.93390 | 0.31160 |
| O20 | 4e | 1 | 0.09450 | 0.31110 | 0.59390 |
| O19 | 4e | 1 | 0.15680 | 0.80620 | 0.39130 |
| O22 | 4e | 1 | 0.04510 | 0.65770 | 0.12100 |
| O23 | 4e | 1 | 0.36290 | 0.60270 | 0.12280 |
| O24 | 4e | 1 | 0.34380 | 0.81710 | 0.22570 |
| In1 | 3a | 1 | 0.13970 | 0.32140 | 0.60440 |
| W1 | 18f | 1 | 0 | 0 | 0 |
| O1 | 18f | 1 | −0.04260 | 0.09740 | 0.29690 |
| O2 | 18f | 1 | 0.40570 | 0.58380 | 0.82190 |
[Phase 1: In2W3O12; P21/a (14) – Monoclinic (a=16.3757(11) Å, b=9.6365(4) Å, c=19.0385(1) Å; V=2450.56(2) Å3; β=125.3465(3)°, Z=8 and ρ=5.27522g/cm3)] and [Phase 2: In6WO12; R3¯ (148) – Trigonal (a=b=6.2344(1) Å, c=6.2344 Å, V=232.19(1) Å3; Z=1 and ρ=7.61446g/cm3]; Rp=8.22%; Rwp=10.93%; RBragg=4.70%; χ2=3.80 and S=1.95. Weights of the phases in the In2W3O12 Monoclinic=55.15% and In6WO12 Trigonal=44.85%.
The Rietveld refinement results exhibited a good agreement between observed XRD patterns and theoretical results, as illustrated in Fig. 2(a–e). As can be seen, the difference between experimentally observed XRD patterns and the theoretically calculated data was close to zero in terms of the scale of intensity, as indicated by the line (YObserved−YCalculated). In a first observation, for pH ranging from 2 to 3.5 in the aqueous solution, the powders heat treated at 1073K for 2h revealed a reduction of γ-WO3 as well as an increase of In2W3O12 with the increase of pH value (Figs. 2(a–e)). In contrast, the powders obtained with pH adjusted at 4 showed a mixture of In6WO12 and In6WO12 phases. This information implies in the difficulty of forming the desired pure In2W3O12 phase.
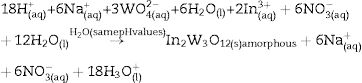
Based on our experimental data, we propose the following reactions induced by the heat treatment at 1073K for 2h:

A possible reaction performed pH at 4 is related to the formation of solid In2O3 and WO3 stoichiometric phases (both in amorphous state) when precipitated at 363K for 1h (Eq. (4)). More details on the Rietveld refinement analysis are presented in Tables 1a-1e.
In Tables 1a-1e, the statistical parameters (Rp, Rwp, RBragg, χy, and S) exhibited small deviations, which indicate the good quality of the structural refinements. The structural refinement data confirmed that all In2W3O12 powders were crystallized in a monoclinic structure with space group (P21/a), point-group symmetry (C2h5), and eight molecular formula units per unit cell (Z=8). The secondary or deleterious phase was identified as γ-WO3, which has a monoclinic structure with space group (P21/a), point-group symmetry (C2h5), and eight molecular formula units per unit cell (Z=8). Therefore, these powders are isostructural with a small difference in their space group due to an inversion in the center of symmetry, which leads to changes in (x, y, z) atomic coordinates [37].
The Rietveld refinement data confirmed that the In2W3O12 powders synthesized at pH=4 exhibited a deleterious phase related to In6WO12, which presents a rhombohedral structure with space group (R3¯), point-group symmetry (S6), and one molecular formula unit per unit cell (Z=1). Moreover, small variations in the atomic positions of In, W, and O atoms were observed because the atoms do not occupy fixed positions in this specific type of structure. These results indicate major variations in the position of O atoms because of distortion caused in the lattice, as demonstrated by the XRD technique. These distortions are able to influence in bond lengths and angles of InO or WO bonds, causing the formation of distorted octahedral [InO6] clusters and tetrahedral [WO4] clusters in In2W3O12 structure.
Crystalline structure, symmetry, and coordination clusters of In2W3O12, γ-WO3, and In6WO12 latticesFig. 3(a–c) illustrates schematic representations of crystalline structures, symmetry, geometry, and coordination of In2W3O12, γ-WO3, and In6WO12 powders, respectively.
 monoclinic In2W3O12 unit cell, (b) monoclinic γ-WO3 unit cell, and (c) rhombohedral In6WO12 unit cell, respectively.")
All these structures were modeled using the visualization system for electronic and structural analysis (VESTA) software (version 3.4.3) [38,39] with the lattice parameters and atomic positions obtained from Rietveld refinement results (Tables 1a-1e) as input data. In In2W3O12 structure (Fig. 3(a)), In atoms are coordinated to six O atoms, forming distorted octahedral [InO6] clusters with symmetry group (Oh). These octahedron-type polyhedrons have 6-vertices, 8-faces, and 12-edges [40]. In addition, W atoms are coordinated to four O atoms, forming distorted tetrahedral [WO4] clusters with symmetry group (Td). These tetrahedron-type polyhedrons are composed of 4-vertices, 4-faces, and 6-edges [41]. For γ-WO3 structure (Fig. 3(b)), all W atoms are bonded to six O atoms, resulting in distorted octahedral [WO6] clusters. The existence of distortion in WOW bonds of [WO6]–[WO6] clusters can be easily noted in this structure.
Finally, In6WO12 structure has its In atoms coordinated to six O atoms, resulting in distorted octahedral [InO6] clusters. Moreover, W atoms are coordinated to six O atoms, forming octahedral [WO6] clusters (Fig. 3(c)). The Jahn–Teller (JT) effects can be actuating on octahedral [InO6] clusters (In2W3O12), octahedral [WO6] clusters (γ-WO3), and both octahedral [InO6]/[WO6] clusters (In6WO12) [42]. This JT effect is caused by the symmetry breaking in octahedral [InO6]/[WO6] clusters, in which the two axial bonds can be shorter or longer than the equatorial bonds. Consequently, this phenomenon reduces the symmetry and energy in the lattice [43]. In principle, In2W3O12 powders are able to present variations in both (O–In–O)/(O–W–O) bond angles and lengths, causing distortions in octahedral [InO6] and tetrahedral [WO4] clusters with distinct degrees of order-disorder in the lattice.
UV–Vis spectra and optical band gap energy analysis of In2W3O12 and In6W3O12 powdersThe optical band gap energy (Egap) was calculated by using the Kubelka–Munk equation [44], which is based on the transformation of diffuse reflectance measurements to estimate Egap values with good accuracy [45]. The Kubelka–Munk equation for any wavelength is described by the following Eq. (5):
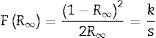
where F(R∞) is the Kubelka–Munk function or the absolute reflectance of the sample. The magnesium oxide was adopted as standard sample in reflectance measurements; R∞=Rsample/RMgO (R∞ is the reflectance), k is the molar absorption coefficient, and s is the scattering coefficient. The optical band gap and absorption coefficient of semiconductor oxides [46] can be calculated using Eq. (6):
where α is the linear absorption coefficient of the material, hν is the photon energy, C1 is a proportionality constant, Egap is the optical band gap, and n is a constant associated to different kinds of electronic transitions (n=0.5 for direct allowed, n=2 for indirect allowed, n=1.5 for direct forbidden, and n=3 for indirect forbidden). According to the literature [47–49], trivalent tungstates, such as Al2W3O12, Gd2W3O12, Y2W3O12 and In2W3O12 powders, have an optical absorption spectrum governed by direct or indirect electronic transitions. In direct electronic transitions, after the electronic absorption process, electrons located in the minimum energy states in the conduction band (CB) return to maximum energy states of the valence band (VB) at the same points in the Brillouin zone [50]. On the other hand, for indirect electronic transitions, the electronic process occurs at distinct points in the Brillouin zone [51]. Based on this information and literature [52], Egap values of In2W3O12 powders were calculated with n=0.5 in Eq. (6). Finally, by using the absolute reflectance function in Eq. (5) with k=2α, the modified Kubelka–Munk equation is described as in Eq. (7):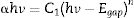
Therefore, by determining the value of F(R∞) from Eq. (7) and plotting a graph of [F(R∞)hν]2 against hν, Egap values were calculated for all powders by extrapolating the linear portion of UV–Vis curves.
Figs. 4(a–e) illustrate the UV–Vis spectra of all powders obtained at different pH values and heat-treated at 1073K for 2h. The evolution of Egap as a function of different pH values is illustrated in Fig. 4(f). Insets show the digital photos of each powder.
 pH=2, (b) pH=2.5, (c) pH=3, (d) pH=3.5, and (e) pH=4, (f) evolution of Egap values as a function of different pH values. Insets show the digital photos of each powder.")
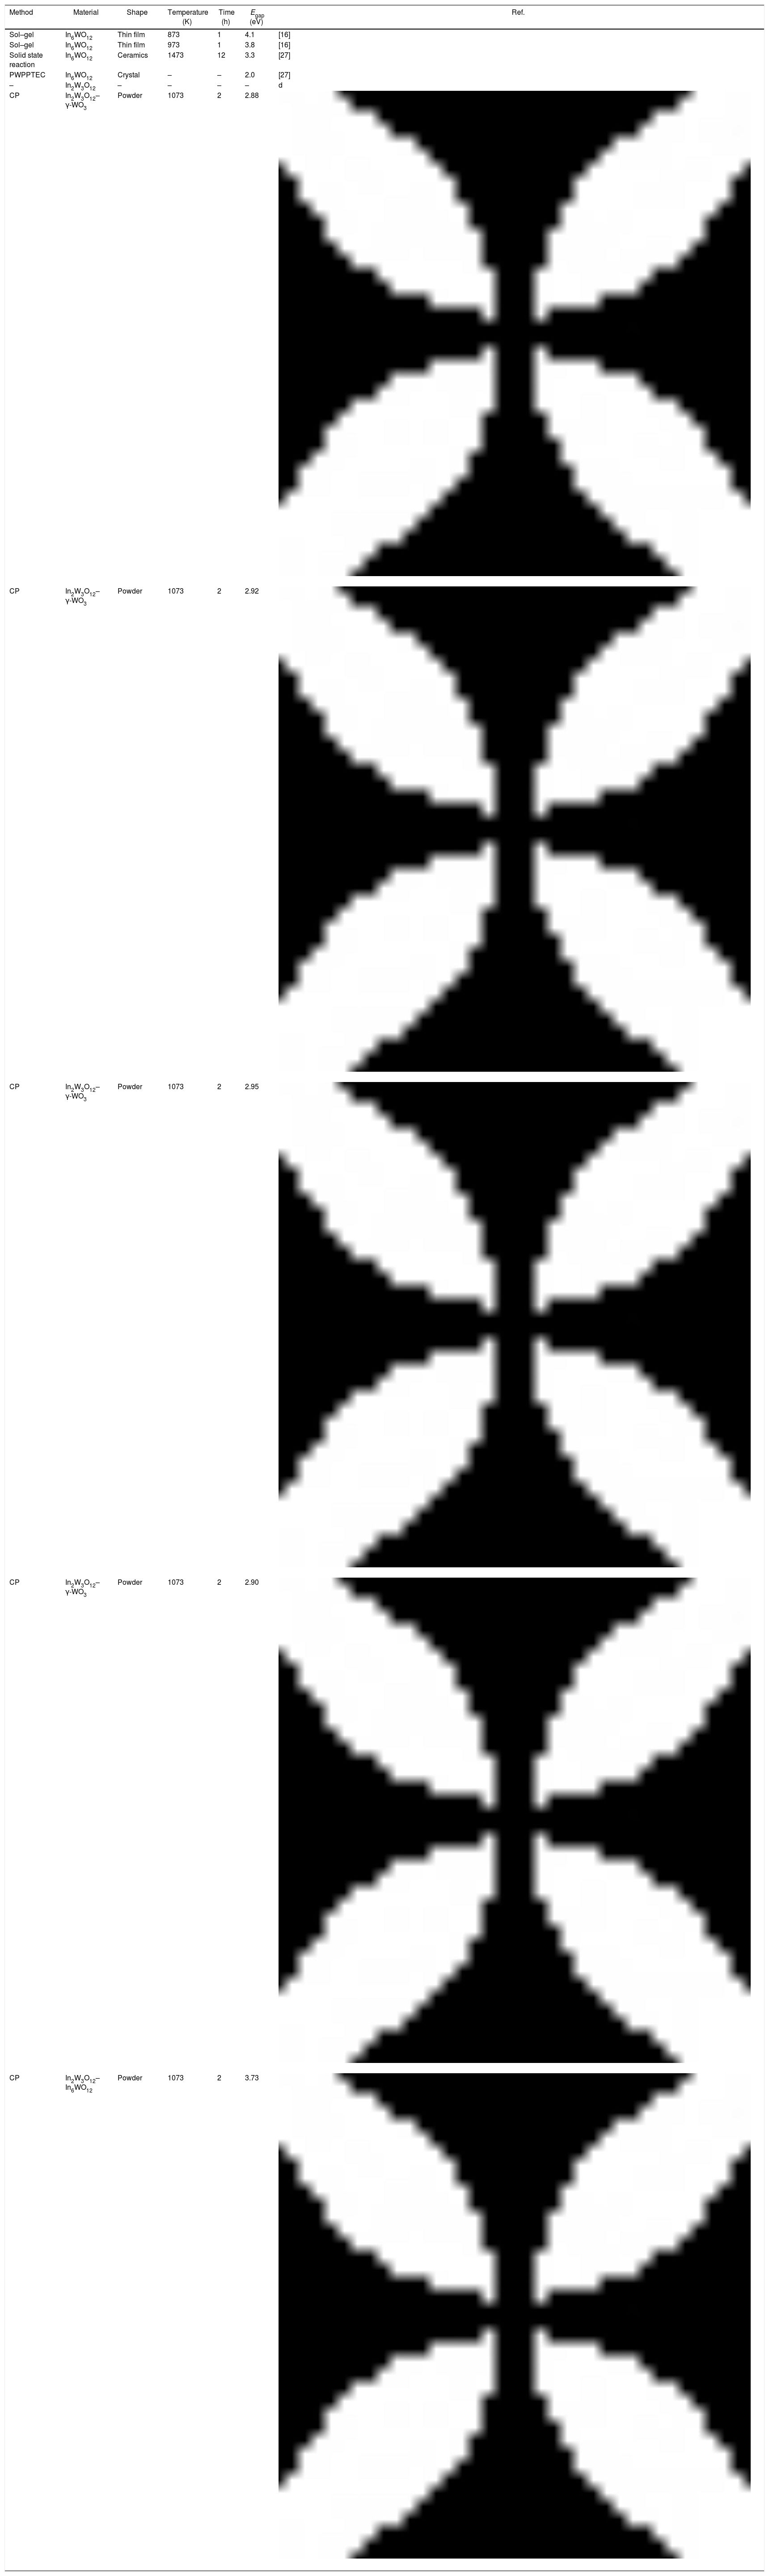
An important point to be considered is that there is a slight increase of Egap values with the increase of pH condition for the powders heat treated at 1073K for 2h. This behavior is caused by the reduction of intermediary energy levels between the VB and CB. The origin these intermediary energy levels is due to defects arising from modifications in bond lengths and/or distortions in bond angles between O-In_O ([InO6] clusters) or O-W-O bonds ([WO6] clusters), respectively [53]. As identified in Rietveld refinement results (Tables 1a-1d), the increase of pH from 2 to 3.5 promoted a reduction of secondary phase (γ-WO3) in In2W3O12 powders. Therefore, there is a decreasing and reorganization of intermediary energy levels in the band gap arising from γ-WO3, causing an increase of Egap for In2W3O12 powders Fig. 4(a–d). The literature has reported [54,55]Egap values for γ-WO3 phase in the range from 2.6 to 2.8eV [16], while for In6WO12 phase an Egap values of approximately 3.3eV [27] as illustrated in Fig. 4(e, f). This large difference between the Egap values of the In2W3O12–WO3 phases and In2W3O12–In6WO12 phases illustrated in Fig. 4(d, e) suggest that the In6WO12 phase with the rhombohedral structure has a high energy value between the valence band and conduction band with respect to In2W3O12 phase with the monoclinic structure, as presented in Table 2.
Comparative results between Egap values of In2W3O12–In6WO12 powders obtained in this study with those reported in the literature.
| Method | Material | Shape | Temperature (K) | Time (h) | Egap (eV) | Ref. |
|---|---|---|---|---|---|---|
| Sol–gel | In6WO12 | Thin film | 873 | 1 | 4.1 | [16] |
| Sol–gel | In6WO12 | Thin film | 973 | 1 | 3.8 | [16] |
| Solid state reaction | In6WO12 | Ceramics | 1473 | 12 | 3.3 | [27] |
| PWPPTEC | In6WO12 | Crystal | – | – | 2.0 | [27] |
| – | In2W3O12 | – | – | – | – | d |
| CP | In2W3O12–γ-WO3 | Powder | 1073 | 2 | 2.88 | |
| CP | In2W3O12–γ-WO3 | Powder | 1073 | 2 | 2.92 | |
| CP | In2W3O12–γ-WO3 | Powder | 1073 | 2 | 2.95 | |
| CP | In2W3O12–γ-WO3 | Powder | 1073 | 2 | 2.90 | |
| CP | In2W3O12–In6WO12 | Powder | 1073 | 2 | 3.73 |

The results presented in this table indicate a highest Egap value (3.73eV) can be attributed to the synergic effect of intermediary energy levels arising from both In2W3O12 and In6WO12 phases (Fig. 4(e, f)). The Egap values obtained in our study are in good agreement with those previously published in the literature [16,27]. Therefore, we propose that this behavior is promoted owing to the simultaneous presence of these In2W3O12 and In6WO12 complex phases and a change in the color of the powder from the light-green present in this phase mixture (In2W3O12 and γ-WO3) to white (inset Fig. 4(f)), which demonstrates a high reflectance and promotes a significant increase in the Egap values.
ConclusionsIn summary, In2W3O12–In6WO12 powders were synthesized by the co-precipitation method at 363K for 1h with different pH values (from 2 to 4) and heat treated at 1073K for 2h. The pH pre-adjustment was not able to produce phase-pure In2W3O12 powders. According to XRD patterns and Rietveld refinement result, In2W3O12 powders formed with pH ranging from 2 to 3.5 exhibited the existence of secondary phase related to γ-WO3 powders. On the other hand, the synthesis performed with pH at 4 resulted in crystalline powders composed of a mixture of In2W3O12 and In6WO12 phases. In our systematic study, the results suggest that employing the methodology with pH pre-adjustment to obtain the monophasic In2W3O12 powder is possibly found between (pH 3.5 and 4.0). The modifications in bond lengths and/or distortions in bond angles of octahedral [InO6] clusters (In2W3O12), octahedral [WO6] clusters (γ-WO3), and both octahedral [InO6]/[WO6] clusters (In6WO12) was identified by Rietveld refinement. A slight rise of Egap values were identified with the increase of pH condition for the powders heat treated at 1073K for 2h. This phenomenon was related to decreasing and reorganization of intermediary energy levels in the band gap, as a consequence of the reduction of γ-WO3 in In2W3O12 powders (pH ranging from 2 to 3.5). The combination of intermediary energy levels arising from In2W3O12 and In6WO12 phases resulted in the highest Egap (at around 3.73eV).
The authors acknowledge the financial support of the Brazilian research financing institutions: CNPq (479644/2012-8 and 304531/2013-8), FAPESP (2012/14004-5 and 2013/07296-2), and CAPES-PNPD (1268069).
The following are the supplementary data to this article:

