


Iso-conversional study is the model free approach which is applied to the crystallization kinetics, to estimate kinetic parameters of crystallization at a given conversion fraction (α). In this paper, we have applied two important Iso-conversional methods namely Kissinger–Akahira–Sunose (KAS) method and Friedman to study the variation of activation energy Ec and Avrami exponent, n, with the conversion fraction (α). These methods showed that the activation energy of crystallization is not constant but varies with the degree of conversion which suggests that the examined glasses follow multi-step kinetics during thermally activated crystallization.
El estudio de isoconversión es el enfoque sin modelo que se aplica a la cristalización. cinética, para estimar los parámetros cinéticos de cristalización en una fracción de conversión dada (α). En este artículo, hemos aplicado dos métodos importantes de conversión iso: Método Kissinger – Akahira – Sunose (KAS) y Friedman para estudiar la variación de la activación Energía Ec y exponente de Avrami, n, con la fracción de conversión (α). Estos métodos demostró que la energía de activación de la cristalización no es constante sino que varía con el grado de conversión que sugiere que las gafas examinadas siguen una cinética de varios pasos durante la cristalización activada térmicamente.
Differential scanning calorimetry (DSC) is one of the most frequently used techniques for study of kinetics of solid state phase transition [1,2]. Two modes, isothermal and non isothermal are generally employed for data collection. The non isothermal method involves heating or cooling of the sample at a constant rate to a temperature well beyond the reaction temperature. This avoids the experimental problems associated with the isothermal method. In some cases one non-isothermal measurement can give as much information as a series of isothermal measurements and therefore offers a much more efficient data collection. For this reason, many methods for the analysis of non-isothermal data have been proposed [3].
Countless rate measurements of numerous kinds have shown to follow Arrhenius equation. To obtain the Arrhenius parameters, the non-isothermal data is compulsorily fit to a hypothetical reaction model. Unfortunately, in a non isothermal experiment, temperature T, and conversion fraction α vary simultaneously, therefore the model fitting approach is generally not able to achieve separation between the temperature dependence of rate constant, k(T), and the reaction model f(α). Consequently almost any f(α) can satisfactorily fit data at the cost of drastic variations in the Arrhenius parameters, which compensate for the difference between the assumed form of f(α) and true but unknown reaction model. For this reason, the model-fitting methods tend to produce highly uncertain values of Arrhenius parameters [4,5,21].
If the decomposition involves several steps with different activation energies, the contributions of these steps to the overall decomposing rate measured in thermal analysis experiment will vary with both temperature and the extent of conversion. This means that the effective activation energy determined from thermal analysis experiments will also vary with these two variables. On the other hand, iso-conversional methods [6–14,22] calculate E at progressive degrees of conversion (α) without any modelistic assumptions. Chalcogens or Pseudo-Chalcogens glassy alloys has been used in optical phase change memory [15,16] technology recently, as the refractive index of these materials is found to be quite different in amorphous and crystalline phases, therefore these have different values of reflectivity in amorphous and crystalline phases. Hence information (0&1) can be detected by this change in reflectivity. In phase change memory technology a high power laser beam is used to melt the crystalline mark (on the film of phase change material), on subsequent cooling which results in amorphous spot (writing). Another low power laser pulse is used to heat amorphous spot to convert it in to crystalline spot (erasing). For reading a continuous laser beam is made to scan the surface of the material film and a reflectivity profile is recorded. Amorphous spot shows a drop in reflectivity which is detected a signal modulation. Thus we can determine whether the spot is bit 0 or 1 (amorphous or crystalline). Certainly crystallization kinetics parameter study is the major concern before using the material for such applications. Behavior of Sn as additive in Chalcogenide glasses have not been well understood although attempted by several workers [17,18]. Kristy and Anderson [19] have demonstrated very important role of Sn in phase change memory devices.
Theoretical basisThe differential equation generally used to describe solid state transformation reaction [11,20] is:
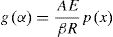
here k(T) is rate constant of the reaction, f(α) is the reaction model and α is the extent of conversion or fraction transformed that depends upon the measured value of extensive variable x as follows: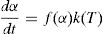

Generally, in thermally activated process, an Arrhenius type of temperature dependence of rate constant is assumed, i.e.
here A is the pre exponential factor, E is the activation energy, T is absolute temperature and R is the gas constant.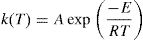
Methods of kinetic analysis are divided into five categories:
(a) Integral methods. (b) Differential methods. (c) Difference-Differential methods. (d) Methods spatially applicable to initial rates and (e) Methods for Nonlinear heating rates.
Mainly, methods (a) and (b) are used widely by a large scientific community. For a constant heating rate experiment, instantaneous temperature is given by:

here To is the initial temperature when heating starts and β is the heating rate. Therefore:
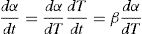
Substituting (4) and (3) in (1) and separating the variables, we have:
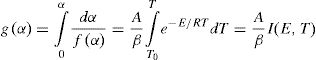
Representing, IE,T≈S(T)−STo
Here:
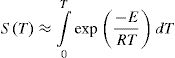
If the process rate is negligible between the limits 0 and To, then, we can neglect S (To). Consequently, we can choose lower limit in integral shown by Eq. (5) as zero safely.
Let E/RT=x, Eq. (5) on integration can be written as:
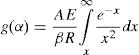
or
The exponential integral p(x) has no analytical solution, but may be approximated to many functions or can be evaluated numerically.
The Ozawa, Flynn and Wall method is an iso-conversional method that utilizes Doyle's [14,23] linear approximation for log p(x):

Thus with the aid of Eq. (8), Eq. (7) leads to:
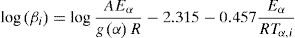
A plot of log βi versus 1/Tα,i at a particular α gives the value of Eα, from the slope, for that particular α without regard to model. Vyazovkin and dollimore [5] have used Senam Yang [24] approximation. Flynn [25] has discussed several approximation of px.
Kissinger–Akahira–Sunose (KAS) methodKissinger–Akahira–Sunose method (KAS) [10,12,28,29] is obtained using p(x)≅e−x/x2, which is valid for 20≤x≤50:
Fried man method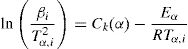
Differential technique to determine the kinetic parameters for non isothermal experiments was developed by Friedman. In his treatment, Fried man took the natural logarithm of Eq. (4) for a particular α and obtained:
Experimental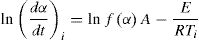
Alloys of Se–Te–Sn in glassy form were prepared by standard melt-quench technique. Firstly, appropriate atomic percentages of 5N pure elements (99.999%) were weighted using an electronic balance and then were sealed in the evacuated (∼10−5Torr) quartz ampoules. The sealed ampoules were placed inside the furnace and temperature was raised to 800°C in the step of 3–4Kmin−1. This constant temperature of furnace was maintained up to 15h. Ampoules were frequently rocked to homogenize the melt. After 15h ampoules were taken out of the furnace and rapidly quenched in ice cold water. Quenched ampoules were broken to get ingots. To establish the samples, XRD scans were taken. No sharp peak was present in scans rather hallows were present which confirms that prepared samples are amorphous in nature. DSC (Simdazu, Japan) was used for study of crystallization kinetics. 5–8mg of each sample was taken to run the DSC scan at the heating rates of 5, 10, 15 and 20K/min. Distinct endothermic and exothermic peaks were obtained in DSC thermograms confirming the homogeneous nature of prepared samples.
Results and discussionIn condensed matter physics glass to crystal phase transition study is of scientific and technological importance and is characterized in terms of parameters of solid state reaction like activation energy of crystallization Ec, Avrami exponent n, pre-exponential factor A, etc. As indicated in recent papers, solid state phase transformation process is generally a complex one, theoretical methods so developed give a gross or approximate value of these parameters and do not present a step picture. In general these parameters vary with extent of crystallization. DSC scans of the prepared samples were taken at 4 different heating rates (5, 10, 15 and 20K/min). Fig. 1 represents DSC scans of Se76Te20Sn4 alloy at 4 different heating rates (5, 10, 15 and 20K/min). However, DSC scans for all the prepared samples at heating 20K/min have been published elsewhere [30]. For a given uniform heating rate, all the samples show a single glass transition endothermic peak at the temperature, Tg and a single exothermic crystallization peak at Tc, which insures homogeneity of the as prepared samples. In no-isothermal mode of measurement by DSC, prepared samples are reheated at constant heating rate. Obtained Scan of a glassy material consists of a peak above the temperature (or time) axis. This peak consists of a differential extent ΔT along the temperature axis, which is the difference between onset temperature and final temperature of crystallization. Therefore fraction of crystallized material (or extent of conversion), α, at any temperature T is obtained by following Kaur et al. [31]:


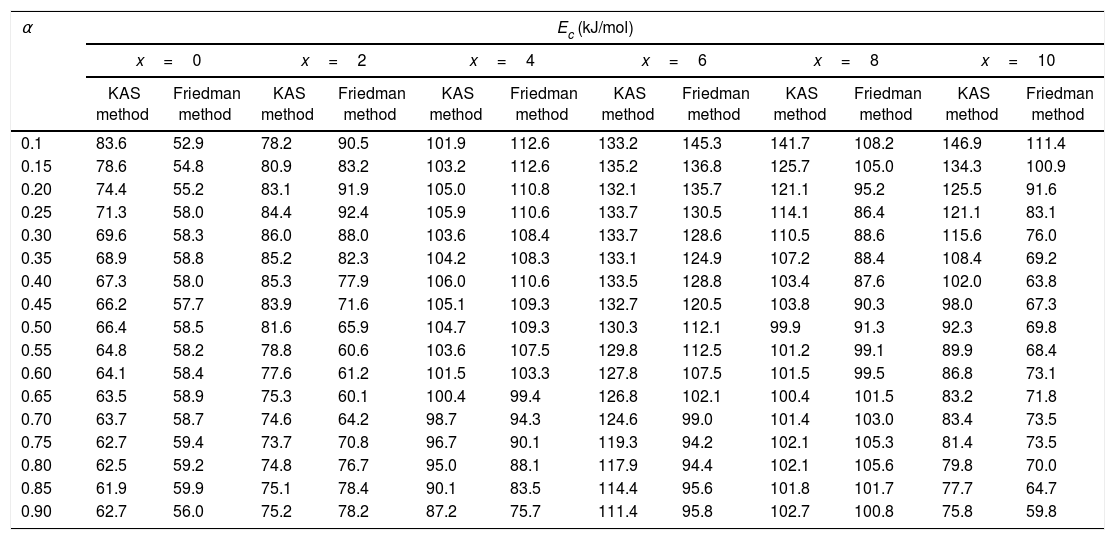
here A is the total area of exothermic peak and AT is the partial area at any temperature (or at any extent of crystallization α). The α versus T curves were plotted for each samples at the heating rates 5, 10, 15 and 20K/min. One of the representatives plots for the sample Se76Te20Sn4 consisting of α versus T curves at various heating rates is shown in Fig. 2. The α versus T data at fixed heating rate was differentiated using Origin 8.0 software to obtain dα/dT at various T and hence at various α. Consequently, one is able to plot (dα/dT) versus α curves for the prepared samples. One of such plot for glassy Se76Te20Sn4 alloy at the heating rate10K/min is shown in Fig. 3. The values of Ec were obtained using KAS and Friedman iso-conversional methods, for all the prepared samples. It is noticed that Ec varies with the extent of conversion. Table 2 indicates that two methods are in good agreement except uncorrelated values of Ec in last and beginning of the transformation (crystallization) which is due to instability and inaccuracy in the determination of crystallized fraction, α in the initial and final part of the crystallization and hence in the determination of dα/dT. Even in a single step reaction, the rate of reaction (which depends upon activation energy) depends on the viscosity of the medium which in turn depends up on temperature. Therefore, activation energy depends up on the temperature and or/on extent of conversion. In case of solid state reaction strong intermolecular interaction exist in the media which affects even the single step of a reaction greatly, therefore its kinetics depends up on the properties of the medium and the energy barrier varies (or activation energy) as these properties change with temperature and/or extent of conversion. Beside this a single reaction step may be made further complicated by additional step for example by diffusion. In such a case now kinetics of overall reaction is involve two energy barriers. Activation energy of crystallization is the weighted sum of effective activation energies of two process namely, nucleation and growth. As the reaction proceed nucleation saturates and hence over all activation energy decreases. On the other hand decrease can also explain on the basis of shielding effect. From Table 1 it is clear that Ec varies with the extent of concentration of Sn as well, maximum value of activation energy is obtained for x=6at% by both methods are in good agreement in the middle part of crystallization process (Fig. 4).

 versus α curve for Se76Te20Sn4 alloy at the heating rate 10K/min.")
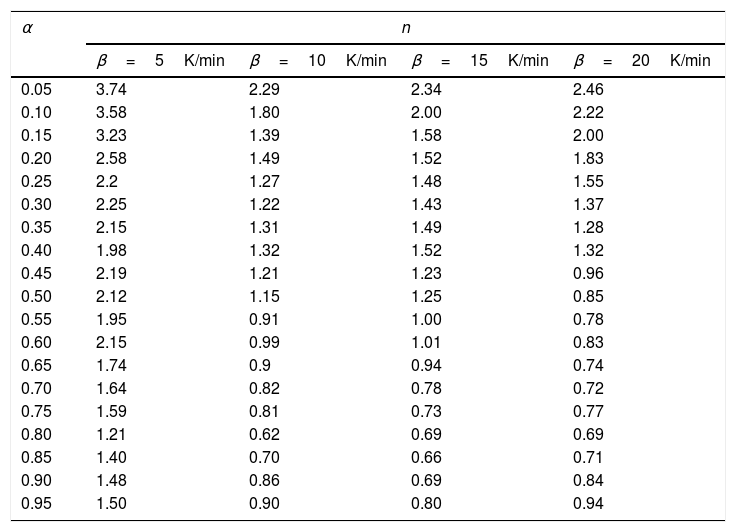
Variation of Avrami exponent with extent of crystallization for Se78Te20Sn2 alloy.
| α | n | |||
|---|---|---|---|---|
| β=5K/min | β=10K/min | β=15K/min | β=20K/min | |
| 0.05 | 3.74 | 2.29 | 2.34 | 2.46 |
| 0.10 | 3.58 | 1.80 | 2.00 | 2.22 |
| 0.15 | 3.23 | 1.39 | 1.58 | 2.00 |
| 0.20 | 2.58 | 1.49 | 1.52 | 1.83 |
| 0.25 | 2.2 | 1.27 | 1.48 | 1.55 |
| 0.30 | 2.25 | 1.22 | 1.43 | 1.37 |
| 0.35 | 2.15 | 1.31 | 1.49 | 1.28 |
| 0.40 | 1.98 | 1.32 | 1.52 | 1.32 |
| 0.45 | 2.19 | 1.21 | 1.23 | 0.96 |
| 0.50 | 2.12 | 1.15 | 1.25 | 0.85 |
| 0.55 | 1.95 | 0.91 | 1.00 | 0.78 |
| 0.60 | 2.15 | 0.99 | 1.01 | 0.83 |
| 0.65 | 1.74 | 0.9 | 0.94 | 0.74 |
| 0.70 | 1.64 | 0.82 | 0.78 | 0.72 |
| 0.75 | 1.59 | 0.81 | 0.73 | 0.77 |
| 0.80 | 1.21 | 0.62 | 0.69 | 0.69 |
| 0.85 | 1.40 | 0.70 | 0.66 | 0.71 |
| 0.90 | 1.48 | 0.86 | 0.69 | 0.84 |
| 0.95 | 1.50 | 0.90 | 0.80 | 0.94 |
Activation energy of crystallization evaluated at various extent of crystallization, by KAS and Friedman methods for Se80−xTe20Snx (0≤x≤10) alloys.
| α | Ec (kJ/mol) | |||||||||||
|---|---|---|---|---|---|---|---|---|---|---|---|---|
| x=0 | x=2 | x=4 | x=6 | x=8 | x=10 | |||||||
| KAS method | Friedman method | KAS method | Friedman method | KAS method | Friedman method | KAS method | Friedman method | KAS method | Friedman method | KAS method | Friedman method | |
| 0.1 | 83.6 | 52.9 | 78.2 | 90.5 | 101.9 | 112.6 | 133.2 | 145.3 | 141.7 | 108.2 | 146.9 | 111.4 |
| 0.15 | 78.6 | 54.8 | 80.9 | 83.2 | 103.2 | 112.6 | 135.2 | 136.8 | 125.7 | 105.0 | 134.3 | 100.9 |
| 0.20 | 74.4 | 55.2 | 83.1 | 91.9 | 105.0 | 110.8 | 132.1 | 135.7 | 121.1 | 95.2 | 125.5 | 91.6 |
| 0.25 | 71.3 | 58.0 | 84.4 | 92.4 | 105.9 | 110.6 | 133.7 | 130.5 | 114.1 | 86.4 | 121.1 | 83.1 |
| 0.30 | 69.6 | 58.3 | 86.0 | 88.0 | 103.6 | 108.4 | 133.7 | 128.6 | 110.5 | 88.6 | 115.6 | 76.0 |
| 0.35 | 68.9 | 58.8 | 85.2 | 82.3 | 104.2 | 108.3 | 133.1 | 124.9 | 107.2 | 88.4 | 108.4 | 69.2 |
| 0.40 | 67.3 | 58.0 | 85.3 | 77.9 | 106.0 | 110.6 | 133.5 | 128.8 | 103.4 | 87.6 | 102.0 | 63.8 |
| 0.45 | 66.2 | 57.7 | 83.9 | 71.6 | 105.1 | 109.3 | 132.7 | 120.5 | 103.8 | 90.3 | 98.0 | 67.3 |
| 0.50 | 66.4 | 58.5 | 81.6 | 65.9 | 104.7 | 109.3 | 130.3 | 112.1 | 99.9 | 91.3 | 92.3 | 69.8 |
| 0.55 | 64.8 | 58.2 | 78.8 | 60.6 | 103.6 | 107.5 | 129.8 | 112.5 | 101.2 | 99.1 | 89.9 | 68.4 |
| 0.60 | 64.1 | 58.4 | 77.6 | 61.2 | 101.5 | 103.3 | 127.8 | 107.5 | 101.5 | 99.5 | 86.8 | 73.1 |
| 0.65 | 63.5 | 58.9 | 75.3 | 60.1 | 100.4 | 99.4 | 126.8 | 102.1 | 100.4 | 101.5 | 83.2 | 71.8 |
| 0.70 | 63.7 | 58.7 | 74.6 | 64.2 | 98.7 | 94.3 | 124.6 | 99.0 | 101.4 | 103.0 | 83.4 | 73.5 |
| 0.75 | 62.7 | 59.4 | 73.7 | 70.8 | 96.7 | 90.1 | 119.3 | 94.2 | 102.1 | 105.3 | 81.4 | 73.5 |
| 0.80 | 62.5 | 59.2 | 74.8 | 76.7 | 95.0 | 88.1 | 117.9 | 94.4 | 102.1 | 105.6 | 79.8 | 70.0 |
| 0.85 | 61.9 | 59.9 | 75.1 | 78.4 | 90.1 | 83.5 | 114.4 | 95.6 | 101.8 | 101.7 | 77.7 | 64.7 |
| 0.90 | 62.7 | 56.0 | 75.2 | 78.2 | 87.2 | 75.7 | 111.4 | 95.8 | 102.7 | 100.8 | 75.8 | 59.8 |
 with extent of crystallization for Se80−xTe20Snx (0≤x≤10) alloys.")
The local value of Avrami exponent at each step of crystallization was obtained using Lu method for non isothermal experiments [26]. According to this method:
The values of n(α) against α are plotted in Fig. 5 for the sample Se78Te20Sn2 at 5, 10, 15, 20K/min. It is noticed from this figure that n(α) decreases significantly with extent of conversion. Similar results were obtained for other samples (not shown here).

As in the experimental part, no specific heat treatment was given before the thermal analysis runs to nucleate the sample. Therefore, n will be equal to m+1, where m and n are integer or half-integer numbers. Mahadevan et al. [27] have shown that n may be 1, 2, 3 and 4 depending up on the growth mechanism and dimensionality of crystal growth n=4, volume nucleation, three dimensional growth; n=3: volume nucleation, two dimensional growth, n=1: surface nucleation, one dimensional growth from surface to inside.
ConclusionCrystallization kinetics of Se80−xTe20Snx (0≤x≤10) alloys is examined by two most significant iso-conversional methods, namely KAS and Friedman methods. Activation energy is found to vary significantly with heating rates and extent of crystallization. Avrami exponent is also found to vary noticeably with the extent of conversion which shows that glass to crystal transition is not a single step process but involves several processes occurring simultaneously.
Conflict of InterestAuthors declare no conflict of interest
HK is thankful to his university for providing grant through DST-Purse programme-(5050), UGC-CAS and UPE, R.A. is thankful to CSIR for JRF.

