


Se analiza la variabilidad de la precipitación estacional en sus valores medios y extremos para varias regiones de Argentina al norte de 39º S, empleando series mensuales de lluvia que se extienden desde 1860 hasta 2006. Las estaciones seleccionadas pueden considerarse representativas de diferentes regiones climáticas del país. El análisis se focaliza en la distribución de la lluvia, la tendencia estacional, los cambios en la varianza y los valores extremos, a fin de establecer la magnitud de la variabilidad climática estacional de las lluvias en una perspectiva histórica en el centro de Argentina. Los valores extremos se calcularon para una ventana móvil de 40 años definiendo estos valores para los niveles mayores/menores a los percentiles 80/20 (p = 0.80/0.20; 0.90/0.10; 0.95/0.05) de la distribución teórica gamma, seleccionada entre otras cinco distribuciones. Los parámetros de escala y forma de la distribución se calcularon empleando la estimación de máxima verosimilitud (MLE) y el método de remuestreo (bootstraping) para 1000 repeticiones. Las tendencias estacionales se calcularon para cada ventana, al igual que su significación estadística. El uso de una ventana móvil permitió establecer el periodo de cuatro décadas en el cual se verificó el mayor valor de la tendencia, ya sea positiva o negativa. De los resultados se desprende que hubo desplazamientos en las distribuciones de lluvia estacional así como cambios en los valores de retorno (RV) que se calcularon para una ocurrencia de una vez cada 5, 10 y 20 años. En general, las lluvias extremas de verano se incrementaron para toda la región. Los valores extremos húmedo/seco (W/D) de la estación estival correspondientes a los percentiles 90/10 para W/D, respectivamente, sufrieron incrementos significativos de acuerdo con la zona geográfica y el periodo. Sin embargo, se menciona como rasgo particular del verano la existencia de un periodo común a todas las estaciones con tendencias positivas, que se inicia con la ventana 1921-1960 y permanece hasta la última ventana analizada: 1967-2006. Este comportamiento no se observa en la estación de invierno para el oeste y centro de Argentina excepto en la zona representada por Bahía Blanca, para la cual el extremo D (del 10%) se incrementó a lo largo de todo el periodo de estudio.
The variability in seasonal mean and extreme precipitation is analyzed for several regions of Argentina to the north of 39º S, using long-term monthly time series data which expand from 1860 to 2006. The selected locations can be considered as representative of different climatic regions. This work focuses on the analysis of monthly rainfall distribution, significant seasonal trends, changes in variance and extreme monthly values, in order to establish the magnitude of the seasonal climatic rainfall variability through time for central Argentina. A 40-yr moving window was employed in order to analyze seasonal variability of rainfall extremes. Extremes were computed for different probability levels of a theoretical distribution function over/below the 80th/20th percentile. The gamma distribution was selected among five other theoretical distributions, and the scale and shape parameters were computed using the maximum likelihood estimation (MLE) and the bootstrap method for 1000 resample data sets, as well. Trend analysis was performed for each window on winter and summer means and tested for significance. The use of a moving window allowed detecting the window of maximum absolute values for the trends. Research results show significant temporal shifts in seasonal rainfall distribution and return values (RV) that were computed for different frequencies (once every five, 10 and 20 years). Generally, summer precipitation extremes have become wetter for the whole region. Rainfall amounts for summer wet/dry extremes (W/D) corresponding to the 90th (for W) and 10th (for D) percentiles were subjected to significant increase, but depending on the geographical area this effect spreads slightly differently over records of years. A common-for-all-stations period of such summer increase trend in extreme values spans from the window 1921-1960 to the last window analyzed: 1967-2006. This behavior was not observed for north and west Argentina during winter, except for the region represented by Bahía Blanca, where the 10% D extreme has increased throughout the study period.
Changes in weather and climate extremes are having an impact on socioeconomic and natural systems, and future changes associated with continuous warming will present additional challenges. Recent studies have focused on a suite of climate change indexes that primarily require daily observations (Alexander et al., 2006). Unfortunately, daily temperature and precipitation data are not readily available for large portions of the world. As mentioned in Groisman et al. (1999) and Frich et al. (2002) there was almost no such data available for most of Central and South America.
Precipitation is a key climate variable, as it affects both human economies and agriculture in different areas of the globe. Trends in precipitation series were observed on both global and hemispheric scales during the 20th century, which may influence future water supply (Easterling et al., 2000; Haylock et al., 2005). A strong positive trend in precipitation during the second half of the 20th century characterized the central zone of Argentina as presented in Castañeda and Barros (1994). The climate variability of the region was studied at various temporal scales, from a decadal-scale of spring/summer precipitation to interannual variability associated with the El Niño-Southern Oscillation (ENSO) phenomenon as reported by Vargas et al. (1999), Grimm et al. (2000), and Rusticucci and Vargas (2002). In southern Brazil and northern Argentina, some studies (Camilloni, 2005a, b) have detected increased rainfall and river discharge in the region since the mid-1970s. These increases are linked to changes in the regional circulation, that is, a southward displacement of the subtropical Atlantic high. Other studies related to extreme monthly precipitations in the Pampean region, as in Scian et al. (2006), were restricted only to events under no-ENSO conditions and yielded interesting results over the anomalous large-scale circulation patterns associated particularly to the dry season rainfall extremes (May to September).
Recent studies have shown that seasonal precipitation cycle over the South American continent is not only modulated by ENSO, but by the Pacific Decadal Oscillation (PDO) (Andreoli and Kayano, 2005; García and Kayano, 2006 ; Kayano and Andreoli, 2007). Silva et al. (2011) focused on the impact of ENSO events during positive PDO(+) and negative PDO(-) phases on transport of moisture and extratropical cyclonic properties in austral summer over South America. These authors suggest that changes in tropical/extratropical circulation anomalies over South America after 1976 seem to be associated with an increase in the frequency and intensity of El Niño (EN) events. For the EN events during PDO(+), positive anomalies of rainfall over most of southeastern South America (SESA) are observed. Barros et al. (2008) showed recently that precipitation trends in the southern region of subtropical Argentina (37º S, 64º W) were originated in neutral ENSO events and were related to the trends of the first two sea level pressure (SLP) leading modes.
Data employed in the present work covers part of the 19th century, the 20th century and the first decade of 21st century for central Argentina. How such long-term seasonal and spatial changes occurred in the past, underlines the complex form that hydro-climatic variability might have in the future. A more profound understanding of the variability of extreme precipitation may help improve climate models and interpret their results. One way to address this question is to analyze past precipitation variability.
Climate precipitation extremes are discussed in this work following a monthly time scale of seasonal accumulated values. We have adopted the Intergovenmental Panel on Climate Change IPCC Working Group I definition of climate change (IPCC, 2007) as either a variation in the mean state of climate or its variability with statistical significance that persists for an extended period (typically decades or longer). This change can be caused by natural internal processes or external forces or by persistent anthropogenic changes in the composition of the atmosphere or land use. The IPCC, in its fourth report (IPCC, 2007) indicated that the impact of climate change will be observed through changes in extreme events. Impact attributed to climate change and global warming registered in some zones in Argentina has been documented and submitted in national and international meetings. One of the most prominent aspects as reported in Barros (2005) is the increasing trend of precipitation and intense storms frequency.
This work aims to establish a measure of the changes experienced in seasonal precipitation extremes from the second half of the 19th Century to recent times, as this variation is likely to increase flood and drought risk. Besides, we intend to detect whether there are modifications in their statistical characteristics as well as changes in the variance of monthly precipitation, within a retrospective context for central Argentine. We analyze in detail extreme values defined through a theoretical distribution function over/below the 90th/10th percentile, and variability of monthly rainfall extremes among stations.
Because of irregular rainfall distribution along the country, we present here the analysis on the study of precipitation extremes variability for the two main seasons of the year: winter (Jun-Jul-Aug) and summer (Dec-Jan-Feb). Hence, it is important to analyze precipitation behavior for the most extended period of available instrumental records. In particular, a realistic and reliable assessment of historical climate trends and variability is possible with long-term, homogeneous time series of climate data. Changes in instruments and relocation have made the observations easier and more accurate, but they may have also created artificial biases in long-term time series. Analyzing only the changes in the mean is not enough to estimate potential changes in the behavior of extreme variables in a scenario of warming climate (Katz and Brown, 1992). In fact, a change in a climate variable will also result in a change in the shape of its distribution. It is thus clear that a localized study per season and per variable (extreme dry and extreme wet) is mandatory and that the changes that occurred in monthly mean and standard deviation are associated to different types of change in the occurrence of extremes.
So far, no studies have dealt with changes in rainfall series as long as those hereby shown, available in Argentina, pursuing analysis on seasonal precipitation extremes above/below the 80th/20th, 90th/10th, and 95th/5th percentiles. The selected stations are located in regions of Argentina with different climate.
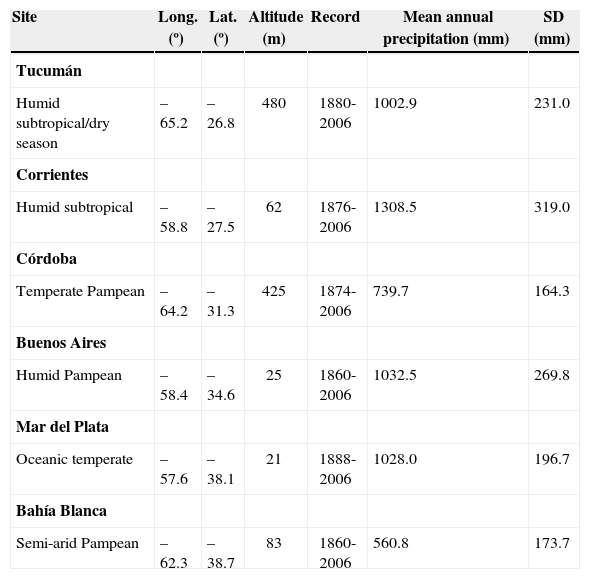
2Data and methods2.1DataData of monthly total precipitation was obtained from the archives of the Servicio Meteorólogico Nacional (SMN). The time series were chosen both for their record length and the reliability of observations, and were checked for missing data before the analysis. They were selected from among other long-term rainfall data available in the archives of the SMN, because these six locations belong to the synoptic type of meteorological stations ensuring high-quality and homogeneity. The series were pre-processed to guarantee temporal consistence and homogeneous records. In two of the six stations, data required treatment. We will mention the case of Tucumán, whose data were checked with meteorological records of the nearest location, Famailla, a station that belongs to the Instituto Nacional de Tecnología Agropecuaria (INTA), located 35 km apart. The other station, Corrientes, was compared with two close stations (Resistencia and Goya, at a distance of about 22 km), from 1875 to 2000. In both cases, regression methods (Vincent and Mekis, 2004) provide adjusted data from the required periods and were used in order to fill monthly missing data. Missing data do not surpass 5% of the record length. The time series employed in this work correspond to the locations listed in Table I. The monthly rainfall series recorded in central Argentina from north to south were: Tucumán (TUC), spanning from 1880 to 2006; Corrientes (CRT), spanning from 1876 to 2006; Córdoba (CBA), spanning from 1873 to 2006; Buenos Aires (BUE), spanning from 1861 to 2006; Mar del Plata (MDQ), spanning from 1888 to 2006; and Bahía Blanca (BAH), spanning from 1860 to 2006.
Name, climate, location (longitude and latitude), altitude, length of data records, mean annual precipitation and standard deviation of stations employed in the analysis.
| Site | Long. (º) | Lat. (º) | Altitude (m) | Record | Mean annual precipitation (mm) | SD (mm) |
|---|---|---|---|---|---|---|
| Tucumán | ||||||
| Humid subtropical/dry season | –65.2 | –26.8 | 480 | 1880-2006 | 1002.9 | 231.0 |
| Corrientes | ||||||
| Humid subtropical | –58.8 | –27.5 | 62 | 1876-2006 | 1308.5 | 319.0 |
| Córdoba | ||||||
| Temperate Pampean | –64.2 | –31.3 | 425 | 1874-2006 | 739.7 | 164.3 |
| Buenos Aires | ||||||
| Humid Pampean | –58.4 | –34.6 | 25 | 1860-2006 | 1032.5 | 269.8 |
| Mar del Plata | ||||||
| Oceanic temperate | –57.6 | –38.1 | 21 | 1888-2006 | 1028.0 | 196.7 |
| Bahía Blanca | ||||||
| Semi-arid Pampean | –62.3 | –38.7 | 83 | 1860-2006 | 560.8 | 173.7 |
The same records were recently used by Pierini et al. (2011) in order to perform a detrended fluctuation analysis and by Telesca et al. (2012), among others, for investigating the temporal variation of the scaling behavior in rainfall data.
There are no available rainfall data with similar record length for southern Argentina, the Patagonian region. The map in Figure 1 shows monthly mean precipitation for the stations in the base period 1967-2006. This 40-yr period reflects the behavior of rainfall for the last window analyzed, which expresses the actual behavior. The figure shows that almost all locations present an annual regime with minimum rainfall values for winter months (June, July, August [JJA]) as supported in Prohaska (1976) among others.
2.2Methodology and their locations.")
The analysis of seasonal precipitation (winter [JJA] and summer [December, January, February, DJF]) focuses on the changes produced in extreme dry and wet values along time. Precipitation extremes are typically defined based on the frequency of occurrence (by percentile [e.g., upper 5, 1, 0.1%, etc.] or by return period [e.g., an average occurrence of once every five years, once every 20 years, etc.]) and/or their absolute values (e.g., above 50, 100, 150mm, or more).
We do not use indexes of daily precipitation extremes because no such records exist for such a long period of data. Monthly rainfall series are studied to describe the variability existing among their extreme seasonal values. We do not focus on heavy rainfall.
Precipitation is one of the atmospheric variables whose distribution is non-symmetric and skewed to the right. Its limit on the left is zero since it is physically constrained to be nonnegative. Several fundamental distributions for estimating precipitation amounts can be adopted among which the most commonly used are the normal, lognormal, exponential, gamma and Weibull distributions. The Kolmogorov-Smirnov (K-S) test is used to decide if a sample comes from a hypothesized continuous probability density function (PDF). It is based on the largest vertical difference between the theoretical and empirical cumulative distribution function (CDF). According to the available monthly rainfall data in the present analysis, the most suitable procedure is based on fitting gamma distributions (Thom, 1958; Wilks, 1995). The gamma distribution is an arbitrary but convenient choice to represent variations in precipitation totals (Wilks and Eggleston, 1992). Within the continuous theoretical distributions of probability this function is defined by the PDF:
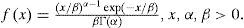
The two distribution parameters are α and β (the shape and scale parameter, respectively) and Γ stands for the gamma function. In the gamma case, α and β parameters control the distribution. A value of α ≤ 1 produces a strong positive slant, whereas for α = 1 it reduces to the exponential distribution (Wilks, 1995). Finally, for α = 3.6, the function resembles the Gaussian distribution. Eq. (1) is characterized by mean µ = α β and variance σ2 = α β 2. The β scale parameter plays the role of stretching or compressing the density function, and then this factor is related to changes in variability. The distribution is skewed to the right, with skewness coefficient given by 2 α–1/2.
In this study, a return period (RP) of five, 10 and 20 years is chosen. The extreme dry or wet rainfall value was computed based on the return value (RV) or percentile. Extreme dry value is evaluated to a probability equal to or less than 20, 10, and 5%, while the extreme wet rainfall is set to the probabilities of exceeding 80, 90, and 95%. Return values for a given year are calculated with the 40-yr period ending that year as can be seen in the figures selected for the 0.1 D and 0.9 W levels.
The rainfall data analysis was carried out using a time window shifting through the series. We selected a length of 40 years for the window after several evaluations on persistent temporal fluctuations (Telesca et al., 2012). These sub-periods guarantee the probability of occurrence of events every 20 years.
When adjusting a theoretical distribution to a finite data sample, the estimate of the parameters presents uncertainties. This has an effect on the calculations of the extreme values with return periods beyond the length of the original time series. To estimate the parameters of the gamma distribution the maximum likelihood estimation (MLE) (Wilks, 1995) and a parametric bootstrap approach with 1000 iterations were used. This method is based on random samples, which are drawn from the fitted gamma distribution (Efron and Tibshirani, 1993; Mooney and Duval, 1993; Efron, 2000; Ledesma, 2008). Confidence interval (CI) is computed applying the bootstrap procedure.
Trends in seasonal precipitation are computed by a simple least squares fit model. The regression coefficient for each 40-yr window gives the change per year. The trend of each sub-period is tested for statistical significance through a non-parametric Mann-Kendall tau test (Sen, 1968) for each station separately. All tests have been performed at a 5% confidence level.
The subsequent analysis for seasonal return values (RV) is based on percentiles, 40-yr mean parameters (α and β) of the gamma distribution and the CI estimation from bootstrapping. We estimate changes in the occurrence of extreme wet and dry years. The confidence interval (CI) for each RV value on all windows is compared against the control confidence interval (CCI), defined for the last window (namely 1967-2006). We established that a change in an RV exists when its CI does not overlap with the CCI; then an increasing or decreasing change relative to CCI is defined.
The general procedure employed for all the series after checking for gamma distribution from the five theoretical distribution parameters mentioned above is:
- 1.
Evaluation of gamma distribution parameters by MLE and 1000 bootstrap resampling using the complete seasonal rainfall series and for each of the 40-yr windows.
- 2.
For each season and 40-yr window compute: (a) RV for extremes conditions (at every five, 10 and 20 years) and confidence interval (CI); (b) linear trend of window rainfall values; and (c) variance.
- 3.
Analyses for each station, season and extreme probability level (W or D), which are the year/years with increasing or decreasing change in RV and the significance of differences.
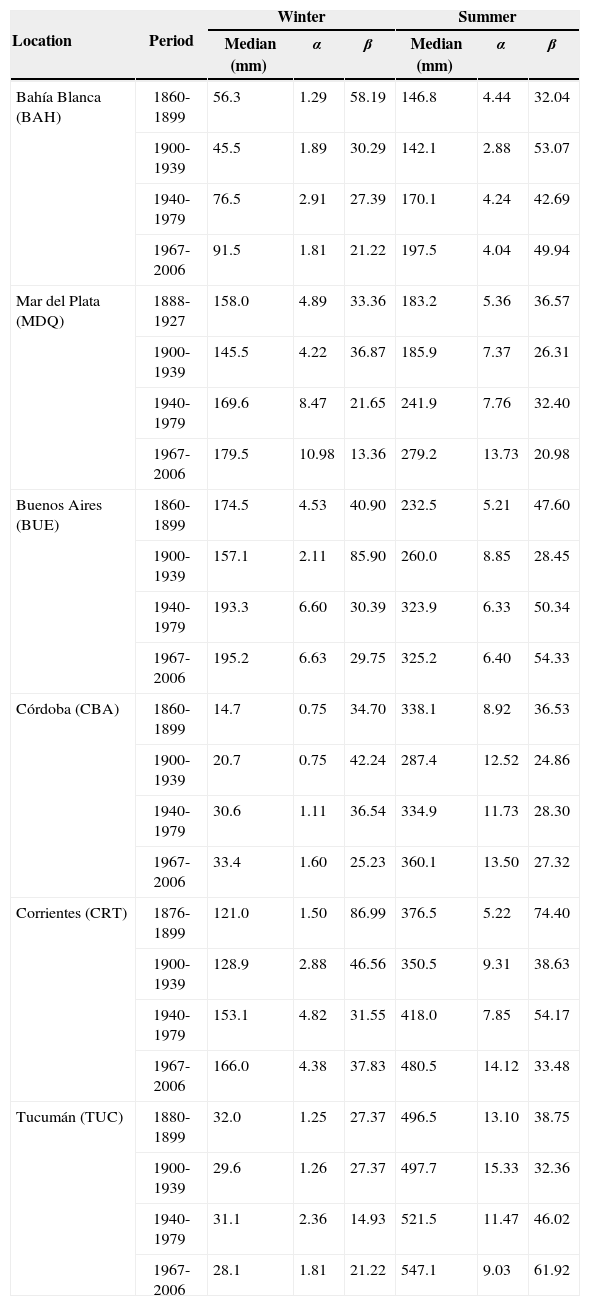
The regional climate for each station selected is different (Cabrera, 1976; Prohaska, 1961). These differences are reflected in the results of rainfall variability and trends analyzed. A summary reproduced in Table II presents a comparison between gamma parameters (α and β) from each location and season as calculated in this study. Values were obtained using the 1000 bootstrap method for selected 40-yr periods. Medians in millimeters are included. Minimum α values correspond to winter season and are observed for Córdoba, where α < 1.0 implies an exponential distribution type. Almost all winter values remain between 1.2 and 5, while for summer α values range from 4 to 15. Differences in seasonal median values among stations respond to rainfall regimes (Hoffmann, 1988). We will show the results, from south to north, starting with Bahía Blanca and ending with Tucumán (as listed in Table I).
Seasonal values of medians, and parameters α and β of the gamma distribution obtained with a 1000 bootstrap method for six rainfall locations over central Argentina. Forty-year periods were arbitrarily selected. Differences in the first period date are due to the starting year of data series.
| Location | Period | Winter | Summer | ||||
|---|---|---|---|---|---|---|---|
| Median (mm) | α | β | Median (mm) | α | β | ||
| Bahía Blanca (BAH) | 1860-1899 | 56.3 | 1.29 | 58.19 | 146.8 | 4.44 | 32.04 |
| 1900-1939 | 45.5 | 1.89 | 30.29 | 142.1 | 2.88 | 53.07 | |
| 1940-1979 | 76.5 | 2.91 | 27.39 | 170.1 | 4.24 | 42.69 | |
| 1967-2006 | 91.5 | 1.81 | 21.22 | 197.5 | 4.04 | 49.94 | |
| Mar del Plata (MDQ) | 1888-1927 | 158.0 | 4.89 | 33.36 | 183.2 | 5.36 | 36.57 |
| 1900-1939 | 145.5 | 4.22 | 36.87 | 185.9 | 7.37 | 26.31 | |
| 1940-1979 | 169.6 | 8.47 | 21.65 | 241.9 | 7.76 | 32.40 | |
| 1967-2006 | 179.5 | 10.98 | 13.36 | 279.2 | 13.73 | 20.98 | |
| Buenos Aires (BUE) | 1860-1899 | 174.5 | 4.53 | 40.90 | 232.5 | 5.21 | 47.60 |
| 1900-1939 | 157.1 | 2.11 | 85.90 | 260.0 | 8.85 | 28.45 | |
| 1940-1979 | 193.3 | 6.60 | 30.39 | 323.9 | 6.33 | 50.34 | |
| 1967-2006 | 195.2 | 6.63 | 29.75 | 325.2 | 6.40 | 54.33 | |
| Córdoba (CBA) | 1860-1899 | 14.7 | 0.75 | 34.70 | 338.1 | 8.92 | 36.53 |
| 1900-1939 | 20.7 | 0.75 | 42.24 | 287.4 | 12.52 | 24.86 | |
| 1940-1979 | 30.6 | 1.11 | 36.54 | 334.9 | 11.73 | 28.30 | |
| 1967-2006 | 33.4 | 1.60 | 25.23 | 360.1 | 13.50 | 27.32 | |
| Corrientes (CRT) | 1876-1899 | 121.0 | 1.50 | 86.99 | 376.5 | 5.22 | 74.40 |
| 1900-1939 | 128.9 | 2.88 | 46.56 | 350.5 | 9.31 | 38.63 | |
| 1940-1979 | 153.1 | 4.82 | 31.55 | 418.0 | 7.85 | 54.17 | |
| 1967-2006 | 166.0 | 4.38 | 37.83 | 480.5 | 14.12 | 33.48 | |
| Tucumán (TUC) | 1880-1899 | 32.0 | 1.25 | 27.37 | 496.5 | 13.10 | 38.75 |
| 1900-1939 | 29.6 | 1.26 | 27.37 | 497.7 | 15.33 | 32.36 | |
| 1940-1979 | 31.1 | 2.36 | 14.93 | 521.5 | 11.47 | 46.02 | |
| 1967-2006 | 28.1 | 1.81 | 21.22 | 547.1 | 9.03 | 61.92 | |
The climate of Bahía Blanca is classified as mid-latitude dry and semiarid. Figure 2 shows seasonal precipitation from 1860 to 2006. Figure 2a corresponds to winter and shows, from top to bottom: (a) the time series with an annual trend for the entire 147-yr period; (b) the gamma distribution for four 40-yr sub-periods arbitrarily selected in order to span over the full record; (c) trends and variance for each sub-period. Figure 2b is similar in structure but referred to summer precipitation.
 winter; (b) summer. From top to bottom: time series with annual trends for the entire period of data, gamma distribution for four 40-yr sub-periods arbitrarily selected, and trend (full line) and variance (dashed line) for each one of the 40-yr moving windows.")
Bahía Blanca. Seasonal rainfall series: (a) winter; (b) summer. From top to bottom: time series with annual trends for the entire period of data, gamma distribution for four 40-yr sub-periods arbitrarily selected, and trend (full line) and variance (dashed line) for each one of the 40-yr moving windows.
The return values for the extreme wet of winter rains in Bahía Blanca for the total series (1860-2006), with 100 and 50-yr return periods are 275mm and 240mm, respectively. For the same return periods, extremes dry values are 4 and 6mm. The increase with time in winter rainfall is observed as a shift of the distribution towards higher means, from the first to the last of the four selected periods shown in Figure 2a. The bottom panel in this figure presents the linear trend values of each window (solid line) and the variance (dashed line). The positive and negative trend values for winter fluctuate from around 1.50mm/yr to close to –2mm/yr. The largest sequence with negative trend occurs from the window 1938-1977 to the window 1951-1990. From then on, trends are positive but not significant. This oscillation in 40-yr trend values show that negative peaks are non-significant and have been decreasing for the last 140 years. Variances are analyzed because they are associated to rainfall variability. For Bahía Blanca, actual winter rainfall variances have similar values as those computed at the beginning of the period under study (4000mm2) while from 1920 to 1985 values decreased to around 2200mm2.
When analyzing changes in the parameters (location and shape) of the gamma distributions (see Table II) there is a decrease in summer rainfall between the first (1861-1900) and second (1901-1940) sub-periods, as reflected by a shift of the gamma distribution towards a lower mean. The anomalous wet years observed after the second 40-yr period and onwards (1940-1979 and 1967-2006) lead to a positive shift. The maximum positive trend in summer rainfall had profound effects by the end of the 1970s. From the successive 40-yr windows (1921-1961 to 1963-2002) several significant trend values are present. We mention three peak values: 3.14mm/yr (1940-1979), 2.83mm/yr (1943-1982) and 2.31mm/yr (1946-1985). No significant positive trend values have been observed since. On the contrary, a continuous and increasing (in absolute value) negative trend is evident. Summer variances actually reached the highest value of the studied period (10 000mm2). Note that initial variances are close to 5000mm2. Both seasons exhibit an increase in variability during the last period (1967-2006), which is reflected as a broadening of the distribution versus the other periods.
We have estimated seasonal RVs (in mm) for Bahía Blanca precipitation, for D/W extremes and for three RPs: once every 20, 10 and five years. Figures are not shown for the sake of brevity. Considering the temporal variation for the whole 40-yr periods, dry winter extremes show an increase throughout the century for each one of the RPs. This positive trend in percentiles continued also for extreme wet winters during almost all of the 20th century. The same analysis applied to summer rainfall shows increasing dry and wet extremes in correspondence with positive trends from 1970 and onwards.
Figure 3 shows the series of the confidence interval (CI) for each RV of the seasonal precipitation for a 40-yr moving window, in order to compare it with the last window CI (1967-2006), namely the control confidence interval (CCI). We selected D 10% and W 90% extremes from the gamma distribution in order to display the estimated RV and CI of winter (left) and summer (right) rainfall for Bahía Blanca (see Figs. 3a, b). The horizontal band (full line) corresponds to the CCI. The vertical bars assigned to each mean value (dot) correspond to the CI, which was determined using 1000 bootstrap resampling. Note the difference in rainfall scale (y-axis). Since the series are affected by an increasing trend, focus must be placed on those mean values and CI outside the double parallel line, i.e., mean values inferior to the control. This fact allows detecting the years in which important changes in RVs and differences in CI occurred. For instance, extreme D winter precipitation at Bahía Blanca that occurred once every 10 years, from 1900 to 1976, was significantly inferior to current values at the same RP. At the other end of the distribution, W winter values from 1920 to 1960 and 1981 to 1990 were also significantly lower than nowadays. Extreme values for summer rains (Fig. 3b) indicate that during the last decade, precipitation—occurring once every 10 years—has increased significantly for both extremes, D and W.
 for extreme dry (10%)/wet (90%) seasonal rainfall and bootstrapping confidence interval (CI) computed for each one of the 40-yr moving windows: (a) winter; (b) summer. Horizontal full line band shows confidence interval C (control) for the last 40-yr period (1967-2006). See text for details.")
Bahía Blanca. Return values (mm) for extreme dry (10%)/wet (90%) seasonal rainfall and bootstrapping confidence interval (CI) computed for each one of the 40-yr moving windows: (a) winter; (b) summer. Horizontal full line band shows confidence interval C (control) for the last 40-yr period (1967-2006). See text for details.
This station is characterized by a maritime temperate climate of mid-latitudes. The monthly rainfall series for Mar del Plata started in 1888. Figure 4 shows winter and summer rainfall distributions and variability, in a similar way to Figure 2 (see parameters in Table II). The gamma distribution presents a shift towards higher rainfall values, both for winter and summer, while there are no visible changes for the last decades. Analyzing the ends of the distribution, the probability of winter and summer rainfall of 100mm or lower has significantly decreased; the probability of 300mm or higher rainfall for winter remains almost unchanged, though for summer the probability increases by more than 100%.

As Figure 2, for Mar del Plata
Seasonal trends in precipitation for Mar del Plata are shown at the bottom of Figure 4. In winter there is a maximum value of positive trend for the 1926-1965 window with a 3.067mm/yr value (see Fig. 4a). From then on, precipitation trends decrease towards the negative value, peaking down at –1.23mm/yr, which corresponds to the 1951-1990 period. During the last decades there is a growth of trend values corresponding to an increase in winter precipitation. Trend values for each window in summer (Fig. 4b) show two major positive peaks that are statistically significant: one for 1893-1932 with 3.81mm/yr and the other for 1935-1974 with 3.92mm/yr. In between (for the 1912-1951 window) there is a negative non-significant peak at –1.14mm/yr.
Variance values for winter rainfall are relatively constant at about 6000mm2 for the first third of the record, gradually decreasing to 3000mm2 in the last decades. In summer, base values of the variance are at 6000mm2 with a noticeable peak of 9000mm2, almost coinciding with the positive trend peak for 1935-1974.
Further into the analysis of Mar del Plata station, Figure 5 shows the RV for D and W, as well as the CI. The extreme D for winter (Fig. 5a) shows a continuous increase from the beginning of the record until the 1929-1968 window, reaching an RV close to 120mm during the last periods. The same does not apply for the W values of winter (percentile 0.90). There is no evidence of changes in the RV for the whole period under study. On the contrary, for both ends (D and W) of summer rainfall (Fig. 5b) there is a continuous increase.

As Figure 3, for Mar del Plata.
A humid subtropical climate characterizes Buenos Aires station. As with Bahía Blanca, the series starts in 1860. Seasonal precipitation (winter-summer) is shown in Figure 6, as well as the gamma distribution for the previously selected periods (see Table II for numeric values). The behavior of the gamma theoretical distribution applied to the data shows an increase in rainfall. Notice that for winter rainfall there is a decrease through time of the probability rate of 100mm or lower rainfall, in behalf of larger precipitation. This behavior is even more noticeable during the summer, as the probability of extreme rainfall over 300mm increases.

As Figure 2, for Buenos Aires.
Precipitation trends for each 40-yr window in the Buenos Aires seasonal series are shown in the lower section of Figures 6a, b. Throughout the analyzed years, it can be observed that winter trends reached a significant peak of 2.20mm/yr for the period 1924-1963. There were negative trends for the period 1881-1920, with a peak of –2.00mm/yr. Another negative trend period covers from 1948 to the present day, though its not statistically relevant. For summer, in spite of fluctuations, trends are mostly positive, peaking at 3.64mm/yr for the 1938-1977 window.
Variance in winter rainfall shows remarkable fluctuation. It falls from over 1000mm2 between the years 1920-1960 (with a 1600mm2 high) to almost 600mm2 in the last decades. As for summer variance, a maximum of 2000mm2 is almost in synch with the peak in the positive trend.
In the RV analysis for the selected probability levels, Buenos Aires shows the lowest extreme D values for winter in the period 1880-1920. Sudden increase from then on almost doubles their minimum value. However, for the W end, winter RVs decrease or remain almost unchanged, depending on the RP. Unlike winter, RVs for summer rainfall have increased more or less gradually, both for the D and W end, with some multi-annual fluctuations.
The D and W rainfall values, and the CI for both seasons in Buenos Aires are shown in Figure 7. D values estimated with 10% probability for winter (Fig. 7a) show a remarkable increase from 1917-1956 to 1932-1971 and then remain stable, even when the RVs for 1947-1986 surpass all others. For W winter ends there are no years in which changes in RVs can be detected, according to the aforementioned definition. Instead, for both ends of summer rainfall distribution, there is a rise of RVs after 1900 of between 40 and 60%.

As Figure 3, for Buenos Aires.
Córdoba Station, located in central Argentina, has a typical subtropical continental climate. Rainfall data covers the period 1873-2006. It is characterized by dry winter and abundant rainfall during the summer. Figure 8 shows this behavior through mean values for rainfall in each season: 33mm in winter and 334mm in summer. The gamma theoretical distribution is close to an exponential function in winter rainfall vs. summer rainfall (see Table II). Comparing seasonal trends, there is an increase in precipitation during the summer. This rise is evident in the displacement of gamma distribution for the different windows (see Fig. 8b, middle panel), as the probability for summer rainfall below 100mm decreases and the probability of higher rainfall increases.

As Figure 2, for Córdoba.
The decrease in precipitation during the first half of the 20th century is observed when analyzing the curve of trends both for winter and summer. Significant trends take place in summer. The most relevant peak of negative trends is –2.97mm/yr for the 1912-1951 period, while the positive trend peaks in the 1943-1982 period at a rate of 4.13mm/yr. Consistent with the summer precipitations regime, variance values are higher than in winter. Throughout the analyzed records, summer variance shows a fluctuation ranging from 1.25 × 104mm2 in the first decades to between 1.0 × 104mm2 and 0.2 5 × 104mm2.
Although wintertime rainfall in Córdoba is scarce, the analysis of RV in the D end indicates an almost constant increase, unlike the W ends, which show interdecadal fluctuations. As for the amount of extreme rainfall in summer, D values show a remarkable inter-secular fluctuation, with peaks in 1887-1928 and 1960-1999. RVs for the W end, for the three RP analyzed (20, 10, and 5%), show evidence of almost continuous decrease during the first third of the study, but there is a jump in rainfall after the 1939-1978 window. This increase still goes on (figures are not shown for the sake of brevity).
Fluctuations of precipitation in Córdoba for winter and summer, and for 10% D and 90% W probability levels, together with the CI, are shown in Figure 9. Increasing values for winter D (Fig. 9a) in the last decades prove a shift in RVs, whose most significant peak takes place after 1962-2001. This behavior does not apply for the W end, which shows no evidence of significant changes in the RVs of winter, according to the aforementioned definition. On the contrary, summer D and W, as shown in Fig 9b, allows to detect the period with RVs significantly inferior to current ones: 1890-1929 to 1939-1978.

As Figure 3, for Córdoba.
The climate in Corrientes is classified as humid sub-tropical. The record of analyzed rainfall starts in 1876. This humid, sub-tropical station has abundant rainfall all year long, with larger amounts in summer since rainfall increases due to convection and regional scale processes associated with the South Atlantic Convergence Zone (SACZ) (Nogués-Paegle and Mo, 1997; Barrucand et al., 2008; Carvalho et al., 2004). Figures 10a, b show these seasonal differences, which reveal the prominent winter asymmetry compared to summer distribution. There is a slight increase in summer precipitation towards the end of the studied period (see trend line in Fig. 10b). Increase in summer rainfall is evident at both ends as the shift towards higher values in the distribution leads to increasing values.

As Figure 2, for Corrientes.
For Corrientes there are three periods with positive trends for winter rainfall throughout the data records (1884-1923, 1943-1982 and 1953-1994); all have significant peak values, being the sharpest 2.1mm/yr. The negative trend peaks for the window 1894-1933, but it is not a statistically significant value. Precipitation variance remains at about 5000mm2, except at the initial windows, in which values surpass 1.0 × 104mm.
As for trends in summer rainfall, two positive peaks are particularly noteworthy. One of 5.85mm/yr for the sub-period 1928-1967 and the second one of 4.06mm/yr for 1963-2002. There are no significant values in this season for negative trends.
We have estimated the RVs of summer rainfall for Corrientes for both ends (D/W) and different percentiles: 5/95, 10/90, and 20/80%. Dry ends show an increase throughout the data record. We particularly mention summer rainfall at a frequency of once every 20 years; RVs increased from 600mm in the first half of the 20th century to more than 700mm in the last 50 years. This behavior is presented in Figure 11, which allows establishing the time and magnitude of increase vs. current conditions represented by CCI.

As Figure 3, for Corrientes.
The region of Tucumán in the northwest of Argentina has a humid, sub-tropical climate with a dry season. The data record starts by 1880. Consistent with the region’s climate, the rainy season is summer, with a mean value of 521mm for the whole record. As observed in the gamma distribution for different periods (Fig. 12), this site doesn’t have a relevant shift in precipitation. There is an increase in the probability of summer rainfall over 600mm. The highest trend for winter rainfall surpassed 1mm/yr and was observed between 1953-1992 and 1962-2002 (Fig. 12a, lower panel). As for summer, statistically relevant trends are –2.4mm/yr at the beginning of the period, while the positive peak surpassed 5mm/yr for 1945-1984 (Fig. 12b). Regarding the seasonal variability represented by the variance, there is an increase for both seasons. For the most recent decades, winter variance estimates are between 1000-1500mm2 while the increase observed for summer went from a typical variance of 1.0 × 104mm2 to 3.7 × 104mm2 for the window 1965-2004.

As Figure 2, for Tucumán.
The results of RVs in seasonal rainfall for the three studied probabilities showed that in winter, the D ends increased progressively while for the W end, after a noticeable decrease in amount for more than two thirds of the analyzed period, there is a rapid increase in the last decades. For summer, the D end showed no increase in RVs, but there is an almost continuous increase for the W end. When studying the potential changes in seasonal rainfall throughout time using the CI vs. the CCI, for the 10% and 90% probabilities (Fig. 13), it becomes evident that the sustained increase in rainfall happens at the W extreme of summer.

As Figure 3, for Tucumán.
Studies that use more than centennial rainfall data are useful for a better understanding of precipitation behavior. From the analysis of the six reference series in north and central Argentina it is possible to infer the changes in seasonal rainfall during the last 140 years, evaluated for both extreme return values (above/below the 80th/20th percentile). The increase in rainfall is observed almost simultaneously for the plain lands of north and central Argentina in the summer season.
We have used a best-fit function (two-parameter gamma function) to analyze the seasonal data. Differences in α and β parameters of the gamma distribution are observed between winter or summer rainfall and among regions. We found that α values for some locations are close to 1, as a result of dry winters (as is the case of Córdoba). The behavior of the positive shift of the gamma distribution (see the corresponding figures) clearly evidences that the last analyzed 40-yr window (1967-2006) shows the higher displacement to greater rainfall amounts for each one of the selected locations. This fact is consistent with Barros et al. (2008), who focus their study on annual and seasonal rainfall trends for subtropical South America on the period 1960-1999 because of their large and positive trends.
We have analyzed the confidence interval (CI) corresponding to the 10th and 90th percentiles of the gamma distribution of seasonal precipitation and compared it with a control CI calculated for the last 40-yr period, both for winter and summer rainfall. Summer season W values have shown a noticeable and significant increase through time.
To summarize, in Figure 14 we present the RV for extreme D and W of summer rainfall for each moving window and location. As summer is the wet season, major changes are enhanced when analyzing these months of the year. Largest increases in RVs are observed for the W end, but not all stations (lines) exhibit a similar behavior. The return values of two pair of stations are comparable: those for Bahía Blanca-Mar del Plata (with the lowest magnitudes) and Buenos Aires-Córdoba. Corrientes and Tucumán detach from the rest of the locations and show the largest RVs, as could be expected because of their summer rainfall regimen (see Fig. 1). A common fact is the almost simultaneous increase detected from north to south (i.e. from Tucumán to Bahía Blanca) after the 1931-1970 window. The increase in RVs for Corrientes starts several years before. This fact is also detected when analyzing the peak value of the linear trend.

We list here the largest positive trends (mm/yr) and the correspondent period of 40 years for each station: Bahía Blanca: +3.14 (1940-1979); Mar del Plata: +3.92 (1935-1974); Buenos Aires: +3.64 (1938-1977); Córdoba: +4.13 (1943-1982); Corrientes: +5.85 (1928-1967), with a secondary peak of +4.06 (1963-2002); and Tucumán: +5.19 (1945-1984). Unlike the linear trend evaluated for the data record in Barros et al. (1996), that encompass the total length of data, the difference between mean values applied to separated periods of a long record (Minetti and Vargas, 1998) or the use of non-linear trends as second or higher order functions (Minetti et al., 2003), the analysis of trends performed in this work using a method of moving windows provides a dynamical perspective of rainfall behavior. It can be inferred from the analysis that regions with different climatic regimes have different intensity and slopes in the observed trends. Largest positive trends accompany accumulated seasonal rainfall. We conclude that there has been a shift in rainfall distribution towards increasing rainfall, as well as a fluctuating change in the rainfall variance through time, whereas summer rainfall is responsible for greater trends and variability.
The observed increase in variability during the last window (1967-2006) and the reason that determines the change might be explained by changes in atmospheric circulation and on teleconnetion patterns such as El Niño-Southern Oscillation (ENSO) and the Pacific Decadal Oscillation (PDO). Some physical and dynamical causes of the summer rainfall increase have been attributed to the ENSO signal in those cases when ENSO and PDO are in the same phase (Kayano and Andreoli, 2007). Recent studies by Silva et al. (2011) have pointed out that the impact of EN events during positive PDO(+) phases affects the transport of moisture and extratropical cyclonic properties in austral summer over southeastern South America. The changes in tropical-extratropical circulation anomalies after 1976 seem to be associated with an increase in the frequency and intensity of EN events and positive precipitation anomalies. Consistently with the last warm PDO regime that occurred during the period 1977 to mid-1990s, Robertson and Mechoso (2000) have found an increase in precipitation and river flow over southeastern South America. This cannot be exclusively attributed to the PDO variability, because the EN events have been more intense and frequent in the 1980s and 1990s (Ambrizzi et al., 2004).
Through the analysis of past precipitation anomalies we were able to detect whether extremely dry or wet anomalies over selected regions of Argentina have become more extreme in recent decades in the context of the last one-and-a-half centuries. Future works will focus on the influence of the PDO phases over seasonal rainfall in the region. Some applications of these results are of regional interest, related to agronomic production or water resources. Moreover, a more profound understanding of the variability of extreme precipitation and the length of extended wet and dry periods may help to improve climate models and interpret model results.
This research was supported by the Agencia Nacional de Promoción Científica y Tecnológica (ANPCyT) through the Proyecto de Investigación Científica y Tecnológica (PICT) 32296.