


Este estudio presenta un análisis de factores de gran escala para entender por qué la frecuencia de formación de ciclones tropicales (CT) en la cuenca del Pacífico noroccidental fue extremadamente baja durante la temporada 2010. Se calculó el índice de génesis potencial (GPI, por sus siglas en inglés) que, en cierto sentido, puede representar la distribución espacial de formación en 2010. Sin embargo, el GPI no puede explicar la frecuencia extremadamente baja observada en dicho año. No se encontró una relación robusta entre el número de CT y el fenómeno El Niño/Oscilación del Sur (ENOS). Se llevó a cabo una comparación entre el año más inactivo (2010) y el año más activo (1994) en dicha cuenca, basada en un índice de diferencia de caja, el cual permite medir cuantitativamente la diferencia entre factores ambientales de gran escala. Se encontró que los factores dinámicos son importantes para diferenciar la formación de CT en la cuenca del Pacífico noroccidental entre 2010 y 1994. La notable diferencia de la circulación monzónica en dicha cuenca entre esos dos años puede ser la causa de la diferencia en ciclogénesis. Las condiciones desfavorables para la ciclogénesis en 2010 pudieron deberse a la influencia de otros factores de gran escala, tales como: 1) la débil actividad asociada a la Oscilación de Madden-Julian durante el pico de la temporada ciclónica; 2) el aumento de la temperatura superficial del mar observado en el Océano Índico, lo cual originó el desarrollo de un anticiclón sobre la cuenca ciclogenética del Pacífico noroccidental y el movimiento hacia el oeste de la vaguada monzónica, y 3) el cambio de fase de la Oscilación Decadal del Pacífico (más negativa) y los dos episodios fuertes de La Niña que se han desarrollado desde 2006.
This study attempts to understand why the frequency of tropical cyclones (TC) over the western North Pacific (WNP) was a record low during the 2010 season, by analyzing the effect of several large-scale factors. The genesis potential index (GPI) can represent, to some extent, the spatial distribution of formation in 2010. However, the GPI does not explain the extremely low TC frequency. No robust relationship between the TC number and El Niño Southern Oscillation (ENSO) was found. A comparison of the extreme inactive TC year 2010 and extreme active year 1994 was performed, based on the box difference index that can measure the quantitative difference of large-scale environmental factors. Dynamic factors were found to be important in differentiating TC formation over the WNP basin between 2010 and 1994. The remarkable difference of monsoon flows in the WNP basin between these two years may be the cause of the difference in TC formation. The unfavorable conditions for TC genesis in 2010 may have also been due to other large scale factors such as: (1) weak activity of the Madden-Julian Oscillation during the peak season; (2) warming of the sea surface temperature in the tropical Indian Ocean during the peak season, causing the development of an anticyclone over the WNP basin and associated with the westward motion of the monsoon trough, and (3) the phase change of the Pacific Decadal Oscillation (more negative) and the two strong La Niña events that have evolved since 2006.
The tropical cyclone (TC) genesis frequency over the western North Pacific (WNP) basin in 2010 was exceptionally low. If not otherwise specially defined, the WNP basin refers to the WNP basin and the South China Sea (SCS) as shown in Figure 1 in this study. Only 14 TCs were observed in 2010 over the WNP based on the best track data archived from the Joint Typhoon Warning Center (JTWC), constituting the lowest TC frequency since the weather satellites began their routine monitoring in 1965. In contrast, 1994 presented the highest number of TC (34) over the WNP basin since 1973, when the Dvorak technique was used for estimating TC intensity. While presenting a very large number of TCs, 1994 is not the record high, since 35 TCs were observed in 1963 and 1971; however, the total TC count in those years may be biased due to the uncertainty in the TC intensity data record. Several previous studies (Chan, 2006; Landsea et al., 2006; Landsea, 2007; Kossin et al., 2007) have suggested that the uncertainty in the determination of the intensity of historical TCs might lead to inconsistencies in the records. Emanuel (2005) extensively discussed the evolution in measurement and estimation techniques introduced in historical records of TC wind speeds and provided additional evidence supporting the need for a downward adjustment of TC intensities in early records prior to 1973. Using the intensity model developed by Emanuel et al. (2008), which is an axisymmetric numerical atmospheric model coupled with a simple on-dimensional ocean model, the basin-wide TC intensity in the JTWC dataset can be reasonably reproduced in terms of the interannual and inter-decadal variations and climate trend in TC records after 1973, while intensity changes are not consistent with the dynamically-derived intensities over the period 1965-1973 (Wu and Zhao, 2012; Zhao, et al. 2014). Therefore, in this study the low numbers observed during the 2010 season are in stark contrast to the record high TC frequency in 1994 (Fig. 2a). Similar results are also found when only considering the peak TC season (July-October) (Fig. 2b). A TC with sustained maximum winds of 35 knots or above is considered.
, the eastern Indian Ocean (EIO: 10° S to 22.5° N, 75 to 100° E), the South China Sea (SCS: equator to 22° N, 105 to 120°E), and the western North Pacific basin (equator to 35° N, 120 to 180° E).")
A map with different geographic location for several key specific regions used in this study: the tropical Indian Ocean (TIO: 22.5° S to 22.5° N, 40 to 100° E), the eastern Indian Ocean (EIO: 10° S to 22.5° N, 75 to 100° E), the South China Sea (SCS: equator to 22° N, 105 to 120°E), and the western North Pacific basin (equator to 35° N, 120 to 180° E).
 annual TC season and (b) peak (July to October). (c) Niño-3.4 SST anomalies index (°C) averaged over the peak TC season in the western North Pacific basin according to the method of Wang and Chan (2002). The selected warm (cold) years are shown in red (blue) bars with SST anomalies greater than a standard deviation (red lines), with white bars for neutral years.")
Time series of TC frequency for (a) annual TC season and (b) peak (July to October). (c) Niño-3.4 SST anomalies index (°C) averaged over the peak TC season in the western North Pacific basin according to the method of Wang and Chan (2002). The selected warm (cold) years are shown in red (blue) bars with SST anomalies greater than a standard deviation (red lines), with white bars for neutral years.
The extremely low TC activity in 2010 has not received much attention from the community, although operational agencies and studies had reported the fact and gave some possible qualitative explanations (Maue, 2011). The El Niño Southern Oscillation (ENSO) condition was suggested as the most important determinant factor. Indeed, a strong La Niña event developed in the summer of the record low year of 2010, while a moderate El Niño event occurred in the peak season of the record high year of 1994 (Fig. 2c). Studies also suggest that there is no robust relationship between ENSO and the TC number in the WNP, but a remarkable south-eastern shift in location of TC formation during El Niño years compared to that during La Niña years can be found (Wang and Chan, 2002; Chu, 2004; Zhao et al., 2010). Thus, the ENSO condition does not seem to be sufficient in to account for the low TC frequency in 2010. It is also of interest to examine the modulation of 2010 TC genesis by the La Niña background.
In addition to the interannual variability of TC activity in the WNP basin, TC activity is closely associated with intraseasonal atmospheric variability also known as the Madden-Julian Oscillation (MJO) (Madden and Julian 1971; Liebmann et al., 1994; Bessafi and Wheeler, 2006; Harr, 2006; Kim et al., 2008). Liebmann et al. (1994) found that TC formation frequency over the WNP basin is larger than over the Indian Ocean, preferentially during the convective phase of the MJO. The associated low-level cyclonic relative vorticity and convergence anomalies appear poleward and westward of the large-scale convective anomaly. Subsequently, Kim et al. (2008) discussed the MJO-TC relationship under the different ENSO conditions and proposed a possible hypothesis of an enhanced MJO-TC relationship during El Niño years and a weakened MJO-TC relationship during La Niña years. The underlying mechanism by which the MJO modulates TC activity under the ENSO condition remains a subject of intense investigation.
Several recent studies have focused on the influence of atmospheric circulations associated with changes in sea surface temperature (SST) in the tropical Indian Ocean (TIO) and TC activity in the WNP basin (Xie et al., 2009; Du et al., 2011). Based on both observations and model simulations, Xie et al. (2009) proposed a possible mechanism in which the TIO warming acts like a capacitor, anchoring atmospheric anomalies over the Indo-western Pacific oceans. It causes tropospheric temperature to increase by a moist-adiabatic adjustment in deep convection, emanating a baroclinic Kelvin wave into the Pacific. In the WNP basin, this equatorial Kelvin wave induces northeasterly surface wind anomalies, and the resultant divergence in the subtropics is responsible for suppressed convection and the anomalous presence of an anticyclone. Du et al. (2011) further discussed the influence of the SST in the tropical Indian Ocean on TC activity in the WNP during the summer following strong El Niño years. Independently, Zhan et al. (2011a, b) also found that the interannual variation of TC number in the WNP is closely associated with the SST in the eastern Indian Ocean (EIO). Because of the role of the remote forcing from the Indian Ocean, results of these studies are potentially useful for seasonal forecast of TC in the WNP basin.
In this study, we examine the influence of large-scale circulations (i.e., ENSO, MJO and SST) in the TIO and relate them to TC activity to shed light on the lowest recorded TC genesis frequency observed in 2010 over the WNP basin. The remainder of this study is organized as follows: Section 2 describes the data and methodology used and Section 3 discusses the modulation of 2010 TC genesis by ENSO background. The influence of MJO on 2010 TC genesis is examined in Section 4 while the effect of the tropical Indian Ocean on 2010 TC genesis is investigated in Section 5. Finally, a summary and discussion are given in Section 6.
2Data and methodologyThe TC data in the WNP basin is based on the best track TC dataset from the JTWC, which includes central location and intensity of tropical storms and typhoons at a six-hour interval. In this study, we analyze the period from 1965 to 2010, from the beginning of satellite meteorology. In addition, we focus on the peak TC season from July to October (JASO) during which, on average, more than 68% TCs occurred each year. The selection of peak season has three other reasons. First, the TC frequency during the peak season of 2010 is also the lowest recorded since 1965 (Fig. 2b). Second, the correlation between the annual TC numbers and the peak season number is about 0.8, which is statistically significant at a 95% confidence level. And third, the physical mechanisms are better understood for this time window within TC seasons.
To examine the influence of the La Niña-related climate conditions on TC genesis, atmospheric variables (i.e., relative humidity, wind, air temperature, specific humidity) are derived from the NCEP/NCAR monthly reanalysis dataset with a 2.5 ×2.5° longitude/latitude resolution (Kalnay et al., 1996). The monthly extended reconstructed SST data (version 3b) from the NOAA (Smith and Reynolds, 2004) is used to stratify the ENSO years and to investigate the influence of the warming in the tropical Indian Ocean on 2010 TC genesis. The Niño-3.4 sea surface temperature anomalies (SSTAs) from the Climate Prediction Center are used to identify the El Niño and La Niña years with a standard deviation similar to the definition in Wang and Chan (2002). As shown in Figure 2c, the years with a SSTA larger (less) than 0.81°C (-0.81 °C) are defined as El Niño (La Niña) years. Thus, nine El Niño years (1965, 1972, 1982, 1987, 1991, 1997, 2002, 2004, and 2009) and eight La Niña years (1970, 1971, 1973, 1975, 1988, 1998, 1999, and 2010) are selected for the present study.
The daily interpolated outgoing long-wave radiation (OLR) data (Liebmann and Smith, 1996) from the NOAA polar orbiting satellites on a 2.5 x 2.5° latitude/longitude grid are used as a proxy for deep convection, to evaluate the influence of MJO on TC formation.
3Statistical analyses of tropical cyclone activity in 2010As mentioned above, the strong La Niña condition appears not to be a dominant factor for the lowest TC number in 2010. Nevertheless, given the impact of ENSO on circulation anomalies in the Pacific Ocean, it is instructive to know how TC activity responds to ENSO. The average TC number during the peak season is about 17.5 and 16.5 for El Niño and La Niña years, respectively. The difference of TC number between El Niño and La Niña years is just 1.0, which is not statistically significant at a 95% confidence level, consistent with results in previous studies (Wang and Chan, 2002; Chu, 2004; Camargo and Sobel, 2005; Zhao et al., 2010). However, a significant difference between El Niño and La Niña years is observed in terms of the genesis location, as shown in Figure 3. A pronounced eastward and southward shift in the TC formation region is observed during El Niño years compared to La Niña years. For the typical La Niña year of 2010, the mean TC formation latitude and longitude is 18.9° N and 127.1° E. This westward shift is quite remarkable from the average position during El Niño years (17.6° N and 141.6° E). Note that the average TC formation location in specific year 2010 is seven degrees in longitude westward from the La Niña average (19.1° N and 134° E). Particularly, a decrease is seen in TC numbers (only five TCs) formed south of 20° N and east 120° E in 2010, which is similar to the case of the year following a strong El Niño year (Du et al., 2011).
 El Niño years and (b) La Niña years. (c) TC genesis distribution observed during JASO in 2010.")
To investigate the key factors for the low frequency observed in 2010, the genesis potential index (GPI) (Emanuel and Nolan, 2004) is adopted in this study, which has been extensively used in other studies (e.g., Camargo et al., 2007; Emanuel et al., 2008). The GPI is defined on the basis of four factors:
where η is the absolute vorticity at 850 hPa (s–1), H is the relative humidity at 600 hPa (%), Vpot is the potential intensity (ms–1), and Vshear is the magnitude of the vertical shear of the horizontal wind between 850 and 200 hPa (ms–1). The potential intensity Vpot can be computed according to the algorithm of Bister and Emanuel (2002), who consider SST and vertical profiles of temperature and specific humidity in the troposphere. Vpot is defined by the following expression: where Ts is SST, To is the mean outflow temperature at the level of neutral buoyancy, Ck is the exchange coefficient for enthalpy, CD is the drag coefficient, CAPE* is the convective available potential energy (CAPE) of air lifted from saturation at sea level in reference to the environment sounding, and CAPEb is the CAPE of boundary layer air. Both quantities are evaluated near the radius of maximum wind.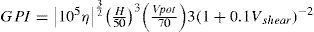

Figure 4a shows the overall GPI anomalies in 2010 compared to climatology. An east-west dipole in the GPI distribution is evident, with positive anomalies confined mainly to the west of 140° E near East Asia and negative anomalies to the east of 145° E in the open ocean. Figure 4b displays the observed TC genesis anomalies in 2010. Although an area of positive genesis anomalies is also observed near the East Asian coast, the large GPI anomalies over the Philippines and the South China Sea seen in Figure 4a do not correspond to positive genesis anomalies in Figure 4b. In fact, genesis anomalies are negative over the Philippines and near the long-term mean over the South China Sea in Figure 4b. According to the GPI analysis, we found that the proposed GPI (Emanuel and Nolan, 2004) is not a perfect surrogate for representing the TC genesis in the WNP basin, although it can, to some extent, represent the spatial distribution of formation. The pattern correlation between the overall GPI (Fig. 4a) and the observed genesis anomalies (Fig. 4b) is about 0.27, which is not statistically significant at a 95% confidence level. Further analysis indicates that the annual TC frequency during the peak season over the WNP basin for the period 1965-2010 has a weak correlation with the GPI (figure not shown), suggesting that other factors beyond the four variables in GPI may play a role in modulating TC frequency.
 Observed TC genesis anomalies in 2010 JASO compared to climatological mean (1965-2010), and (b) GPI anomalies in the 2010 peak season compared to climatological mean.")
To further understand the influence of large-scale environmental fields on the TC activity in 2010, the large-scale environmental conditions during the peak season are contrasted for two extreme years: 2010 is the most inactive year (13 TCs) and 1994 is the most active year (28 TCs). Recently, Peng et al. (2012) developed the box difference index (BDI) methodology, which can quantitatively determine which parameter at which level is best in distinguishing developing and non-developing disturbance groups. Using the BDI method, the relative importance of environmental factors affecting TC genesis over the WNP basin is assessed, comparing an extreme high TC number for 1994 and an extreme low TC number for 2010. The definition of the BDI index is as follows:
where M2010 and δ2010 represent the mean and standard deviations of the variables for the TC genesis over the peak season during 2010. The corresponding parameters for 1994 are represented by M1994 and δ1994. The sign of the BDI reflects the physical nature of a variable; the magnitude of the BDI measures how well the variable can differentiate between the TC genesis in 2010 and 1994. More details can be found in Peng et al. (2012).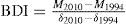
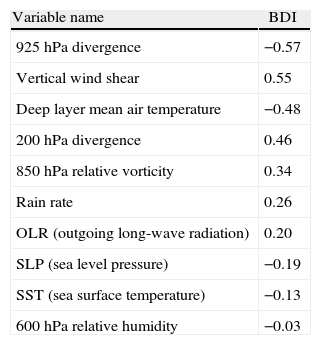
Table I shows the sorted list of important genesis parameters for the WNP basin and the corresponding BDI values. The results in Table I indicate that the vertical wind shear and the 925 hPa divergence are the most important parameters to differentiate TC genesis between 2010 and 1994. Second in importance are the 200 hPa divergence and deep layer mean air temperature, followed by the 850 hPa relative vorticity. Last in importance appear SST, OLR, sea level pressure (SLP), 600 hPa relative humidity and rain rate. The results in this table clearly indicate that dynamic factors are more important in differentiating the TC formation over the WNP basin between 2010 and 1994. Although a remarkable SST difference can be found between 1994 and 2010, a rather uniform SST zonally in the warm-pool region is characteristic of the WNP basin, which is favorable for TC genesis. Therefore, the relative importance of SST and other thermodynamical factors between the 1994 and 2010 is not significant.
Ranks of genesis parameters in the WNP and their corresponding box difference index (BDI).
| Variable name | BDI |
| 925 hPa divergence | −0.57 |
| Vertical wind shear | 0.55 |
| Deep layer mean air temperature | −0.48 |
| 200 hPa divergence | 0.46 |
| 850 hPa relative vorticity | 0.34 |
| Rain rate | 0.26 |
| OLR (outgoing long-wave radiation) | 0.20 |
| SLP (sea level pressure) | −0.19 |
| SST (sea surface temperature) | −0.13 |
| 600 hPa relative humidity | −0.03 |
The importance of dynamical factors in differentiating TC formation between 1994 and 2010 may be linked to the remarkable difference of monsoon flows in the WNP basin between those years. A pronounced monsoon flow is found in 1994, which differs significantly from the monsoon retreat westward during 2010 (Fig. 5). This monsoon circulation contributes to a more pronounced large-scale convergence and horizontal shear associated with TCs. Figure 5 shows that a well-established monsoon trough is present at 850 hPa in 1994, while a weaker monsoon trough is seen in 2010. Note that TCs always develop in an environment where low-level cyclonic vorticity is strong and there is a possibility that the seasonal mean cyclonic vorticity over the monsoon trough is produced by TCs themselves. To test such possibility, we examine the seasonal mean vorticity field in which the influence from TCs has been removed. The influence of TCs is removed following Wu and Chu (2007), and we consider a period during the pre-season (25 Jun-11 Jul) when no TCs formed in the WNP basin. Figure 6 shows the wind patterns at 850 hPa for 2010 and 1994 during the pre-TC season. During the pre-season in 1994, the monsoon trough and cyclonic vorticity is observed southeastward approaching 150° E (Fig. 6a). In contrast, in 2010, the monsoon trough is not observed and cyclonic vorticity is very weak (Fig. 6b). Thus, it becomes evident that without the influence from TC activity, cyclonic vorticity is closely related to the monsoon trough during the pre-season period. Assuming that the atmospheric state is persistent, TCs had very limited influence on the seasonal mean cyclonic vorticity over the WNP in either 1994 or 2010. Therefore, TC influence on the seasonal mean vorticity field is insignificant and the results obtained above should be robust.
 1994 and (b) 2010, respectively.")
 at 850hPa during the pre-TC season (25 Jun-11 Jul), during which no TCs formed for (a) 1994 and (b) 2010, respectively.")
Previous studies have shown that the intraseasonal TC activity is significantly related to the MJO activity (Liebmann et al., 1994; Harr, 2006; Kim et al., 2008). We evaluate now the possible impact of MJO activity in the 2010 season through the analysis of the OLR as a proxy for convective activity in the tropics. Positive OLR anomalies indicate suppressed convection and negative anomalies correspond to active convection. A time-longitude cross-section of the OLR anomalies for 2010 is shown in Figure 7. The MJO activity is evident from January to mid-February as anomalous convection propagates from the eastern Indian Ocean across the Maritime Continent to the equatorial central-eastern Pacific. During the peak season of 2010, we find most positive OLR anomalies from the east of 120° E to the International Dateline associated with a very weak sign of eastward propagation. In contrast, in 1994 OLR anomalies extended to 180° E with strong evidence of eastward propagation.
 averaged between 5o S and 5o N, for: (a) 1994 and (b) 2010. Anomalies are departures from the 1979-2010 base period daily means.")
Several studies have suggested that cyclogenesis in the WNP basin often occurs in association with synoptic-scale convective disturbances (McBride and Zehr, 1981; Ritchie and Holland, 1999; Schreck et al., 2011, 2012). Thus, we evaluate here the role of these convective disturbances on TC genesis in 2010 and 1994. The time-longitude cross sections of the 3-8-day filtered OLR anomalies averaged between 7-25° N are plotted in Fig. 8 for the peak season in 1994 and 2010. In both panels, each convective disturbance passing over the cyclogenesis region between 110 E and 140° E could be traced back at least to 170° E. Note that each TC formation (denoted by the closed dot) is preceded by such a westward propagating synoptic-scale disturbance. Based on these features, we suggest that the 3-8-day convective disturbances propagating from the east of the main development region of the WNP basin are the ones related to the more active convection in 1994. These features over the WNP basin are similar to some reported over the eastern Pacific by Molinari et al. (2000) and Wu and Chu (2007).
, averaged between 7-25° N, for (a) 1994 and (b) 2010, respectively. The black dots correspond to individual cyclogenesis events.")
ENSO is known to alter the characteristics of the MJO and 2010 is a strong La Niña year. Studies have shown that the MJO-related convective activity east of the dateline is enhanced during El Niño years (Hendon et al., 1999; Kim et al., 2008; Chand and Walsh, 2010). However, caution should be taken since this MJO-TC relationship is not absolutely accurate, and TC activity may still be present in unfavorable conditions like inactive MJO and developing La Niña episodes (Ching et al., 2010). The actual mechanism by which the MJO modulates tropical cyclogenesis under ENSO conditions still remains unclear. For the inactive MJO phases, such as in 2010, the possible mechanism should be investigated in the future.
5Impact of tropical Indian Ocean warming on TC numbers in 2010The SST anomalies in the tropical Indian Ocean have recently been proposed to play an important role in the development of the strong 2009 El Niño year in the Pacific Ocean. Given that TC activity such as genesis locations and landfalls can be modulated by ENSO, it is plausible that the warming in the tropical Indian Ocean may exert its influence on TC climatology in the WNP (Klein et al., 1999; Wang et al., 2003; Izumo et al., 2008; Xie et al., 2009; Du et al., 2009, 2011; Zhan et al., 2011a, b). In particular, Zhan et al. (201l a, b) investigated the contribution of ENSO and eastern Indian Ocean SST on TC climatology in the WNP basin and found that the effect of the eastern Indian Ocean is seen primarily on weak TCs (with sustained maximum wind speed < 41.5 ms-1) based on simulations and observations. Klein et al. (1999) pointed out that El Niño teleconnections induce a robust basin-wide warming over the tropical Indian Ocean, which persists through the next summer while El Niño itself has dissipated in the equatorial Pacific (Du et al., 2009). Du et al. (2011) further suggested that the tropical Indian Ocean teleconnection is accomplished by a warm atmospheric Kelvin wave propagating into the WNP basin and suppressing TC activity in the summer following an El Niño year, which is also consistent with weak MJO activity during the peak season of 2010 relative to other years.
As demonstrated in previous studies and our statistical analyses presented in Section 3, there is no robust correlation between TC activity in the WNP and ENSO events. The implication is that the strong La Niña condition is not sufficient to cause the extremely low TC numbers observed in 2010. Now the question is, besides the low MJO activity, what mechanism might have led to the low TC numbers in 2010? In the peak season of 2009, 16 TCs formed in the WNP basin and five of them were intense TCs. In contrast, 13 TCs formed in the same period of 2010 and only two of them were intense TCs in the WNP basin. In the region of the South China Sea, more TCs were found in 2010 (four TCs) than in 2009 (three TCs). Du et al. (2011) also noted a decrease in TC numbers in summer compared to the following El Niño summer over the WNP (not including SCS) and an increase in TC number over the South China Sea. Following the argument of Du et al. (2011), we note that very high SSTs are observed (Fig. 9a) in the tropical Indian Ocean in 2010 (second highest in 2009), which could be related to the low TC activity in 2010. Moreover, an anomalous anticyclone develops over the WNP basin (Fig. 10a) with easterly anomalies stretching from the Bay of Bengal to the International Dateline, and the associated weakening of the monsoon trough (Figs. 9b and 10b). The summer anticyclone had been noted in previous studies (Wang et al., 2003) and the associated weakening of the southwesterly monsoon wind causes a pronounced warming over the western part of the WNP basin especially in the region of the South China Sea (Fig. 10b). In addition, the tropical Indian Ocean influence persists into the summer and sustains atmospheric anomalies after El Niño itself is gone, characterized by a Matsuno-Gill pattern in the upper troposphere (Figs. 9c and 10c), also noted by Yang et al. (2007) During the summer of 2010, following a strong El Niño year in 2009, the tropical Indian Ocean warming is the main possible culprit for the anomalous anticyclone and suppressed convection over the subtropical WNP basin (Figs. 9d and l0d). We also found a decrease in vertical wind shear over the South China Sea with an increase in shear over the WNP (not including SCS) basin. This pattern is possibly linked to a warm tropospheric Kelvin wave excited by westerly stress anomalies, which is induced by the tropical Indian Ocean warming and that propagates into the WNP. Inducing surface divergence off the equator, the tropospheric Kelvin wave suppresses convection and induces an anomalous anticyclone over the WNP. Both the suppressed convection and anticyclonic anomalies are unfavorable for tropical cyclogenesis in the region (Fig. 11). The westerly vertical shear associated with the warm Kelvin wave reduces the magnitude of the vertical shear in the South China Sea and strengthens it in the WNP (not including SCS). Such an east-west variation in vertical wind shear causes TC activity to increase in the South China Sea (especially in the southern part) and to decrease in the WNP (not including SCS).
 SST (shading, unit: °C), 850 hPa wind(vectors, unit: ms–1) and vertical wind shear (contours, unit: ms–1); (b) 850 hPa relative vorticity (unit: 10–6 s–1); (c) 200hPa divergence (unit: 10–6 s–1), and (d) 500hPa Omega (unit: 103*Pa s–1).")
Difference of environmental fields in 1994 compared to the climatological mean: (a) SST (shading, unit: °C), 850 hPa wind(vectors, unit: ms–1) and vertical wind shear (contours, unit: ms–1); (b) 850 hPa relative vorticity (unit: 10–6 s–1); (c) 200hPa divergence (unit: 10–6 s–1), and (d) 500hPa Omega (unit: 103*Pa s–1).
 SST (shading, unit: °C), 850hPa wind (vectors, unit: ms–1) and vertical wind shear (contours, unit: ms-1); (b) 850hPa relative vorticity (unit: 10-6 s-1); (c) 200hPa divergence (unit: 10-6 s-1), and (d) 500hPa Omega (unit: 103*Pa s-1).")
Difference of environmental fields in 2010 compared to the climatological mean: (a) SST (shading, unit: °C), 850hPa wind (vectors, unit: ms–1) and vertical wind shear (contours, unit: ms-1); (b) 850hPa relative vorticity (unit: 10-6 s-1); (c) 200hPa divergence (unit: 10-6 s-1), and (d) 500hPa Omega (unit: 103*Pa s-1).
 1994 and (b) 2010, respectively. Shading indicates vertical velocity (unit: Pa s-1) and vectors represents the wind (unit: ms-1) averaged between 120-160° E.")
It is interesting to find that the large-scale conditions in 1994 are the mirror image of those in 2010. In other words, the tropical Indian Ocean cooling may be an important factor for high TC numbers in 1994. However, note that the SST over the tropical Indian Ocean in 1994 is not the lowest ever recorded nor it is the highest in 2010, which indicates that other factors also affect the annual TC frequency over the WNP basin.
6Summary and discussionsThe effect of several large-scale factors on the extremely low tropical cyclogenesis season observed in 2010 over the WNP basin is examined in this study. Using the GPI index proposed by Emanuel and Nolan (2004), the influence of four factors on TC genesis is investigated for 2010, following Camargo et al. (2007). We find that the GPI can, to some extent, represent the spatial distribution of TC formation but it cannot explain the extremely low TC frequency of 2010. Hence, a better TC genesis index should be developed in a future study. No robust relationship is found between TC number and ENSO, in agreement with previous studies (Chan, 1985; Lander, 1994; Wang and Chan, 2002; Zhao et al., 2010). Further, based on the BDI method proposed by Peng et al. (2012), dynamic factors are found to be more important in differentiating the TC formation over the WNP basin between 2010 and 1994. It may be mainly due to the remarkable difference in monsoon flows in the WNP basin between 2010 and 1994.
The peak season of 2010 was characterized by weak MJO activity, which is known to modulate TC activity in the basin. Previous studies suggested that a weakened MJO-TC relationship and an enhanced relationship are found during developing La Niña and El Niño years, respectively. The lowest TC frequency observed during 2010 is possibly associated with unfavorable environmental conditions and weak MJO activity; however, the physical mechanism responsible for the lowest recorded TC frequency in 2010 remains unclear and should be investigated in the future.
The influence of warm SST anomalies in the tropical Indian Ocean during the peak TC season appears to be the most important factor leading to low TC frequency in 2010. The statistical analyses for the 2010 peak season including the oceanic and atmospheric conditions compared well with Du et al. (2011) and Zhan et al. (2011a, b), and relate to the presence of an anticyclone over the WNP basin and associated with the westward tilt of the monsoon trough caused by the warm tropical Indian Ocean SST anomalies.
As a final comment, also note that the Pacific Decadal Oscillation (PDO) phase has turned decidedly more negative (not shown) and two strong La Niña events have evolved since 2006, which indicates that the PDO may have also contributed to low TC genesis in 2010 (Maue, 2011). While we have noted the possible influences of several factors, it still remains unclear which are the atmospheric and oceanic mechanisms responsible for the observed extremely low TC activity in 2010. A more quantitative analysis and numerical simulations should be carried out in the future. It is noteworthy that 2010 was also a record low year in terms of TC frequency in the eastern Pacific basin. The role of SST in the different basins should be explored as they may relate to the low TC frequency during 2010 throughout the Pacific.
The authors thank valuable comments made by Prof. Pao-Shin Chu and Prof. Liguang Wu on an earlier version of the manuscript. This research was jointly supported by the National Natural Science Foundation of China (Grant No. 41305050), the Key Laboratory of Meteorological Disaster of the Ministry of Education Program (Grant No. KLME1204), and the Priority Academic Program Development of Jiangsu Higher Education Institutions (PAPD). GBR acknowledges the support of the Inter-American Institute for Global Change Research (IAI, Grant CRNII-2048), which is supported by the U.S. National Science Foundation (Grant GEO-0452325). We also thanks the editorial efforts of María Elena Castillo and Alberto Alazraki.