


Se comparan las condiciones térmicas bioclimáticas registradas en las estaciones meteorológicas de Bursa (100 m) y Uludağ (1878 m) a las 7:00, 14:00 y 21:00 horas de 1975 a 2006. Para ello se utiliza la temperatura fsiológica equivalente (TFE), que se calcula por medio de parámetros meteorológicos. Se analizaron y valoraron los efectos de las condiciones ambientales y atmosféricas dependientes de la altura sobre la percepción térmica (i.e., TFE). El análisis mostró que la diferencia anual media de los valores TFE en Bursa y Uludağ fue de 12 ºC. Esta diferencia fue menor en invierno (9 ºC TFE) y mayor en verano (15 ºC TFE). La mayor diferencia en los valores TFE se registró en la tarde (16 ºC TFE) y la menor en la mañana (9 ºC TFE). Las diferencias se deben a la mayor altitud y al mayor albedo debido a las nevadas. Esto ocasiona valores TFE más bajos y por lo tanto condiciones térmicas menos confortables. Los valores TFE medios para Bursa y Uludağ decrecen 0.67 ºC por cada 100 m.
This study compares the thermal bioclimatic conditions recorded at Bursa (100 m) and Uludağ (1878 m) meteorological stations at 7:00, 14:00 and 21:00 LST (local standard time) between 1975 and 2006, by using the physiologically equivalent temperature (PET), which is calculated from meteorological parameters. The effects of elevation-dependent environmental and atmospheric conditions on thermal perception (i.e., PET) values were analyzed and assessed. The analysis showed that the mean annual difference between PET values in Bursa and Uludağ was 12 ºC. The difference was lower in winter (9 ºC PET) and higher in summer (15 ºC PET). The highest difference between PET values occurred in the afternoon (16 ºC PET) and the lowest difference occurred in the morning (8.4 ºC PET). The differences occur as a result of high altitude and higher surface albedo due to snowfall, which leads to lower PET values and thus to less comfortable thermal conditions. The mean PET values of Bursa and Uludağ decrease 0.67 ºC every 100 m.
People’s thermal perception depends on air temperature, air humidity, wind speed and radiation fluxes, as well as their personal body energy balance. When the environmental conditions are suitable for human heat balance, they feel comfortable. Any disruption to this balance results in thermal stress (Fanger, 1972; Landsberg, 1972; Auliciems, 2005). There are indices that use various methods to determine the thermal conditions. These indices use meteorological data to reveal the effects of the ambient conditions on people. While there are rather simple comfort indices calculated by including several meteorological parameters (e.g., heat stress, windchill, apparent temperature), there are also more complex indices that include physiological thermoregulatory reactions as a variable in the calculation: predicted mean vote (PMV) (Fanger, 1972), effective temperature (ET), standard effective temperature (SET) (Gagge et al., 1986) and Klima-Michel-model (KMM) (Jendritzky and Nübler, 1981). There are some bibliographical studies on the historical development and the types of thermal comfort indices that currently exist (Landsberg, 1972; Driscoll, 1992; Parsons, 2003; Auliciems, 2005). The physiologically equivalent temperature (PET) is a thermal index based on the human energy balance; it includes thermo-physiological variables and yields results in centigrade degrees (Mayer and Höppe, 1987; Höppe, 1999; Matzarakis et al., 1999). Thus, as PET analyzes the bioclimatic conditions for a given setting, it also allows for comparisons as it uses variables stemming from human thermophysiology in the calculations and yields concrete results.
The study area of this work lies in the Marmara Region, in northwestern Turkey. Data from two meteorological stations, Bursa and Uludağ, were used. Having an altitude of 100 m, the geographical coordinates of Bursa meteorological station are 40º 11’ N and 29º 04’ E. Uludağ meteorological station has an altitude of 1878m and its coordinates are 40º 08’ N and 29º 05’ E. Even though the city centers of Bursa and Uludağ are close (15 km, air distance), the altitude difference creates different geographical and climatic conditions (Fig. 1). According to Köppen’s climate classification, Bursa has a moderate climate with temperate winter and hot and dry summers. Uludağ, on the other hand, has severe winters and short and humid summers. This study aims to use PET values to compare the bioclimatic conditions of Bursa and Uludağ, which lie close to each other but at different altitudes, and reveal the changes that occur throughout the years. The information acquired from this study will help to understand the changes in thermal comfort conditions according to elevation. In order to find the vertical changes of PET values, the data obtained from the stations that have different altitudes will be very useful. This paper also analyzes the vertical variations of meteorological parameters that have positive and/or negative impact on thermal bioclimatic conditions. The effects of elevation on outdoor conditions can be used also for economical purposes, because Bursa and Uludağ have great potential for tourism and recreational outdoor activities. Although this is the first study that investigates the vertical changes of thermal perceptions, there are many researches that focus on the bioclimatic conditions in several parts of Turkey (e.g., Çiçek, 2003; Topay and Yılmaz, 2004; Yılmaz et. al., 2007; Toy and Yılmaz, 2010). There are also some studies on the spatiotemporal distribution of the climate and the impacts of some issues (urbanization, climate change, deforestation, etc.) on the meteorological parameters in Turkey (e.g., Türkeş et. al., 1995, 2002; Tayanç et. al., 1997, 2009).
2Data and methodology2.1Meteorological data
This study uses air temperature, relative humidity, cloudiness, wind speed, daily maximum temperature, minimum temperature and global radiation data measured daily at 07:00, 14:00 and 21:00 LST (local standard time) between 1975 and 2006 at Bursa and Uludağ meteorological stations. Of the 11 688 items of data available, eight belonging to February 29 on leap years were excluded. Data for each parameter from Bursa meteorological station were used to calculate the daily mean thermal perception (PET) value at 7:00, 14:00 and 21:00 LST on all the 11 680 days included in the study. In Uludağ meteorological station, missing data were excluded from calculations and 11 460 thermal perception values were obtained.
2.2Thermal bioclimatic indexThe role of thermal indices in the concrete explanation of bioclimatic conditions and thus the understanding of human reactions to meteorological variables has long been known (Landsberg, 1972). Büttner (1938) stated that an understanding of the effects of thermal conditions on human heat balance is essential for an understanding of the effects of climate on humans. The term “thermal comfort” refers to human satisfaction with environments that are conducive to dispersing heat produced by human metabolism, thus providing a thermal balance between humans and the environment (ISO, 2002; ASHRAE, 2004).
In this study, the PET index, which starts from human energy balance and uses thermo-physiological variables, was used. PET is essentially based on the Munich Energy Balance Model for Individuals (MEMI) (Höppe, 1999; VDI, 1998) and Gagge’s two-node model (Gagge et al., 1971). It is equal to the reaction of the body thermal balance of a 35-year-old, 175-cm-tall male involved in a 80 W activity and wearing clothing with a 0.9 clo heat resistance, to the conditions in a typical indoor area. Outdoor meteorological conditions are calculated by taking into account the human heat balance. In a typical indoor area, climatic assumptions taken as reference are given below (Höppe, 1999):
- •
Mean radiant temperature is equal to air temperature (Tmrt = Ta).
- •
Air speed (wind) is 0.1m/s.
- •
Water vapor pressure is 12 hPa (water vapor pressure when Ta = 20 ºC and relative humidity is approximately 50%).
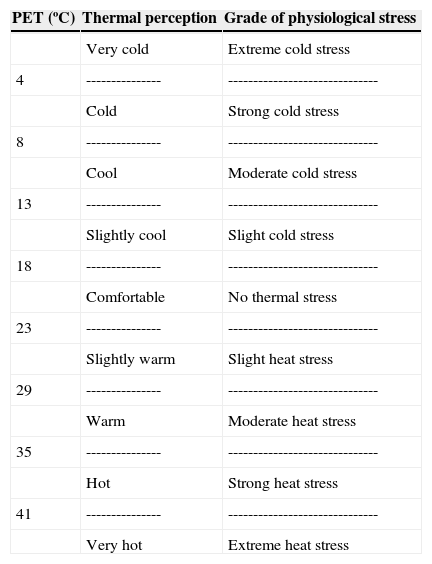
PET values were calculated by using meteorological data on the RayMan program. The RayMan model can calculate thermo-physiological temperature from data such as air temperature, vapor pressure, wind speed and cloudiness or global radiation (Matzarakis et al., 2007, 2010). Thermal perceptions calculated as PET values also include the thermo-physiological effects on humans (Table I). In this study, the PET values obtained for the two stations were represented in monthly frequencies and monthly mean graphics (Lin and Matzarakis, 2008; Zaninović and Matzarakis, 2009; Çalışkan et. al., 2011). In order to examine the distribution over the time in more detail, daily and 10-day mean PET values between 1975 and 2006 were analyzed.
Ranges of physiologically equivalent temperature (PET) for different grades of thermal perception and physiological stress on human beings. Internal heat production: 80 W; heat transfer resistance of the clothing: 0.9 clo (Matzarakis and Mayer 1996, 1997).
| PET (ºC) | Thermal perception | Grade of physiological stress |
|---|---|---|
| Very cold | Extreme cold stress | |
| 4 | --------------- | ------------------------------ |
| Cold | Strong cold stress | |
| 8 | --------------- | ------------------------------ |
| Cool | Moderate cold stress | |
| 13 | --------------- | ------------------------------ |
| Slightly cool | Slight cold stress | |
| 18 | --------------- | ------------------------------ |
| Comfortable | No thermal stress | |
| 23 | --------------- | ------------------------------ |
| Slightly warm | Slight heat stress | |
| 29 | --------------- | ------------------------------ |
| Warm | Moderate heat stress | |
| 35 | --------------- | ------------------------------ |
| Hot | Strong heat stress | |
| 41 | --------------- | ------------------------------ |
| Very hot | Extreme heat stress |
According to the daily mean PET values between 1975 and 2006, the lowest values in both stations occurred in late January, and the highest in late July and early August. The mean annual PET value was 12.9 ºC in Bursa and 0.7 ºC in Uludağ. Daily mean maximum difference between the two stations was 16.5 ºC, daily mean minimum difference was 8.4º, and daily mean difference was 12.1ºC. The difference was lowest during winter (December: 11.3 ºC; January: 10.6 ºC; February: 11.7 ºC). The highest difference between the two stations occurred during summer (June: 13.7 ºC; July: 13.4 ºC; August: 13 ºC). The difference was equal during autumn and spring, which are transition seasons in Bursa (12 ºC). Having a very short summer, Uludağ has mean PET values below zero between October and May (Fig. 2).
.")
The highest thermal perception differences between Bursa and Uludağ occurred at 14:00 LST, and the lowest at 7:00 LST. The daily means of thermal perceptions at 21:00 LST were very close. The differences that occurred at 7:00 LST do not have any seasonal meaning. For instance, the difference was highest in February (9.5 ºC) and June (9.5 ºC), followed by April (8.9 ºC). Thus, the difference was not higher in a specific month. For seven PET values, the lowest differences were seen in September (7 ºC). There was an annual mean difference of 8.4 ºC between the PET values of Bursa and Uludağ at 7:00 LST (Fig. 2).
While the difference of PET values at 14:00 LST in Bursa and Uludağ increased during the summer (June: 18.8 ºC; July: 18.9 ºC; August: 19 ºC), they decreased during the winter (December: 14.4 ºC; February: 14.2 ºC; January: 13.1 ºC). After the summer, the highest differences were seen in autumn (September: 18.6 ºC; October: 17.9 ºC; November: 16.6 ºC). The difference between daily 14:00 LST PET values was relatively low in spring (March: 14.3 ºC; April: 16.1 ºC; May: 16.3 ºC). In this last season, the mean annual difference between PET values was 16.5 ºC. In the period when the air temperature decreased, the difference between thermal perceptions diminished too. On the contrary, differences increased with the rising of air temperature (Fig. 2).
The highest PET values at 21:00 LST were seen in summer (June: 13º C; July: 12.8º C; August: 12.4 ºC). The differences were lower in winter (December: 10.4 ºC; January: 10.6 ºC; February: 11.7 ºC). The annual mean difference at 21:00 LST was 11.5 ºC. Since the differences between summer and winter were not high, a balanced distribution was seen (Fig. 2).
According to the physiological stress degrees that correspond to 7:00, 14:00 and 21:00 LST, as well as the monthly mean PET values in Bursa and Uludağ stations, PETs lower than –10 ºC were seen in Uludağ in mornings and afternoons in December, January and February. This also continued into the afternoons in January. PETs between 0º C and –10 ºC that occur during morning hours in early spring and late autumn, regress to extreme cold and very cold stress towards afternoon, but the stress gains intensity in the evening hours. Moderate cold stress can occur, although rarely, in the middle of the summer in Uludağ. According to monthly PET mean values, a rather different structure exists in Bursa and Uludağ. A short cold stress emerged in morning and evening hours in December, January and February, and decreased towards noon. Starting from late March, cold stress decreased and thermal comfort increased in April and May. Similar conditions prevailed in October. From June through September, comfortable conditions emerged in the morning and evening, giving way to heat stress during afternoon hours. July and August afternoons exhibited intensive heat stress (Fig. 3).
3.2Ten-day frequency of PET values at 07.00, 14.00 and 21.00 LST in Bursa and Uludağ from 1975 through 2006.")
The mean daily PET value frequencies between 1975 and 2006 are displayed in 10-day intervals in Figure 4, which shows the different levels of year-round cold stress in Uludağ. PET values below –10ºC occurred here in December, January and February with 40% frequency, and PET values below zero were seen during this entire period (100%). Conditions without thermal stress emerged in July and August with a low frequency (5-10%), and the remaining months exhibited varying levels of cold stress. From June to August, slight heat stress was rarely seen (0.1-0.5%) (Fig. 4).

Located 1778m below Uludağ, Bursa has higher thermal perception values. In Bursa, where cold and cool conditions prevail from November through the end of March, there was approximately a 50% frequency of days with no thermal stress in May and October. PET values exceeded 23 ºC in June, thus causing heat stress. In July and August, there was approximately a 20-30% frequency of strong heat stress and very rare excessive heat stress (Fig. 4).
According to PET values at 7:00, 14:00 and 21:00 LST in Uludağ, varying levels of cold stress were experienced throughout the year, which became more severe between November and March. Comfortable conditions could be seen in the morning in July and August with a frequency of 5-6%, and moderate cold stress was common in the evening even in midsummer. From October to late April, cold stress occurred in Uludağ even in the afternoon. It was alleviated between May and September. Thermal comfort improved between July and August, and there was a 20-25% frequency of comfortable hours in both months (Fig. 5).

In Bursa, cold stress was generally seen in mornings and evenings between September and May. The stress intensifies in December, January and February, and peaks in January. Thermal comfort values increased during afternoon hours. In April-May and September-October, the frequency of thermal stress not present in the afternoon was 10-15%. The most suitable period for human comfort was during the morning in June and July. Evenings were cool and heat stress occurred in the afternoon. Particularly in July and August, there was a 20% frequency of heat stress in the afternoon (Fig. 5).
4DiscussionThe relationship between air temperature and elevation is generally explained trough the lapse rate, which is mainly formed as a result of atmosphere heating up to 70% from the earth surface. Thus, temperature falls as one gets farther away from the heat source. Temperature has been shown to fall approximately 0.3 ºC every 100m in free atmosphere within a wet adiabatic lapse rate, and 1 ºC within a dry adiabatic lapse rate (Fairbridge and Oliver, 2005). As it is easy to understand, explain and use, the lapse rate is generally accepted to be 0.5ºC/100 m. Depending on the lapse rate in free atmosphere and the altitude of locations, temperature changes can be different. The relationship between the altitude of a place and its climate is more complex and controlled by factors such as the greenhouse gases in the atmosphere or atmospheric boundary layer and the different heat exchange rates.
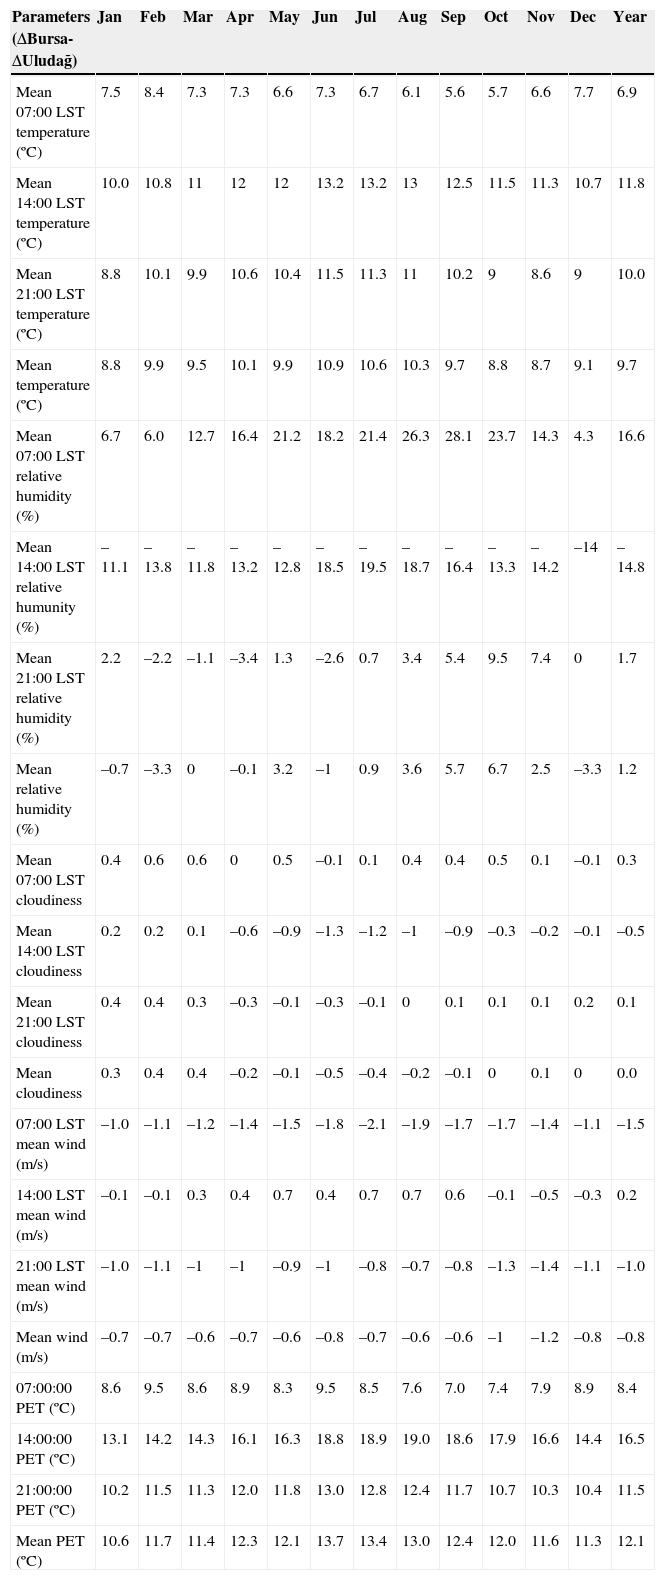
PET values calculated by using air temperature, relative humidity, cloudiness, wind speed, daily maximum temperature, minimum temperature and global radiation data recorded daily at 7:00, 14:00 and 21:00 LST in Bursa and Uludağ meteorological stations between 1975 and 2006, show that Uludağ has much colder bioclimatic conditions than Bursa. The most important reason for this is the difference in altitude between them. Being 1778m higher than Bursa (100 m), Uludağ ’s (1878 m) annual mean temperature (Ta) is 9.7 ºC lower. The thermal perception (PET) difference between the two stations is 12.1 ºC. Uludağ is colder than Bursa, and perceived colder mainly because of the thinner atmosphere layer and thus the smaller greenhouse concentration above it. Long wavelength radiation from the earth, conduction, convection and latent heat transfer keep less transmitted heat. This is best displayed by the difference in PET values between the two stations, which peaks in summer afternoons when the incoming solar energy is highest. During morning hours, when global radiation is relatively low, the differences are also lower (Table II).
Differences between Bursa and Uludağ according to various meteorological parameters and PET values.
| Parameters (ΔBursa-ΔUludağ) | Jan | Feb | Mar | Apr | May | Jun | Jul | Aug | Sep | Oct | Nov | Dec | Year |
|---|---|---|---|---|---|---|---|---|---|---|---|---|---|
| Mean 07:00 LST temperature (ºC) | 7.5 | 8.4 | 7.3 | 7.3 | 6.6 | 7.3 | 6.7 | 6.1 | 5.6 | 5.7 | 6.6 | 7.7 | 6.9 |
| Mean 14:00 LST temperature (ºC) | 10.0 | 10.8 | 11 | 12 | 12 | 13.2 | 13.2 | 13 | 12.5 | 11.5 | 11.3 | 10.7 | 11.8 |
| Mean 21:00 LST temperature (ºC) | 8.8 | 10.1 | 9.9 | 10.6 | 10.4 | 11.5 | 11.3 | 11 | 10.2 | 9 | 8.6 | 9 | 10.0 |
| Mean temperature (ºC) | 8.8 | 9.9 | 9.5 | 10.1 | 9.9 | 10.9 | 10.6 | 10.3 | 9.7 | 8.8 | 8.7 | 9.1 | 9.7 |
| Mean 07:00 LST relative humidity (%) | 6.7 | 6.0 | 12.7 | 16.4 | 21.2 | 18.2 | 21.4 | 26.3 | 28.1 | 23.7 | 14.3 | 4.3 | 16.6 |
| Mean 14:00 LST relative humunity (%) | –11.1 | –13.8 | –11.8 | –13.2 | –12.8 | –18.5 | –19.5 | –18.7 | –16.4 | –13.3 | –14.2 | –14 | –14.8 |
| Mean 21:00 LST relative humidity (%) | 2.2 | –2.2 | –1.1 | –3.4 | 1.3 | –2.6 | 0.7 | 3.4 | 5.4 | 9.5 | 7.4 | 0 | 1.7 |
| Mean relative humidity (%) | –0.7 | –3.3 | 0 | –0.1 | 3.2 | –1 | 0.9 | 3.6 | 5.7 | 6.7 | 2.5 | –3.3 | 1.2 |
| Mean 07:00 LST cloudiness | 0.4 | 0.6 | 0.6 | 0 | 0.5 | –0.1 | 0.1 | 0.4 | 0.4 | 0.5 | 0.1 | –0.1 | 0.3 |
| Mean 14:00 LST cloudiness | 0.2 | 0.2 | 0.1 | –0.6 | –0.9 | –1.3 | –1.2 | –1 | –0.9 | –0.3 | –0.2 | –0.1 | –0.5 |
| Mean 21:00 LST cloudiness | 0.4 | 0.4 | 0.3 | –0.3 | –0.1 | –0.3 | –0.1 | 0 | 0.1 | 0.1 | 0.1 | 0.2 | 0.1 |
| Mean cloudiness | 0.3 | 0.4 | 0.4 | –0.2 | –0.1 | –0.5 | –0.4 | –0.2 | –0.1 | 0 | 0.1 | 0 | 0.0 |
| 07:00 LST mean wind (m/s) | –1.0 | –1.1 | –1.2 | –1.4 | –1.5 | –1.8 | –2.1 | –1.9 | –1.7 | –1.7 | –1.4 | –1.1 | –1.5 |
| 14:00 LST mean wind (m/s) | –0.1 | –0.1 | 0.3 | 0.4 | 0.7 | 0.4 | 0.7 | 0.7 | 0.6 | –0.1 | –0.5 | –0.3 | 0.2 |
| 21:00 LST mean wind (m/s) | –1.0 | –1.1 | –1 | –1 | –0.9 | –1 | –0.8 | –0.7 | –0.8 | –1.3 | –1.4 | –1.1 | –1.0 |
| Mean wind (m/s) | –0.7 | –0.7 | –0.6 | –0.7 | –0.6 | –0.8 | –0.7 | –0.6 | –0.6 | –1 | –1.2 | –0.8 | –0.8 |
| 07:00:00 PET (ºC) | 8.6 | 9.5 | 8.6 | 8.9 | 8.3 | 9.5 | 8.5 | 7.6 | 7.0 | 7.4 | 7.9 | 8.9 | 8.4 |
| 14:00:00 PET (ºC) | 13.1 | 14.2 | 14.3 | 16.1 | 16.3 | 18.8 | 18.9 | 19.0 | 18.6 | 17.9 | 16.6 | 14.4 | 16.5 |
| 21:00:00 PET (ºC) | 10.2 | 11.5 | 11.3 | 12.0 | 11.8 | 13.0 | 12.8 | 12.4 | 11.7 | 10.7 | 10.3 | 10.4 | 11.5 |
| Mean PET (ºC) | 10.6 | 11.7 | 11.4 | 12.3 | 12.1 | 13.7 | 13.4 | 13.0 | 12.4 | 12.0 | 11.6 | 11.3 | 12.1 |
Humidity is one of the most important components of thermal perception. In addition, water vapor is the most common greenhouse gas found in the atmosphere. It affects the temperature not only through its role in keeping and redistributing long wave radiation from the earth, but also with conduction and latent heat transfer. As the air cools, so does its humidity content. Relative humidity is higher in Bursa in the morning and evening and higher in Uludağ in the afternoon. According to annual means, Uludağ has 14.8% higher relative humidity in the afternoon. Even though the humidity conditions in Uludağ increase the thermal perception values, it has 165 snow-covered days annually. For this reason, the mean temperature decreases and thus PET values diminish. Snow cover, which has the highest albedo rate (75-95%), prevents the ground and air from heating by reflecting radiation at a short wave length (Sellers, 1965). In Bursa, the average number of snow-covered days in one year is only 10. Another important climatological event caused by humidity in the atmosphere is cloudiness. It may affect the temperature balance of a given place negatively by reflecting the energy from the sun, or positively by keeping the heat released by the ground. According to annual mean values, cloudiness is more common in Bursa in the morning and evening and in Uludağ in the afternoon. In the summer, when the difference between the thermal perception values in Bursa and Uludağ is highest, the latter is one-tenth to 1.3-tenths more overcast at 14:00 LST. This finding also supports that the increasing difference between PET values is due to the increase in the radiation rate that reaches Bursa (Table II).
Another important meteorological parameter that affects PET values is wind speed. Blowing 0.8m/s faster on average annually in Uludağ, the wind changes in favor of Bursa in the afternoon. Particularly between March and September, differences can reach 0.7m/s. The main reason is that although the fastest wind blows at 14:00 LST throughout the year in Bursa (annual mean 3m/s, summer mean 3.6m/s), it blows at a similar speed in Uludağ throughout the day (annual mean 2.7m/s). This happens because the pressure difference causes the wind to blow from Uludağ to Bursa. The temperature difference caused by elevation is the most important factor of this feature. The cooling afternoon wind has an important role in the reduced heat stress experienced on summer evenings (Table II).
Another factor that infuences Bursa and Uludağ ’s climatic characteristics is the altitude of the planetary boundary layer (PBL), which may change between 1000 and 2000m from the surface depending on topography and latitude (Balling and Cerveny, 2005). As Bursa leans against Uludağ but is located in a tectonic plain, its PBL is higher and its wind and turbulence develop more slowly and in a larger layer owing to heat transfer. On the other hand, PBL develops much lower in Uludağ, particularly in winter, and wind and turbulence move faster and in a more narrow area. As a result, low PET values appear particularly between October and April thus leading to extreme cold stress.
Although independent from elevation, Bursa’s urban and Uludağ ’s rural locations constitute another factor that affects PET values and needs to be emphasized. Urban areas are different from rural areas regarding their texture (type and color of surface material) and pattern (surface geometry and topography). The absorption of radiation is also more complex in cities. Increased surface area, higher heat absorption by artifcial surfaces, increased radiation transfer due to canyon geometries, increased mean radiant temperature, urban patterns that obstruct the wind, decreasing relative humidity, and the presence of more greenhouse gases and emissions in the atmosphere (Landsberg, 1981; Oke, 1997) make physiological equivalent temperatures increase. As a result, rural areas get heated and cooled more quickly than urban areas.
The results of this study agree with those of Zaninović et. al. (2006) from the analysis of climatic and bioclimatic conditions, trends and variability in the mountainous areas of Croatia and Slovenia during the period 1955-2004. Similar to Uludağ, Zavi¢zan (1594m asl) in the Croatian Dinaric Alps and Kredarica (2514m asl) in the Slovenian Julian Alps, have very cold thermal conditions, varying from very cold winters to cold and cool summers. Very cold stress is dominant in both stations from September to May, as in Uludağ. Similarly, Matsoukis et. al. (2009) have found that mountainous Nafpaktia region (676-1455 m) provided clearly improved air temperature and thermal comfort conditions in comparison with Athens during the period July 1-August 31, 2006. The relation between Bursa and Uludağ can also be compared with the bioclimatic conditions of Freiburg (269m asl) and Feldberg (1493m asl), in Germany. Endler et. al. (2010) found that the cold stress (PET < 0 ºC) in Feldberg (123 days per year) was two times greater than in Freiburg (59 days per year), while the heat stress (PET > 35 ºC) was two times smaller (nine and 19 days per year, respectively) during the period 1961-1990. The thermally acceptable days (18 ºC > PET > 29 ºC) in Feldberg (61 days per year) are less than in Freiburg (84 days per year) because of its altitude. Kamoutsis et al. (2010) have studied human thermal comfort conditions in two different mountainous regions in Greece during the summer. They found that areas about 1340m asl are more suitable for tourism and recreation activities. Likewise, thermal perceptions in Uludağ are more pleasant than in Bursa during summer afternoons.
The results are presented in 10-day intervals (decas) because of their closer relation to holiday and visitors periods. An analysis based on monthly resolution is not detailed enough for tourism and recreation (Lin and Matzarakis, 2008; Zaninovic and Matzarakis, 2009).
5ConclusionsAccording to the analysis of bioclimatic conditions in Bursa and Uludağ, the latter has thermal conditions that cause cold stress most of the year. Even in the summer, severe cold stress is experienced in the mornings and particularly in the evenings. Despite this, comfortable conditions prevail during the summer afternoon hours. The different energy budget of the surface in Uludağ owing to its altitude and the mostly higher surface albedo owing to snowfall cause lower PETs and thermally uncomfortable conditions.
Located 1778m below Uludağ, Bursa experiences heat stress during summer afternoon hours, particularly throughout July and August. Bursa has also a high frequency of excessive heat stress. This being said, mornings and evenings during the same time of the year may have comfortable, even cool, conditions. Between November and March, lower levels of cold stress may occur. Morning hours are colder in this season than evening hours. In autumn and spring, afternoon hours witness thermally favorable conditions for human health. Between December and February, slight cold stress may be felt.
There is a 12 ºC thermal comfort difference between Bursa and Uludağ, which decreases to 9 ºC in winter and increases to 15 ºC in summer. The weather in Uludağ seems to be 13 ºC cooler to a person who suffers from the heat of Bursa in July (temperature, humidity, wind, cloudiness). In January, on the other hand, those who think Bursa is cold should feel better knowing that Uludağ is 11 ºC colder. The mean PET values of Bursa and Uludağ decrease 0.67 ºC every 100 m. The differences between PET values in both locations are higher than air temperature, showing the importance of using a thermal index instead of air temperature.