


Una representación apropiada de las fuentes de polvo es necesaria para predecir adecuadamente la concentración de partículas en simulaciones de resuspención de polvo. El modelo Weather Research and Forecasting with Chemistry (WRF/Chem) incluye un mapa de erosionabilidad basado en la topografía del terreno, originalmente desarrollado para simulaciones de escala global, y que en consecuencia no representa apropiadamente la distribución geográfica de fuentes de polvo en Argentina. Por lo tanto, en este trabajo se desarrolla un método para obtener un mapa de erosionabilidad de alta resolución apropiado para simulaciones de escala regional o local con el modelo WRF/Chem. Presentamos dos aproximaciones independientes basadas en métodos globales para estimar la erosionabilidad del suelo a partir de información satelital; una basada en un modelo topográfico de la Shuttle Radar Topography Mission (SRTM) y la otra basada en reflectancia del suelo del instrumento Moderate Resolution Imaging Spectroradiometer (MODIS). Se utilizó la simulación de un evento severo de viento Zonda en la zona árida del centro-oeste de Argentina para analizar estos métodos. La concentración de material particulado simulada se comparó con mediciones realizadas en la ciudad de Mendoza. Además, se utilizó información de espesor óptico de aerosoles (AOD, por sus siglas en inglés) para estudiar el desempeño del modelo para reproducir la distribución espacial de las emisiones de polvo. El mapa basado en reflectancia de MODIS mejora la representación de las características en pequeña escala y mejora las predicciones de inyección de aerosoles con relación al mapa original. La simulación realizada con dicho mapa arrojó valores de concentración que coinciden con las mediciones puntuales y la distribución espacial de AOD.
A proper representation of dust sources is critical to accurately predict atmospheric particle concentration in regional windblown dust simulations. The Weather Research and Forecasting model with Chemistry (WRF/ Chem) includes a topographic-based erodibility map originally conceived for global scale modeling, which fails to identify the geographical location of dust sources in many regions of Argentina. Therefore, this study aims at developing a method to obtain a high-resolution erodibility map suitable for regional or local scale modeling using WRF/Chem. We present two independent approaches based on global methods to estimate soil erodibility using satellite retrievals, i.e. topography from the Shuttle Radar Topography Mission (SRTM) and surface reflectance from the Moderate Resolution Imaging Spectroradiometer (MODIS). Simulation results of a severe Zonda wind episode in the arid central-west Argentina serve as bases for the analysis of these methods. Simulated dust concentration at surface level is compared with particulate matter measurements at one site in Mendoza city. In addition, we use satellite aerosol optical depth (AOD) retrievals to investigate model performance in reproducing spatial distribution of dust emissions. The erodibility map based on surface reflectance from MODIS improves the representation of small scale features, and increases the overall dust aerosol loading with respect to the standard map included by default. Simulated concentrations are in good agreement with measurements as well as satellite derived dust spatial distribution.
Arid and semiarid lands all over the world annually inject large quantities of dust aerosols into the atmosphere. Atmospheric mineral dust has significant impact on human health (Chen et al., 2004;Karanasiou et al., 2012), transportation and visibility (Kim et al., 2001), marine ecology (Nezlin et al., 2010) and atmospheric environment dynamics (Wang et al., 2002). Moreover, sand and dust particles change the radiation balance of the earth-atmosphere system through absorbing and scattering solar and atmospheric long-wave radiations, thus leading to significant impact on short-term weather systems and long-term climate change (Tegen et al., 1996;Perrone and Bergamo, 2011;Choobari et al., 2014). Therefore, understanding ofthe production, transport and atmospheric life cycle of dust is essential to properly evaluate and anticipate any global or local effect (Choi et al., 2006).
Air quality models are useful tools to understand atmospheric transport of pollutants. The Weather Research and Forecasting model coupled with Chemistry (WRF/Chem) (Grell et al., 2005;Peckham et al., 2010) includes a dust emission scheme adapted from the Georgia Tech/Goddard Global Ozone Chemistry Aerosol Radiation and Transport (GOCART) model (Ginoux et al., 2001, 2004;Grini et al., 2005), and modified for fine scale simulations by the United States Air Force Weather Agency (AFWA) (Jones et al., 2011). Within the WRF/Chem framework, dust sources are included by the user through an external erodibility map representing soil susceptibility to wind erosion. Prior studies developed and tested global dust sources distribution maps relating dust emissions to surface features, as seen in the work by Ginoux et al. (2001), who hypothesize that loose sediments have deposited on topographic lows, and Grini et al. (2005) who stated that erodibility is correlated with surface reflectance. Other studies compared erodibility factors derived from land surface features other than topography and reflectance, such as geomorphology, hydrology, aerodynamic roughness and activation frequency (Zender et al., 2003a;Laurent et al., 2005;Schepanski et al., 2007). The global erodibility map developed by Ginoux et al. (2001) is the only one available by default for dust simulations in WRF/Chem. Such map works well on large-scale regions (i.e., Sahara desert, Arabian peninsula) (Alizadeh-Choobari et al., 2014); however, it fails to identify relevant dust sources on smaller regions, mainly in fine-scale simulations with grid resolutions in the order of10 km (Huang et al., 2013). At these grid resolutions, the standard WRF/Chem erodibility map results in an underestimation of dust emissions in many regions of Argentina, mainly in complex terrain areas close to the Andes range. The improper model behavior is in part related to the coarse resolution (1° × 1°) of the erodibility map, which does not reflect correctly the spatial patterns of local dust sources at grid resolutions of tens of kilometers. Additionally, local studies of desertification hazard show that, in Argentina, land susceptibility to wind erosion extends from north-west to south (Abraham et al., 2011), whether the WRF/Chem standard map presents dust source areas mainly located in the south-east. Therefore, a dust erosion simulation with WRF/Chem using the erodibility map given by default is not expected to predict spatial patterns of dust concentrations in regional or fine scale simulations in Argentina properly.
The present research proposes a general method to generate a high resolution erodibility map suitable for fine scale simulations using WRF/Chem in Argentina. Three erodibility maps are developed based on two different hypotheses: one based on terrain elevation differences and the other on soil reflectivity. Results of WRF/Chem dust simulations using the new erod- ibility maps are compared with those obtained using the standard erodibility map included by default. In order to avoid interferences from other sources of particulate matter, a strong Zonda wind episode over the semiarid central-west part of Argentina was reproduced. Particulate matter measurements at one site in Mendoza city serve as bases for the analysis of WRF/Chem performance. Predicted spatial distribution of dust is also validated using the Moderate Resolution Imaging Spectroradiometer (MODIS) aerosol optical depth (AOD) product.
2Dust emission scheme in WRF/ChemSoil erodibility conceptually represents the way in which soil reacts to erosion agents. Hence, erodibility depends on the processes involved when erosion takes place and consequently its definition depends on the mathematical parametrization chosen to include such process in the model (Borselli et al., 2012). Here, the erodibility factor (S) is defined as the ratio of the dust emissions observed or modeled relative to the emissions of an equal area of perfectly erodible surface (Zender et al., 2003a,b). Erodibility factors range from 0, for areas that do not emit dust (e.g., rocky soil and wetlands), to 1, for areas with loose sediments (e.g., deserts). From the point of view of modeling, S is a weighting factor used to geographically distribute total global dust emission sources.
The AWFA dust emission scheme in WRF/Chem is based on work done by Marticorena and Bergametti (1995), who investigated dust production and linked it to saltation bombardment (sandblasting) as an intermediate process producing the rupture of the inter-particle bonds that keep dust particles together or adhered to the surface. Initially, the AFWA scheme calculates a threshold friction velocity at which soil particles begin to move within each grid cell. Threshold friction velocity is a function of dust density, particle diameter, the presence of roughness elements on the land surface and soil moisture (Jones et al., 2011). Soil related variables, such as soil temperature and soil moisture, are calculated by the land surface model coupled to WRF/Chem and passed to the dust emission scheme (Grell et al., 2005).
Then, the AFWA scheme computes the intensity of saltation flux, only when the friction velocity is greater than the corrected threshold friction velocity (Kawamura, 1951). The total horizontal flux (G) is then computed by integrating the flux on a range of particle diameters. The final bulk vertical flux (Fbulk), composed by the finest particles setting in suspension from the saltation layer, is estimated according to Gillette and Passi (1988):

where S is the erodibility factor at every grid cell, also called source function. This equation is corrected with a mass sandblasting efficiency (α), estimated with the soil clay content. The constant tuning factor (CF) is imposed to adjust simulated concentration to global dust load measurements. Total dust mass emitted (E) is distributed into dust particle size bins using lognormal distribution (Kok, 2010):
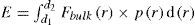
where p(r) is the lognormal particle size distribution in each dust bin, d1 and d2 are the lower and upper diameter limits of emitted particles. The effective radius of the five bins included in the WRF/Chem GOCART scheme are: 0.5, 1.2, 2.4, 4.5 and 8 μm. Finally, the overall emission within each bin is injected to the lowest model level, and the chemical module computes the dispersion.
3Development of high-resolution erodibility mapsBased on formulations by Ginoux et al. (2001) and Grini et al. (2005) we developed erodibility maps with a spatial resolution of 5 km. Such maps overcome the limitations observed on the dust emission patterns simulated with the standard erodibility map included in WRF/Chem over different regions in Argentina. The following section discusses two different approaches to build these high-resolution erodibility maps using remote sensing data: the first based on topography and the second based on surface reflectance. For the last method, two alternatives are investigated.
3.1Topographic soil erodibilityUsing a global elevation database with a 1° × 1° spatial resolution, Ginoux et al. (2001) proposed the following formulation for the erodibility factor:
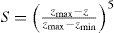
where S is the erodibility factor at each grid cell, z is the terrain elevation at that same cell, zmax and zmin are the highest and lowest points, respectively, in the surrounding (10° × 10°) area. The purpose of the exponent is to enhance contrast between high and low erodibility factors.
The result of such processing is that elevated points influence large areas, possibly masking local sources of dust (Ginoux et al., 2001). Therefore, to identify more accurately local dust sources for high resolution studies, the algorithm described in Eq. (3) was applied to elevation data from the Shuttle Radar Topography Mission (SRTM) (Rodríguez et al., 2005) at 90-m resolution. For this work, elevation data was previously interpolated to a 5-km resolution grid, which is good enough to characterize fine resolution domains in WRF/Chem. We used a kernel size of 50 × 50 km or 10 × 10 grid points in order to keep an identical ratio to pixel size than the one used in the original erodibility database. The erodibility factors obtained with this method (from now on referred to as SSRTM) are up to six times higher than those in the original database. Overall, the geographical distribution of erodibility is enhanced in the SSRTM map with respect to that in the standard map (SStandard) included by default (Fig. 1). This new approach increases erosion efficiency within the Andes mountain range in western Argentina and highlights river basins more. The variability over the whole region is also increased, and the erodibility factors for the southern Patagonia region are reduced as shown in Figure 1b.
3.2Erodibility factor based on soil reflectance Standard global database (SStandard); (b) using high resolution SRTM elevation data (SSRTM); (c) using a linear function of surface reflectance from MODIS (SMODIS-LNR), and (d) using a squared function of surface reflectance from MODIS (SMODIS-SQR).")
An alternative hypothesis to dust sources related to topographic lows was proposed by Grini et al. (2005), based on the assumption that erodibility is correlated with surface reflectance, which in turn depends on land use and land cover (LULC). Following this reasoning, we built erodibility factors using the MODIS eight-days average surface reflectance product MOD09 (Vermote et al., 2002). Although Grini et al. (2005) used yearly average reflectance, we chose to use the monthly average reflectance for the specific modeled period. In this way, the erodibility of soil so derived may hold information about seasonality of land cover and changes in land use. Additionally, we used a snow mask to identify and remove areas with high reflectivity that otherwise would have been considered as highly erodible soil.
The resulting erodibility map showed high erod- ibility factors over most cultivated areas, mainly the ones covered with sugarcane in the northern part ofthe country. Therefore, the MODIS 16-day normalized difference vegetation index (NDVI) data product (MOD31A1) (Huete et al., 1994) was used to weight the source functions, obtaining the following:
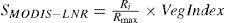
where Ri is the reflectance of pixel i, Rmax is the maximum reflectance found in the Sahara, VegIndex is a coefficient that linearly goes from 0, for highest NDVI, to 1, for lowest NDVI. Eq. (5) is equivalent to Eq. (4), but the exponent enhances contrast. Zender et al. (2003b) used a similar approach to weight erodibility factors with vegetation fraction. Even though the WRF/Chem surface model also includes vegetation fraction, we decided to use the satellite-derived NDVI product in order to keep track of the vegetation seasonality and the local changes in LULC. Additionally, the erodibility maps developed using only satellite products (i.e., topography from SRTM; surface reflectance and NDVI from MODIS) are independent of WRF/Chem internal variables, and can be used in other regional models (Yin et al., 2007).
Fig. 1c-d shows the two erodibility maps resulting from Eqs. (4) and (5) above, namely SMODIS-LNR and SMODIS-SQR, respectively. Dust source distribution is similar, given that both expressions are equivalent, but the linear equation gives higher absolute values. Both maps show highly erodible soil in the south of Argentina and very low in the northeast part of the area, where NDVI is higher. Soil erodibility maps based on surface reflectance are in better agreement with studies of desertification in Argentina (Oldeman et al., 1990;Abraham et al., 2011).
3.3Soil particle size distributionThe WRF/Chem dust scheme formulation requires the erodibility factor to be split into three layers representing the proportion of sand, clay and silt content of soil. Such soil composition is used by the AFWA scheme to calculate the threshold friction velocity for each particle size class. In order to meet that requirement, we used the most recent soil type classification map offered by the National Institute for Agriculture Technology (INTA) (Cruzate et al., 2007). We reclassified INTA categories into sand, clay and silt following the soil texture classification system by the United State Department of Agriculture (USDA, 1987).
4WRF/Chem simulation of windblown dustIn order to test the developed erodibility maps, dust only simulations with version 3.5.1 of WRF/Chem (Grell et al., 2005) were performed for a typical Zonda wind episode affecting the city of Mendoza, Argentina (32.8° S, 68.8° W). Zonda wind episodes take place in the eastern slope of the Andes mountain range at mid latitudes of South America, especially between 30-36° S. This wind is produced by the adiabatically warming of descending cold and humid air towards the lee side of a mountain range (Seluchi et al., 2003;Norte et al., 2008). As a consequence, the Zonda wind lifts and transports large amounts of dust, affecting a large geographical region, including the Argentine western provinces of Mendoza and San Juan, mostly covered by semiarid areas. WRF/Chem has been previously used in the simulation of Zonda wind events in Argentina. Fernández et al. (2012) and Puliafito et al. (2015) show that the model is capable of reproducing the typical air temperature, relative humidity and wind speed/direction changes associated with this phenomenon.
4.1Model configurationWe run simulations of a Zonda event that hit Mendoza, Argentina on May 31, 2013. Two nested domains were setup to downscale the physical properties of the atmosphere from reanalysis data. The coarser one (36-km grid spacing) covers west-center Argentina, (centered at 34.1° S, 64.5° W [1800 × 2160 km2]). The finer one (12-km grid spacing) covers the Mendoza province (centered at 32.9° S, 68.5° W [168 × 264 km2]) (Fig. 2). Both domains have 50 vertical sigma levels up to 50 hPa. Meteorological initial and boundary conditions were taken from reanalysis from ERA-Interim (Dee et al., 2011) at 0.7° resolution every 6 h. Analysis nudging was set in the coarse domain for temperature, wind components and moisture. Nudging is not set in the planetary boundary layer (PBL) in order to avoid interferences with resolved mesoscale forcing in the model, which are important to boundary layer development (Choobari et al., 2012).

The complex topography in western Argentina requires the use of an accurate terrain elevation description. Thus, the Shuttle Radar Topography Mission (SRTM) data (Rodríguez et al., 2005) was included through the WRF Preprocessing System (WPS). For this simulation, land use classification was derived from the GLOBCOVER 2009 land cover map of the European Space Agency (Arino et al., 2010), which has 280 m of spatial resolution. This LULC map specifies 22 classes defined by the United Nations Classification System (UN-LCCS). These classes were matched to those in the United States Geological Survey (USGS) classification scheme (Anderson et al., 1976), which is widely used for WRF/Chem simulations. Urban areas were remapped in the final LULC map using nighttime light data from the Defense Meteorological Satellite Program-Operational Linescan System (DMSP-OLS), to achieve a more realistic representation of urban areas (NOAA-NGDC, 2010).
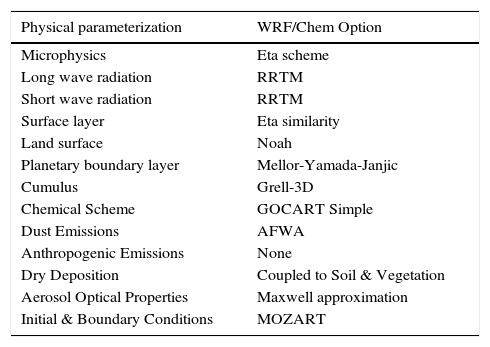
Initial and boundary conditions of dust for the coarser domain were taken from the MOZART model (Emmons et al., 2010), which includes a similar implementation to that of the GOCART aerosol scheme. In order to avoid interferences, all other additional sources of aerosols and particles besides the five dust particle size bins were set to zero. Simulations were performed using the GOCART simplified scheme of WRF/Chem (chem_opt = 300) (Peckham et al., 2010). The complete model parameterization setup is summarized in Table I.
WRF/Chem physical and chemical parameterization used in the simulations.
| Physical parameterization | WRF/Chem Option |
|---|---|
| Microphysics | Eta scheme |
| Long wave radiation | RRTM |
| Short wave radiation | RRTM |
| Surface layer | Eta similarity |
| Land surface | Noah |
| Planetary boundary layer | Mellor-Yamada-Janjic |
| Cumulus | Grell-3D |
| Chemical Scheme | GOCART Simple |
| Dust Emissions | AFWA |
| Anthropogenic Emissions | None |
| Dry Deposition | Coupled to Soil & Vegetation |
| Aerosol Optical Properties | Maxwell approximation |
| Initial & Boundary Conditions | MOZART |
Model results were compared with particulate matter (PM10) concentration measurements from a monitoring station located in a semi-urban, residential area of Mendoza. The station has a GRIMM portable dust monitor (Grimm and Eatough, 2009). We also used surface meteorological observations provided by the SAME 84718 station of the Servicio Meteorológico Nacional (National Meteorological Service, SMN) to validate WRF/Chem meteorological results.
5Results and discussionThe two relevant aspects to evaluate the improvements introduced by the high resolution erodibility maps are (i) near surface concentration of dust particles during the Zonda episode and (ii) spatial distribution of the aerosol column within the simulated region. To test the model performance at the surface we used PM10 measurements at one site in Mendoza city, while for the spatial distributions we used AOD from MODIS-Terra.
5.1Soil moisture in WRF/ChemPreliminary simulations with WRF/Chem of strong wind episodes showed severe underestimation of dust injection independently of the erodibility map used. We found that such underestimation of dust flux was related to a wet bias in reanalysis surface data. (Angevine et al., 2014). Soil moisture is a key component in dust flux calculation (Grini et al., 2005;Choi and Fernando, 2008), which is computed by the land surface model coupled to WRF/Chem. The Noah land surface model used in this study provides soil moisture and soil temperature at four different layers (Grell et al., 2005). Soil moisture and temperature initial conditions are given by reanalysis data. Mean values of soil moisture input were approximately 0.23 m3 m-3, near the field capacity for soil types found in the area under study (Greve et al., 2013). In order to avoid possible underestimation of dust emission as a consequence of overestimation of soil moisture, the coarser domain was spun up for one month, beginning on May 1, as suggested by Angevine et al. (2014). In this way, the land-surface model has enough time to bring down soil moisture to equilibrium. Domain 2 begins on May 27, and it takes soil moisture initial condition from domain 1. Fig. 3 shows mean soil moisture over the coarse resolution domain for the simulation using one-month spin up. Soil moisture decreases continuously from 0.27 to 0.14 m3 m-3.

In order to further illustrate the effect of soil moisture in simulated PM10 concentration, we performed two simulations with different setup: the first without spin up, beginning on May 27; the second with a spin up of one month, both using the SSRTM erodibility map. We computed the ratio of PM10 concentration from the simulation with one-month spin up to that of the simulation with no spin up. Fig. 3 shows that the simulated PM10 concentrations for the case with no spin up are up to 20 times lower, with a mean ratio of 10, approximately. Thus, all the simulations conducted in this study were performed using a spin up of one month in the coarse domain.
5.2Meteorological validationIn order to assess the improvements and advantages of using the developed high resolution erodibility maps on simulated windblown dust events, we first need to analyze the WRF/Chem performance in reproducing the Zonda extreme event. Puliafito et al. (2015) show that current configuration of the model reproduces wind speed and direction reasonably well during Zonda events. For this simulation, mean bias error in wind speed is 1.2 m s-1; the root mean square error is 2.2 m s-1; the correlation is 0.8. The index of agreement for meridional and zonal components of wind speed are 0.46 and 0.54, respectively. These results are in agreement with those reported by Puliafito et al. (2015). Fig. 4 shows simulated and measured wind speed and direction between May 28 and June 2. Even though WRF/Chem slightly overestimates wind speed on days previous to the arrival of the Zonda wind on May 31, 2013, it correctly reproduces wind speed and direction during the Zonda, with prominent north and west components and hourly wind gusts above 10 m s-1.
5.3In situ particle measurements
We integrated the five dust particle size bins in the WRF/Chem output in order to compare model results with PM10 measurements from a monitoring site in the city of Mendoza. Fig. 5a shows PM10 measured and simulated concentrations from May 28 to June 2. Typically, measurements show peaks of concentration in the late afternoon as a consequence of high traffic. However, on May 31, a peak of PM10 is registered at about 04.00 LT (LT = UTC-3). This high PM10 concentration is a consequence of the Zonda wind entering the region. Fig. 5b shows that PM10/PM2.5 ratio during the Zonda event is two times higher than the hourly mean PM10/PM2.5 calculated during the measuring campaign. Such increase of the PM10/PM2.5 ratio implies that coarse mode particles are predominant during the Zonda event. On the other hand, on days previous and following the event, even though PM10 concentration is comparable to that registered during the Zonda, the relative contribution of fine particles, which are related to mobile sources, is larger. Simulated PM10/PM2.5, not shown here, remains constant since no additional sources other than soil erosion were included in WRF/Chem. When wind speed rises, dust is effectively uplifted in the model and transported from erodible regions to the city of Mendoza. PM10 modeled peaks appear on May 29 and May 31, the second one coincidentally with the Zonda arrival. All modeled scenarios (i.e., considering different erodibility maps: SStandard, SSRTM, SMODIS-LNR and SMODIS-SQR) show similar temporal behaviors, but the magnitude and duration of dust concentration peaks strongly depend on the exact location of areas with loose sediments within each erodibility map.
 Simulated and measured PM10 concentration. The arrow labeled Z indicates the Zonda event. (b) Time series of PM10/PM2.5 ratio (empty circles) and hourly average during the measurement campaign (dotted line).")
The Standard run gives the lowest concentration values, resulting in a severe underestimation of PM10 when compared with measured concentration. Indeed, simulated PM10 concentrations with the SStandard map remain always below 15 μg m-3. Such underestimation indicates that the standard map does not represent well erodibility factors in Argentina. Other studies also suggest that west and south regions are the main dust emission areas in the country (Oldeman et al., 1990;Roig et al., 1991;Abraham et al., 2011). Dust concentrations obtained with the SSRTM map show a high peak of 95 μg m-3 on May 31 at 00:00 LT. However, the concentration decreases after a few hours. On the other hand, PM10 predicted values for SMODIS-LNR are smaller than those for SSRTM, but the duration of the modeled dust episode related with the Zonda event is in agreement with observations (i.e., maximum PM10 = 58 μg m-3 at 03:00 LT, while average PM10 between 00:00 and 12:00 LT on May 31 is 52 μg m-3). SSRTM and SMODIS-LNR scenarios also predict a second peak in the afternoon of May 31, the concentration for the first case being two times higher. At this time, we expect local contribution of mobile anthropogenic sources to dominate PM10. This fact is reflected by the PM10/PM2.5 ratio returning to its normal hourly average (Fig. 5b). The SMODIS-SQR does not show significant improvement over the SStandard scenario and underestimates ambient dust concentrations.
5.4Spatial distribution of dust emissionIn order to analyze the contribution of windblown dust emissions to concentrations at the measuring site, we computed back trajectories of air parcels before and after the Zonda event. We computed two back trajectories ending at the measuring site: the first starting 3 h before the morning peak of PM10 concentration is registered; the second starting 3 h before the second peak on the afternoon of May 31. Fig. 6 shows both back trajectories superimposed to each erodibility map used in the study. The Zonda wind entered the Mendoza region from the north and in the afternoon wind blew from the west. The first trajectory shows that there are preferential dust sources along the wind path in all the scenarios but SStandard. This map only shows a small dust source 3 h away from Mendoza and thus produces the lowest PM10 concentrations (Fig. 5a). From this analysis, we can conclude that the simulated PM10 concentration at the measuring point strongly depends on the spatial distribution of erodibility factors. This could explain why the SSRTM scenario, which consistently predicts the highest concentration over the entire domain, predicts lower concentrations than the SMODIS-LNR scenario at the specific time the Zonda wind hits the measuring site. The second trajectory shows that the buildup of PM10 concentration at the measuring site is related to dust sources to the west of the measuring site. The SSRTM erodibility map shows a preferential dust source along the path of this trajectory, which could explain the high PM10 concentration predicted by the model in the SSRTM run on May 31 around 20.00 LT. None of the other scenarios show a preferential dust source to the west ofthe measuring site. However, SMODIS-LNR also predicts high PM10 concentration values on the evening of May 31, which could be related to dust entrained previously.
5.5Modeled and measured AOD and 17:00 LT (grey) on top of each of the erodibility maps used: (a) SStandard, (b) SSRTM, (c) SMODIS-LNR and (d) SMODIS-SQR. Contour lines indicate terrain height in meters.")
The second relevant aspect to test model performance is the resulting ambient dust spatial distribution. We compared simulated AOD with MODIS AOD. Unfortunately, the region of interest was covered with clouds on May 31, limiting the quality of satellite retrievals. Consequently, we centered our analysis on May 30, 2013 (Fig. 7). Simulated AOD is based on the extinction coefficient at 550 nm provided by WRF/Chem output files for May 30 at 12:00 LT. We omit the SMODIS-SQR scenario from the analysis since AOD for that case shows the same spatial distribution than SMODIS-LNR, but with slightly lower AOD values.
 simulated with WRF/Chem for May 30, 2013, considering different erodibility maps: (a) SStandard, (b) SSRTM, (c) SMODIS-LNR, (d) satellite derived AOD from MODIS-Terra.")
The SSRTM and SMODIS-LNR scenarios predicted AOD values on the west side of the Andes mountain range at least 10 times greater than those predicted by the Sstandard scenario. The latter shows an almost homogeneous spatial distribution of AOD, with slightly higher values on the northern pacific coast of Chile (Fig. 7a). All other scenarios show the same pattern in the upper left corner of the domain. Therefore, AOD in that region is linked to boundary conditions. This analysis indicates that AOD for the Sstandard scenario is related to background dust level and not to dust uplifted in the domain. The SSRTM and SMODIS-LNR scenarios show high AOD values in the central part of the domain, decreasing eastward. Spatial distribution is in good agreement with MODIS derived AOD in this region. However, SSRTM seems to overestimate AOD in the northeast part of the domain.
6ConclusionsWe have developed and tested erodibility maps of Argentina for use in WRF/Chem windblown dust simulations at local scales. All proposed methodologies are applicable to any part of the globe, since they rely on freely available satellite data products. We showed that the SStandard map not only results in severe underestimation of simulated PM10 concentrations in Argentina, but also in a poor representation of spatial distribution of windblown dust. The SSRTM method showed improved source distribution in comparison with that in the standard global database. The SMODIS-LNR and SMODIS-SQR maps produced lower erodibility factors than SSRTM. Overall, the developed dust source distribution is in better agreement with studies on desertification in Argentina. The advantage of the methods based on surface reflectance is that they have the potential to capture seasonal variation of erodibil- ity through changes in vegetation and land use, while the methods based on topography may underestimate emissions in southern Patagonia, where land is typically bare and flat, and overestimate dust sources in the northeast, where land is mostly cultivated.
Both SSRTM and SMODIS-LNR maps predict PM10 concentrations closer to those measured during the Zonda event. However, SSRTM gives slightly lower concentration values during the strong wind episode and overestimates the PM10 concentration after that period. Analysis of back trajectories confirmed that the spatial distribution of erodibility factors based on topographic assumptions might not represent correctly the location of preferential dust sources in our area of study. Even though the SMODIS-LNR map is in better agreement with measurements of PM10, further work is required to explain the high concentration of PM10 after the Zonda event. Comparison between AOD from MODIS and simulated AOD confirms that the erodibility map based on surface reflectance (SMODIS-LNR) yields a better representation of dust emissions over the area of study. We conclude that the SMODIS-LNR map provides a good representation of preferential dust sources distribution over Argentina. This map can be used to include fugitive emissions of dust in air quality studies with WRF/Chem in Argentina.
We thank ESA for providing GlobCover 2009. We also thank INTA for the invaluable help with the soil maps. We thank the authorities of the Universidad Tecnológica Nacional of Argentina (UTN Grant Project PID IFI1487 Cod. 25/JC01) and the Consejo Nacional de Investigaciones Científicas y Técnicas (CONICET PIP 112 20110100673) for their support of our research activities. RPF would also like to thank ANPCyT (PICT-PRH 2009-0063) and SeCTyP-UNCuyo (M007-4540) for financial support.