


En México se registran alrededor de 7650 incendios anuales, con un promedio de 263 115 hectáreas afectadas. Los incendios forestales generan, además del impacto en la degradación del suelo, la deforestación, la degradación de los ecosistemas y la proclividad al cambio de uso de suelo, emisiones tóxicas para el medio ambiente, tales como ácido cianhídrico, carbono negro y carbono orgánico, entre otros. El carbono negro es un contaminante de efecto invernadero de vida corta. Asimismo, promueve el derretimiento de la nieve y el hielo, y una disminución de las precipitaciones. Se ha estimado que tiene un potencial de calentamiento global cercano a 5000.1 Se presenta una estimación de las emisiones de carbono negro y carbono orgánico de los incendios forestales en México, desde 2000 hasta 2012. El promedio de los resultados obtenidos es de 5955 Mg/año de carbono negro y 62 085 Mg/año de carbono orgánico. Una correcta gestión de los incendios forestales podría evitar alrededor de 14 888 Gg de CO2 equivalentes por año. Por otra parte, la mejoría en la calidad del aire, la conservación de los ecosistemas, la mejora de la visibilidad y el mantenimiento del uso del suelo son algunos de los beneficios colaterales. Mitigar las emisiones de carbono orgánico forestal, que son diez veces superiores a las emisiones de carbono negro, podría prevenir la morbilidad y mortalidad debido a estos compuestos orgánicos tóxicos en el medio ambiente.1 El potencial de calentamiento global (GWP, por sus siglas en inglés) se calcula como la relación entre el potencial de calentamiento global absoluto (AGWP) de un gas o contaminante dado respecto al AGWP del CO2. El AGWP tiene unidades Wm–2 g–1 año.
In Mexico, approximately 7650 wildfires occur annually, affecting 263 115 hectares of land. In addition to their impact on land degradation, wildfires cause deforestation, damage to ecosystems and promote land use change; apart from being the source of emissions of toxic substances to the environment (i.e., hydrogen cyanide, black carbon and organic carbon). Black carbon is a short-lived greenhouse pollutant that also promotes snow and ice melting and decreased rainfall; it has an estimated global warming potential close to 5000.1 We present an estimate of the black carbon and organic carbon emissions from wildfires in Mexico from 2000 to 2012 using selected emission factors from the literature and activity data from local agencies. The results show average emissions of 5955 Mg/yr for black carbon and 62 085 Mg/yr for organic carbon. Black carbon emissions are estimated to be 14 888 Gg CO2 equivalent (CO2 eq) per year on average. With proper management of wildfires, such emissions can be mitigated. Moreover, improved air quality, conservation of ecosystems, improvement of visibility and maintenance of land use are a subset of the related co-benefits. Mitigating forest organic carbon emissions, which are ten times higher than black carbon emissions, would also prevent the morbidity and mortality impacts of toxic organic compounds in the environment.1 The GWP is calculated as the ratio of the Absolute Global Warming Potential (AGWP) of a given gas to the AGWP of CO2. The AGWP has units of Wm–2 g–1 yr.
Wildfires are events described by the burning of bio-mass fuels. Krawchuk et al. (2009) have added that a wildfire “is an ecological disturbance process that has a heterogeneous global distribution controlled by the coincidence of three basic requirements: vegetative resources to burn, environmental conditions that promote combustion, and ignitions”. Wildfires impair the air visibility, causing health problems for people and animals and destroy vegetation and ecosystems. Wildfires also emit toxic by-products to the environment, such as hydrogen cyanide, organic carbon and black carbon (Yokelson et al., 2007), among others. Deaths from smoke inhalation from wildfires number 350 000 per year worldwide (Johnston et al., 2012).
Black carbon is a 0.1-0.5 µg cluster of different compounds produced by the incomplete burning of fossil fuels (primarily oil, diesel and fuel oil) and biomass (wood, coal, etc.) and is structured with an elemental carbon core surrounded by volatile organic compounds in the form of gaseous- and liquid-phase molecules. Certain sulfates and carbonates are emitted as complex chain structures, which tend to collapse as the particles age, thereby modifying their optical properties (IPCC, 2007). Due to the complex nature of their components as well as weather conditions (e.g., presence of moisture), the physical characteristics (e.g., on the surface or in the atmosphere) of the environment and the type of emission sources (biomass fuel combustion internal engines), the nature of black carbon forcing changes with its lifetime.
Unlike volatile organic compounds that form a component of the structure of black carbon that is transparent to the human eye, black carbon absorbs visible light and is therefore responsible for diminished visibility in the air. For compounds that are emitted into the atmosphere, black carbon is the main substance that absorbs solar radiation (Bahadur et al., 2011). By absorbing solar radiation, the pollution decreases the incidence of radiation on the surface, but the net effect on the earth-atmosphere system (known as radiative forcing) represents an increase in the surface and atmospheric temperatures (IPCC, 2007).
Black carbon is an important short-lived climate forcing species whose global warming potential is estimated to be up to 5000 times that of carbon dioxide (EPA, 2012), positioning it as the second or third climate driver behind CO2 on a global scale (Bachmann, 2009; Shindell and Faluvegi, 2009). The main global emission sources of black carbon are found in the transport sector from diesel-driven vehicles (Bond et al., 2004; Woodcock et al., 2009) and in the burning of biomass in the rural households of developing countries (Wilkinson et al., 2009; Ruiz-Mercado et al., 2011).
Carbon dioxide, which is the most abundant component of the so-called greenhouse gases (GHG), has a long lifetime (IPCC, 2007). Certain other ‘Kyoto basket’ GHGs are composed of gases with shorter and more stable lifetimes, such as methane. However, other GHG, despite their anthropogenic origins and significant contribution to global warming, are not included. These gases include species that lead to the formation of tropospheric ozone (i.e., carbon monoxide [CO], non-methane volatile organic compounds [NMVOC] and nitrogen oxide [NOx]) and aerosols and their precursors (i.e., sulfur dioxide [SO2], black carbon [BC] and organic carbon [OC]) (Rypdal et al., 2005).
Wildfire emissions are composed primarily of carbon dioxide, many organic species and black carbon (Yokelson et al., 2007); their shares are dependent on the meteorological conditions, type of vegetation, humidity, and topography of the terrain, among other factors. Organic compounds emitted by fires are reactive species that play a role in the formation of ozone and secondary organic aerosols in addition to many other organic compounds, such as benzene and toluene, degradation products from biopolymers, n-alkanes, n-alkenes, n-alkanoic acids, n-alkanols, monosaccharide derivatives from cellulose, steroids and terpenoid biomarkers, and polycyclic aromatic hydrocarbons (primarily retene) (Yokelson et al., 2007; Evtyugina et al., 2013), which are known to be toxic to human health. Excluding agricultural burning, recent estimates suggest that wildfires account for approximately half of the global BC and CO emissions and two-thirds of OC emissions (UNEP and WMO, 2011). However, no global black carbon emission inventory is available from the United Nations Framework Convention on Climate Change (UNFCCC).
Mexico has a land area of ca. 1.9 million square kilometers. In 1993, land use was distributed as follows, tropical and temperate forests (36%), shrublands (27%) and developed areas with activities such as agriculture and pasture (22%) (de Jong et al., 2010). Currently, land use change has been incremented due to uncontrolled urban growth, abandonment of land, and land use change from forest to agriculture, among others. Wildfires are the most common form of land use change from forest to agriculture or urban. Wildfire causes have been studied by several authors (Román and Martínez, 2006; Mangini and Henry, 2007; Ávila-Flores et al., 2010) who have emphasized the crucial role of anthropogenic activities on the spatial distribution of forest fires.
The aim of this study is to estimate the black carbon and organic carbon emissions from wildfires in Mexico from 2000 to 2012 to better understand the magnitude of black carbon and organic carbon emissions with respect to the national emission inventory.
2MethodologyBlack carbon and organic carbon emissions are calculated using the basic equation developed by Wiedinmyer et al. (2010),

where the emission of species i (Ei, mass of i emitted) is equal to the area burned at time t and location x [(A(x, t)) multiplied by the biomass loading at location x [B(x)], the fraction of that biomass burned in the fire (FB), and the emission factor of species i (EFi, mass of i emitted/mass of biomass burned). All of the biomass terms are calculated on a dry weight basis (Wiedinmyer et al., 2010).
Activity data (i.e., number of wildfires, affected surface, type of burned biomass, and location for the years 2005 to 2011) were estimated from the Comisión Nacional Forestal (National Forest Commission) data (Conafor, 2005-2012), and the emission factors, mass loading and combustion efficiency were obtained from Akagi et al. (2010). The emissions were estimated on an annual basis from 2000 to 2012.
3ResultsFigure 1 displays the relationship between the number of wildfires and the affected area for the studied period. The change in the magnitude of the affected area over the last three years (2010 to 2012) is noteworthy.

The data displayed in Figure 1 show averages of 7654 for the number of fires and 263 115 ha for the affected area. Out of the general trend, the larger events in this database are those that occurred in 1998 and primarily affected the tropical forests of Chiapas and Oaxaca. From July 1997 to March 1998, the El Niño phenomenon was followed by La Niña, which caused an increase in wildfires (Sosa et al., 2004), and in 2011, a series of large wildfires that affected the state of Coahuila were caused by severe drought; in that year, this state suffered an unusual series of wildfires that devastated a large area and claimed human and animal lives in addition to devastating a fragile and unique ecosystem (Poulos and Camp, 2010; Cruz-López and López-Saldaña, 2011).
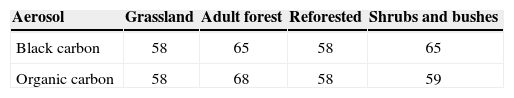
The general plant cover types affected by wildfires are presented in Figure 2. From this figure, we observe that the major components burned in fires are bushes, shrubs and grasslands. Forest and reforestation burning are not significant in these percentages, at least from 2000 to the present.

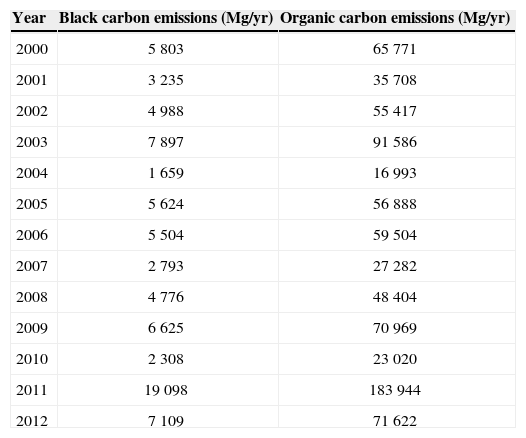
The black carbon and organic carbon emission estimates from wildfires for 2000 to 2012 are presented in Table I in terms of national totals, and in Figure 3 these data are split into values for the political states of Mexico. The uncertainty of the estimates is presented in Table II. The data in Table I show that organic carbon emissions are over ten times that of black carbon. The co-emission ratio of BC to OC varies by vegetation type, combustion efficiency, and the extent of emission controls. When fossil fuels (i.e., oil and coal) are not completely burned, BC tends to form in much larger amounts than OC, but when biomass fuels (i.e., wood and plant material) are incompletely combusted, OC is formed in greater amounts than BC (EPA, 2012).
Estimated black carbon and organic carbon emissions, 2000-2012.
| Year | Black carbon emissions (Mg/yr) | Organic carbon emissions (Mg/yr) |
|---|---|---|
| 2000 | 5 803 | 65 771 |
| 2001 | 3 235 | 35 708 |
| 2002 | 4 988 | 55 417 |
| 2003 | 7 897 | 91 586 |
| 2004 | 1 659 | 16 993 |
| 2005 | 5 624 | 56 888 |
| 2006 | 5 504 | 59 504 |
| 2007 | 2 793 | 27 282 |
| 2008 | 4 776 | 48 404 |
| 2009 | 6 625 | 70 969 |
| 2010 | 2 308 | 23 020 |
| 2011 | 19 098 | 183 944 |
| 2012 | 7 109 | 71 622 |

Annual emission estimates average 5955 and 62 085 metric tons of black carbon and organic carbon, respectively. Within the black carbon emission inventory (Cruz-Núñez, 2014) average emissions from wildfires share accounts for 2 to 9% of the total.
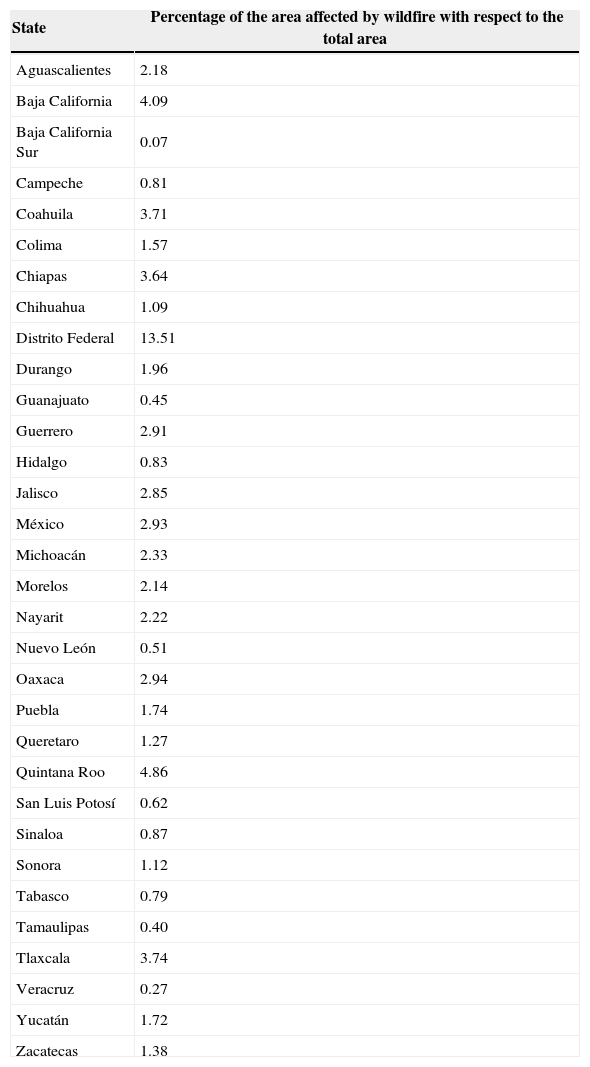
The area affected by wildfire is presented in Table III as the average annual share of each state’s total area. It is noteworthy that the country’s capital, Mexico City, is the most affected by forest fires across the country because of the pressure that population growth puts on forest areas (mostly to the south of the city), which are illegally burnt for opening new areas to urban growth.
Percentage of affected area (annual average) by state, 2000-2012.
| State | Percentage of the area affected by wildfire with respect to the total area |
|---|---|
| Aguascalientes | 2.18 |
| Baja California | 4.09 |
| Baja California Sur | 0.07 |
| Campeche | 0.81 |
| Coahuila | 3.71 |
| Colima | 1.57 |
| Chiapas | 3.64 |
| Chihuahua | 1.09 |
| Distrito Federal | 13.51 |
| Durango | 1.96 |
| Guanajuato | 0.45 |
| Guerrero | 2.91 |
| Hidalgo | 0.83 |
| Jalisco | 2.85 |
| México | 2.93 |
| Michoacán | 2.33 |
| Morelos | 2.14 |
| Nayarit | 2.22 |
| Nuevo León | 0.51 |
| Oaxaca | 2.94 |
| Puebla | 1.74 |
| Queretaro | 1.27 |
| Quintana Roo | 4.86 |
| San Luis Potosí | 0.62 |
| Sinaloa | 0.87 |
| Sonora | 1.12 |
| Tabasco | 0.79 |
| Tamaulipas | 0.40 |
| Tlaxcala | 3.74 |
| Veracruz | 0.27 |
| Yucatán | 1.72 |
| Zacatecas | 1.38 |
The spatial distribution of wildfire emissions is shown in Figure 3. Coahuila is the state with highest black carbon and organic carbon emissions due to the quantity and magnitude of the 2011 wildfires. It is noteworthy that out of the entire country, the northern region is the most important in terms of wildfires and, consequently, in emissions. In this large extension, the area composed of the states of Coahuila, Chihuahua, Sonora, Durango and Zacatecas is characterized by arid and semiarid shrublands and grasslands, which are the predominant biomes that account for nearly 40% of the country’s vegetation. Mayer and Kahlyani (2011) found that plant cover type is associated with rain, wildfires and human activity. The distribution shown in Figure 3 is consistent with such findings.
In addition to the frequency of fires in the north, given the dominant vegetation type, an area in the southeast also exists where wildfires have a high incidence. This area has been heavily deforested in recent years primarily because of land use change, and it may be assumed that the fires are due to human causes, such is the case of Oaxaca, Chiapas and Quintana Roo that are the most affected by wildfires.
4DiscussionBlack carbon emissions generated in 2012 are estimated to be 7109 metric tons. Assuming that the global warming potential can be applied to black carbon, over a 20-year horizon value of 2500 (an average of values obtained by Bond and Sun, 2005; Berntsen et al., 2006; Koch et al., 2007; Naik et al., 2007; Reddy and Boucher, 2007), these black carbon emissions are equivalent to 17.8 Mton CO2 eq. One mitigation measure in Mexico´s Programa Especial de Cambio Climático (Special Program for Climate Change) (CICC, 2009) was to reduce the average area affected by wildfire not exceeding 30 ha per event to save 0.49 Mton CO2 eq in 2012. In such a mitigation measure black carbon emissions were not estimated. Reducing wildfires would produce, additional to CO2 emissions, black carbon emissions.
Villers-Ruiz and Hernández-Lozano (2007) in Mexico found an inverse direct relationship between El Niño/Southern Oscillation anomalies and wild-land fire activity. Recently, IPCC (2012) has stressed the relationship between extreme events, such as drought and dryness, with an increase in wildfires. Additionally, the wildfire frequency has recently been revised by Adams (2013), who confirmed the relationship between the frequency of mega-fires and the type of biome involved, together with Mayer and Kahlyani (2011). Our data (as shown in Fig. 2) are in agreement with the findings of Adams (2013) that grassland and shrublands are the biomes most affected by wildfires.
Large-scale wildfires have increased in recent years (Krawchuk et al., 2009; Adams, 2013) and have caused major impacts on a global scale, including the destruction of ecosystems, accidents due to a lack of visibility, and impacts on global temperature and precipitation. Certain modeling estimates (Krawchuk et al., 2009) have warned Mexico as a fire-prone region, and therefore, it is necessary that a national strategy be implemented against wildfires, especially those of great magnitude, together with the appropriate ecosystems management approaches, such as those implemented in developed countries (Adams, 2013). Wildfires are preventable with clear regulations, instrumentation and a monitoring system for forests and national agricultural lands, especially in times of drought. Among others, these measures may reduce the national deforestation rate, reduce the danger of habitat elimination in a megadiverse country and reduce the emissions of pollutants generated during fres. Additionally, the mitigation of emissions offers such co-benefits as improved visibility and improved public health (Smith et al., 2009), among others.
5ConclusionsThe analysis of wildfires in Mexico from 2000 to 2012 shows an increased affected area by event over the last years. The land types most affected by wildfires are shrublands and grasslands. Annual average emissions from wildfires were estimated of 5955 and 62 085 metric tons of black carbon and organic carbon, respectively, representing between 2 and 9% of the national total.
Two general types of wildfires were observed in Mexico according to the location and the land burned. The northern states and the Yucatan peninsula are the areas most affected by grassland and shrubland fires, and although many are caused by human activity, wildfires are also related to points of high temperature along the dry season (Cruz-López and López-Saldaña, 2011). On the other hand, wildfires in the southern states are mainly located in the Oaxaca and Quintana Roo forest areas and are related to land use changes for livestock and agricultural use.
We thank Bertha E. Mar Morales for the graphical display in Figure 3. We are grateful to the officers of the Comisión Nacional Forestal for personal advice and communications.
El potencial de calentamiento global (GWP, por sus siglas en inglés) se calcula como la relación entre el potencial de calentamiento global absoluto (AGWP) de un gas o contaminante dado respecto al AGWP del CO2. El AGWP tiene unidades Wm–2 g–1 año.
The GWP is calculated as the ratio of the Absolute Global Warming Potential (AGWP) of a given gas to the AGWP of CO2. The AGWP has units of Wm–2 g–1 yr.