


El modelo de dispersión atmosférica de corto alcance (AERMOD, v. 12345) de la Agencia para la Protección Ambiental de Estados Unidos (US-EPA, por sus siglas en inglés) es una buena alternativa para calcular las dosis de radiación que recibe el público general al exterior de instalaciones nucleares, y su avanzada capacidad puede hacer más confiables y exactas las valoraciones de dichas dosis. En este trabajo se utiliza el código de AERMOD para valorar las descargas atmosféricas rutinarias y accidentales de una nueva planta de energía nuclear (PEN) localizada en Geregu, Nigeria (7o 33’ N, 6o 41’ W), sobre los cuatro centros urbanos (Ajakuta, Lokoja, Idah y Okene) que se encuentran dentro de la zona delimitada en el plan de emergencia de la PEN. Dicho código ha proporcionado valores para los factores de escala de las concentraciones de radionúclidos (de la columna pasajera) en aire a nivel superficial y de su sedimentación sobre las áreas de interés. Se utilizaron factores de escala para valorar el posible efecto radiológico externo sobre la biota humana y no humana. Mientras que los efectos radiológicos sobre seres humanos se examinaron mediante los métodos computacionales comunes establecidos por las autoridades regulatorias, respecto de la biota no humana se eligió un enfoque integral para la valoración y manejo de riesgos ambientales debidos a radiación ionizante (D-ERICA). Los resultados de este trabajo indican que, en situaciones de operación normales, la PEN no produce efectos ambientales ni de salud pública importantes. Sin embargo, los accidentes caracterizados por precipitación sí provocarían riesgos radiológicos perceptibles dentro de la zona delimitada en el plan de emergencia de la PEN.
The United States Environmental Protection Agency (US-EPA) short-range atmospheric dispersion model (AERMOD, v. 12345) is a good candidate for the calculation of offsite radiation doses to the general public, and its advanced capability should provide better confidence in the accuracy of offsite public doses assessment. In this paper the AERMOD code has been used to assess the impact of routine and accidental atmospheric radioactive discharges from a new nuclear power plant (NPP) site in Geregu, Nigeria (7° 33’ N, 6° 41’ E) on the four major settlements (Ajakuta, Lokoja, Idah and Okene) that lay within the emergency planning zones of the NPP. The code has produced values of the scaling factors for ground level air concentrations and depositions of radionuclides (from the passing plume) over our areas of interest. The scaling factors have been used to assess the potential radiological impact on the offsite human and non-human biota. While the radiological impacts on humans were calculated using the popular computation methods set by regulatory authorities, an integrated approach to the assessment and management of environmental risks from ionizing radiation (D-ERICA) was adopted for the non-human biota. The results of this work indicate that, under normal operations, the NPP does not pose any significant public health and environmental impacts. However, accidental conditions characterized by precipitation will lead to discernible radiological risks within the NPP sites emergency planning zone.
Nigeria is planning to add nuclear energy to its energy sources in order to address its energy crisis. According to the country’s nuclear power deployment roadmap, the country’s pioneer nuclear power plant (NPP) is to generate 1000 MW by 2020 with a plan to increase the generating capacity to 4000 MW by 2030.
Countries around the world are considering the adoption of nuclear power due to its low greenhouse gases emissions, which is vital for climate change mitigation. However, strict regulatory mechanisms (standards) must be fulfilled before an operation license or even a construction license is given for a new nuclear power program. This regulatory standards include the estimation of potential radiological risks to both humans and environment from routine and accidental releases of radionuclides from the new NPP.
In a situation where measurements are not available, the assessment could be achieved through modeling using computer codes. The models to be used in the current study consider the radionuclides transfer factor and the exposure pathway in the estimation of radiological consequences. All computations lie within the framework of the system of radiological protection recommended by the International Commission on Radiological Protection (ICRP).
Computer models are now an important part of the environmental health and safety assessment. The study and improvement of techniques in atmospheric dispersion modeling of radioactive effluent in risk assessment and emergency response date back to half a century ago (Abdul Basit, 2010; Yao, 2011). The International Atomic Energy Agency (IAEA) has outlined its recommendations on modeling for the assessment of environmental impacts due to routine releases from NPP (IAEA, 1982). To achieve some of the regulatory recommendations, it is necessary to use robust environmental modeling techniques. The AERMOD model has been used for accurate dispersion calculation of radioactive fallouts from the incineration of urban solid wastes (Ronchin et al., 2011), and has also been considered a candidate for offsite doses calculations (Aliyu et al., 2013).
Radiological consequence assessment of atmospheric releases from a new NPP is an important regulatory criterion that must be fulfilled before the construction and operation licenses are issued to operators of NPPs. Hence, the aim of this work is to use internationally verified and state of the art models to estimate the potential human health and environmental impacts of new nuclear programs in Nigeria for the first time. This paper will demonstrate how the AERMOD model can be applied for radiological consequence assessment of routine and accidental releases from an NPP.
2Models description2.1AERMOD modelThe AERMOD dispersion model is based on the Gaussian plume model (GPM), which is a stable state (time-independent) atmospheric dispersion model. The description of the parameters considered in the GPM is presented in Figure 1.
. INPUT")
Schematic of the Gaussian plume (Schulze and Turner, 1996). INPUT
The Gaussian distribution provides a solution for the random walk problem and it was considered to be a fundamental solution for the diffusion equation. The models that are based on the assumption that concentration can be described by normal distribution are called GPMs (Sorbjan, 1989). These models were developed by Pasquill (1961) and they are based on Eq. (1):
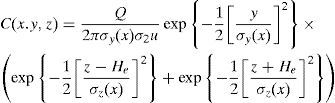
where He is the effective stack height, the coefficient σy was derived empirically, and σz was derived theoretically as a function of downwind distance and stability.
Q is the emission factor (rate), and 1u is the downwind factor (Schulze and Turner, 1996; Sorbjan, 1989).
The American Meteorological Society (AMS) and the U.S. Environmental Protection Agency (US EPA) initiated a formal collaboration with the aim of introducing current planetary boundary layer (PBL) concepts into regulatory dispersion models in 1991. A group comprising AMS and EPA scientists was formed for this collaborative function, which was known as the AMS/EPA Regulatory Model Improvement Committee (AERMIC). The AERMIC model (AERMOD), wich is an improved version of the Industrial Source Complex Model (ISC3) that has been the EPA regulatory model for some time, was developed (Schulze and Turner, 1996). AERMOD is a freely available software package provided by the EPA (US-EPA, 2014).
AERMOD consists of two pre-processors and the dispersion model. The meteorological pre-processor (AERMET), which provides AERMOD with the meteorological information needed for characterizing the PBL; and the terrain pre-processor (AERMAP), which characterizes the terrain, and generates receptor grids for the dispersion model (Schulze and Turner, 1996).
AERMET uses meteorological data and surface roughness information to compute the BL parameters (like mixing height, friction velocity, etc.) needed by AERMOD. These data are representative of the climatology in the modeling domain. On the other hand, AERMAP uses gridded terrain data of the domain to calculate the representative terrain-influence height associated with each receptor’s location. The gridded data is supplied to AERMAP in the form of digital elevation model (DEM) data. The terrain pre-processor can also be used to compute elevations for both discrete receptors and receptor grids (Cimorelli et al., 2004).
Figure 2 shows the data flow and information processing in AERMOD, presenting the two pre-processors (AERMET and AERMAP) with their functionalities.
.")
Data flow in AERMOD (Cimorelli et al., 2004).
In recent years, for most air quality applications the modeller is concerned with dispersion in the PBL, the turbulent air layer next to the earth’s surface that is controlled by surface heating, friction and overlying stratification. The PBL typically ranges from a few hundred meters in depth at night to 1-2km during the day (Cimorelli et al., 2004). In the PBL, the wind speed and wind direction are affected by frictional interaction with objects on the surface of the earth (Schulze and Turner, 1996).
AERMET uses three different meteorological data: data of the source location (onsite), data of the offsite location, which is used to complete the onsite meteorological data, and data of the upper air from a location near the source (Caputo et al., 2003).
AERMOD handles the calculation of pollutant impact in both flat and complex terrain within the same computational framework, thereby removing the need to specify whether the modeling domain is flat or elevated, which is necessary in most regulatory dispersion models (Cimorelli et al., 2004; Perry et al., 2005). Details of the model formulation theories and methodologies adopted are available in literature (Cimorelli et al., 2004; Perry et al., 2005; Tuner and Schultze, 2007).
Other air dispersion models that could be adopted in the environmental impact assessment of new nuclear installments include Gaussian models (UKADMS) and Lagrangian models (HYSPLIT, CAL-PUFF, etc.). A brief description of these models based on their analytical formulation is presented below.
The United Kingdom Air Dispersion Modeling System (UK-ADMS) is a regulatory model developed to simulate dispersion of buoyant or neutrally buoyant particles and gases. Details of the model formulation of UK-ADMS are presented in Carruthers et al. (1994). This model uses an advanced Gaussian approach with a normal Gaussian distribution in stable and neutral conditions, whilst the vertical dispersion is approximated by two different Gaussian distributions in a CBL. The treatment of the reflection of the plume on the surface of the Earth is similar to other Gaussian models. The model calculates the plume rise based on temperature differences between the atmosphere and the emitted plume, and horizontal and vertical momentum fluxes including the possibility for entrainment of the plume and its escape through inversion at the top of the boundary layer. The dry deposition of particles is modeled as a function of gravitational settling and deposition velocity with respect to aerodynamic, sub-layer and surface resistances. Wet deposition is approximated using a washout coefficient derived from the precipitation rate (Holmes and Morawska, 2006).
The California Puff Model (CALPUFF) is a non-steady-state Gaussian puff model containing modules for complex terrain effects, overwater transport, coastal interaction effects, building downwash, wet and dry removal, and simple chemical transformation (Scire et al., 1990). The CALPUFF model, unlike AERMOD, has the capabilities of handling both mesoscale and long range dispersion calculations; hence it is recommended for dispersion calculations from about 50-1000km (Till et al., 2014). Just like AERMOD, it models four different types of sources: point, line, volume and area using an integrated puff (Holmes and Morawska, 2006). It also takes into account the effects of plume rise, partial penetration, buoyant and momentum plume rise, stack effects and building effects. Details of the model formulation are presented in Scire et al. (1990).
The Hybrid Single-Particle Lagrangian Integrated Trajectory (HYSPLIT4) model is a complete system for computing trajectories complex dispersion and deposition simulations using either puff or particle approaches. It is a global model, i.e. it handles dispersion calculations in the range of thousands of kilometers. The input data are interpolated to an internal sub-grid centered to reduce memory requirements and increase computational speed. Calculations may be performed sequentially or concurrently on multiple meteorological grids, usually specified from fine to coarse resolution (Draxler and Hess, 1997; Draxler et al., 1999). The HYSPLIT model uses gridded meteorological data on one of three conformal map projections (Polar, Lambert, Mercator). Air concentration calculations relate the mass of the pollutant with the release of either puffs, particles, or a combination of both. The dispersion rate is calculated from the vertical diffusivity profile, wind shear, and horizontal deformation of the wind field. Air concentrations are calculated at a specific grid point for puffs and as cell average concentrations for particles (Draxler and Hess, 1997). Insight on the model formulation is presented below; for details see Draxler and Hess (1997) and Draxler et al. (1999).
A major advantage of the HYSPLIT model is its flexibility, i.e. its ability to use different types of meteorological data files for input. The meteorological parameters at each horizontal grid point are linearly interpolated to an internal dispersion model terrain-following (σ) coordinate system as shown in Eq. (2)

where all heights are expressed with respect to the sea level, and ztop is the top of the model’s coordinate system. The model internal height above the ground level (AGL) can be chosen at any interval.
2.2ERICA ToolThe Environmental Risks from Ionizing Contaminants: Assessment and Management (ERICA) project, which produced the ERICA Tool (a software program with supporting databases that guides users through the assessment process) was co-funded by the European Union and 15 organizations in seven European countries between 2004 and 2007. The aim of this project was to develop an approach whereby the environmental impacts of ionizing radiation could be quantified and to ensure that decisions on environmental issues gave appropriate weight to the exposure, effects and risks from ionizing radiation. Incorporated in the modeling system are databases on transfer, dose conversion coefficients and radiation effects on non-human biota that have been developed specifically for the purpose of the integrated approach. The aims are to conduct species sensitivity to radiation on the basis of a universal screening dose rate criterion of 10µGy h−1.
There are three elements of the ERICA integrated approach intended to aid decision-making related to the environmental effects of ionizing radiation: assessment of environmental exposure and effects using the ERICA Tool, risk characterization, and management of environmental risks (Beresford et al., 2007; Torrud and Saetre, 2013).
Tier 1 is designed to be simple and conservative, requiring a minimum of input data and enabling the user to exit the process and exempt the situation from further evaluation, provided the assessment meets a predefined screening criterion. Here the predefined screening dose is used to calculate the environmental media concentration limit (EMCL) for all reference organism/radionuclide combinations. The risk quotient (RQ) is then obtained by comparing the input media concentrations with the most restrictive EMCL for each radionuclide. These are defined by Eq. (3):
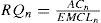
where AC is the measured activity concentration in the medium for a specific radionuclide n.
If RQ<1, then the probability of exceeding the benchmark is acceptably low (<5%) and this serves as the justification for terminating the risk calculations at this stage. In a situation where RQ>1, there is a>5% probability that the benchmark has been exceeded and further assessment is recommended (Tier 2).
Tier 2 allows the modeler to be more interactive by changing the default parameters (screening dose rate and radionuclides) and selecting specific reference organisms. The evaluation is performed directly against the screening dose rate, with the dose rate and RQs generated for each reference organism selected for assessment. A ‘traffic light’ system is used to indicate whether the situation can be considered:
- (i)
of negligible concern (with a high degree of confidence);
- (ii)
of potential concern, where more qualified judgments may be needed, and/or a refined assessment at Tier 2, or an in-depth assessment at Tier 3; and
- (iii)
of concern, where the user is recommended to continue the assessment, either at Tier 2 if refined input data can be obtained, or at Tier 3.
Decisions to exit an assessment, given that outcomes (ii) and (iii) are obtained, should be justified, for example by using information from FREDERICA, which is provided in the ERICA Tool as ‘look-up effects tables’ for different wildlife groups.
The basic equations for the Tier 2 assessment are shown in Eqs. (4) and (5):
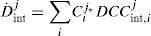
where Cij is the average concentration radionuclide i in the reference organism j (Bq kg−1 fresh weight), and DCCint,ij is the radionuclide specific dose conversion coefficient for internal exposure (µG h−1 per Bq kg−1 fresh weight).
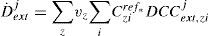
where v is the occupancy factor of the organism j at location z; Cziref is the average concentration of the radionuclide i in the reference media in a given location z, and DCCext,zijis the dose conversion coefficient for external exposure. The total dose rate D˙Totj is assessed by summing the tool’s equations 2.44 and 2.45. Two RQs (expected [RQexp] and conservative [RQcons]) are obtained at the end of this assessment. If RQexp≥1, the screening dose rate has been exceeded and assessment should continue to Tier 3; If RQcons≥1/RQexp<1, there is a substantial probability that the screening dose rate has been exceeded and the assessment needs to be reviewed. If RQcons<1, there is a low probability that the screening dose rate has been exceeded. In this case, the environmental risk is arguably negligible and the assessment is terminated at this stage.
In Tier 2, the total risk quotient is calculated as shown in Eq. (6).

where DTot is the total dose rate and Dlim is the screening dose rate.
Tier 3 is a probabilistic risk assessment in which uncertainties within the results may be determined using sensitivity analysis. The assessor can also access up-to-date scientific literature (which may not be available at Tier 2) on the biological effects of exposure to ionizing radiation in a number of different species. Together, these elements allow the user to estimate the probability (or incidence) and magnitude (or severity) of the environmental effects likely to occur and by discussion and agreement with stakeholders, to determine the acceptability of the risk for non-human species. Situations that give rise to a Tier 3 assessment are likely to be complex and unique, and it is therefore impossible to provide detailed or specific guidance on how the Tier 3 assessment should be conducted. Furthermore, a Tier 3 assessment does not provide a simple yes/ no answer, nor is the ERICA derived incremental screening dose rate of 10µGy h−1 appropriate with respect to the assessment endpoint. The requirement to consider factors such as the biological effects data within the FREDERICA database, or to undertake ecological survey work, is not straightforward and requires an experienced, knowledgeable assessor or consultation with an appropriate expert (Beresford et al., 2007).
Detailed description of the ERICA Tool is available in literature (Aliyu et al., 2014b; Beresford et al., 2007; Larsson, 2008; Torrud and Saetre, 2013).
3Materials and methods3.1Meteorological dataOne-year MM5 generated data files (for 2011) were validated and used as the meteorological data file to drive AERMOD. The MM5 generated data files were processed using the AERMET 1234 code in order to prepare the hourly meteorological files required by AERMOD. The terrain information needed by AERMAP was provided in the form of 7.5 minutes 100×100km digital elevation model (DEM) data. The DEM data was processed using the AERMAP pre-processor. The MM5 mesoscale modeling system is provided by the Pennsylvania State University/National Centre for Atmospheric Research (PSU/ NCAR) (http://www.mmm.ucar.edu/mm5).
An analysis of meteorological data shows that the wind blows most frequently from the SW with a maximum speed of 8.23 ms−1. A predominantly northeasterly wind will transport radioactive effluent over north-central Nigeria. It is mainly rainfall which will determine the deposition of radionuclides to the ground (and hence the radiation dose due to ingestion and ground shine).
Based on a nationwide study of the annual rainfall in Nigeria, the modeling domain lies within the region with relatively moderate rainfall and a dry season in November through January. The deposition rate should be higher in April, May and the third quarter of the year. During these periods, the hourly precipitation is high. Figure 3 demonstrates the variation of the hourly relative humidity with seasons.

The deposition rates at different receptor points (locations) are linearly dependent on the receptors’ distance from the proposed NPP site and the differences in typical rainfall amounts at the locations.
3.2Assessment methodologyAERMOD was configured to simulate unit (1 Bq s−1) releases of nine radionuclides from the NPP site at a height of 100 m. All radionuclides are assumed to be 1mm AMAD particles of inhalation class Y. The release temperature is assumed to be 20 oC and no nearby buildings contribute to building wake effects. The stack internal diameter and velocity were assumed to be 4 m and 10 ms−1, respectively.
In each of the model runs, half-life and deposition are the representative characteristics of the radionuclide under consideration. AERMOD provides the scaling factors for annual average concentrations (Bq m−3) and total deposition (Bq m−2) at each of the four receptors. The time-integrated air concentrations (TIAC) (Bq.s m−3) were derived by multiplying the number of seconds in a year. The annual average deposition rates (Bq m−2 S−1) were calculated using a similar method for deposited particles and mean 24-h deposition rates.
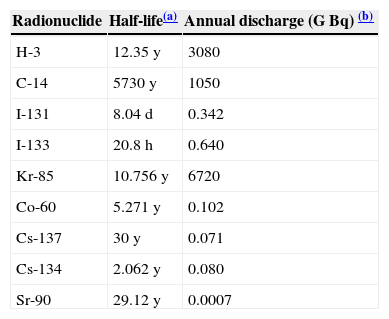
Annual discharges for each of the (nine) radionuclides from the proposed site have been modeled separately to derive individual annual scaling factors for average air concentrations (Bq m−3) and total depositions (Bq m−2). These scaling factors were multiplied by the site-specific annual discharge rates (Table I) to assess the long-term impact of routine discharges. Scaling factors, air concentrations, depositions and consequently radiation doses to a reference group within the modeling domain have been calculated for each of the receptors and each radionuclide. This approach allows future updating of the assessment once the type and number of reactors to be built at each site has been decided (McMahon et al., 2013).
Annual discharge of the modeled radionuclides during routine operations.
| Radionuclide | Half-life(a) | Annual discharge (G Bq) (b) |
|---|---|---|
| H-3 | 12.35 y | 3080 |
| C-14 | 5730 y | 1050 |
| I-131 | 8.04 d | 0.342 |
| I-133 | 20.8 h | 0.640 |
| Kr-85 | 10.756 y | 6720 |
| Co-60 | 5.271 y | 0.102 |
| Cs-137 | 30 y | 0.071 |
| Cs-134 | 2.062 y | 0.080 |
| Sr-90 | 29.12 y | 0.0007 |
The amounts of radionuclides assumed to be discharged to the air annually by the proposed NPP based on a conservative assessment of available data (McMahon et al., 2013).
It is important to mention that a number of isotopes are not considered by the current study and the choice of these radionuclides was based on their volatility and long term importance in radiation protection.
In the case of hypothetical accidents, an analogous scenario considered to the Fukushima Dai-ichi nuclear accident was. Several attempts have been made to determine the release rates as well as the radiological impact of the accident, and none of these works has reported a single case of death that is radiation-related (Chino et al., 2011a; Hoeve and Jacobson, 2012; Kamada et al., 2012; Katata et al., 2012).
Chino et al. (2011b) and Kamada et al. (2012) adopted the reverse source-term estimation method to determine the total amounts of 131I and 137Cs discharged into the atmosphere for the periods of their research interest. These authors coupled environmental monitoring data with atmospheric dispersion simulations under the assumption of a 1 Bq h−1 unit-release rate. They had already applied this method to the Chernobyl accident.
The total amounts of 131I and 137Cs discharged into the atmosphere from 10:00 JST (Japanese standard time) on March 12 to 0:00 JST on April 6 were estimated to be approximately 1.5×10¹⁷ and 1.3×10¹⁶ Bq, respectively (Chino et al., 2011a). These results are credible to some extent, as similar results were reported by the Japanese Atomic Energy Agency for the same period. Based on this published results, we considered the release rates of 131I and 137Cs to be 2.98×10¹² and 2.58×10¹¹ Bq s−1, respectively.
Three simulations in May, September and December, 2011 were run with identical emissions to those of the Fukushima NPP accident to represent the different meteorological conditions where deposition rates were compared due to the effect of rain washout as a result of wet deposition. December 30 was selected to simulate a scenario with no removal of radionuclides from the air due to rainout, as well as unsteady wind direction and wind speed.
The second and third scenarios considered the meteorology of May 15 and September 12, when moderate and heavy downpours occurred, respectively. Compared to December 30, the wind directions of May 15 and September 12 were relatively steady. In terms of atmospheric transportation of contaminants, a stable wind direction and high deposition due to rainout may be considered to be the worst scenario, as there is little dilution of the contaminant by the wind (depending on the physiochemical properties of the pollutants).
The environmental impact assessments were conducted by working through Tier 1 and Tier 2 of the ERICA tool, in accordance with the severity of the case.
The human dose rate profiles were analytically computed by considering a chronic release for normal operations and an acute release due to accidental conditions, and by adopting Eqs. (7) and (8), respectively (this method has been employed by Ronchin et al. [2011]):


where i represents the radionuclide in question; C(x→) the air concentration of the radionuclide; BR the breathing rate; DCFinh, DCFirr, DCFgs, and DCFsub, the radionuclide’s dose conversion factors for inhalation, irradiation, ground shine and submersion, respectively (Eckerman and Ryman, 1993; Homann, 2011; Ronchin et al., 2011); and T is the time spent on contaminated ground.
The advantage of the scaling technique adopted in the current study is that it facilitates the future updating of the assessment once the type and number of reactors are known, and the amount of radionuclides released into the air is established.
4Results4.1Results of the normal operations simulationThe scaling factors were obtained by assuming a unit release (1 Bq h−1), since this facilitates the future updating of the assessment. The scaling factors and the annual average discharge for each of the radionuclides (Table I) were then used to obtain the integrated annual air concentrations and ground depositions of the radio-nuclides in each of the receptors. These are presented in Figures 4 and 5, respectively. Data in Figure 4 is presented in a natural log scale and in reverse order.


The isotopes with the highest air concentrations are 85Kr, 3H and 14C, in that order. This demonstrates the impacts of controlled releases of radionuclides that pose higher health risks in NPP designs. The release of iodine and cesium isotopes is highly controlled as they can only be released in substantial amount during major NPP accidents.
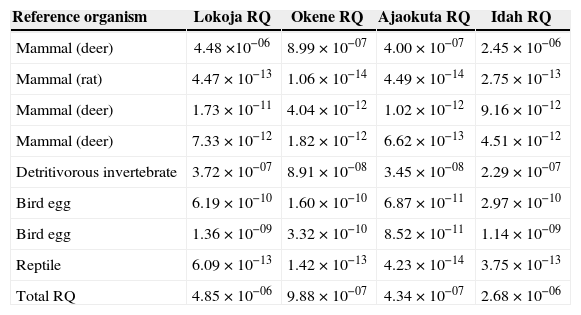
Table II presents the RQ for each of the radio-nuclides for all receptors obtained using the ERICA Tool. Since the generic reactor releases are controlled during normal operations, the probability of exceeding the screening dose (10µGy h−1) is acceptably lower than 5%. With this result it was recommended that the assessment be terminated at that stage. What is unique about Table III is that it also presents the total RQ for each of the receptors and the corresponding reference organisms that will be at risk. The total RQs for Lokoja and Idah are one fold higher in order of magnitude than those of Ajaokuta and Okene. This variation in the total RQ is determined by the ground level air concentrations of the isotopes.
Risk quotient (RQ) for each radionuclide form exposure to routine releases.
| Reference organism | Lokoja RQ | Okene RQ | Ajaokuta RQ | Idah RQ |
|---|---|---|---|---|
| Mammal (deer) | 4.48×10−06 | 8.99×10−07 | 4.00×10−07 | 2.45×10−06 |
| Mammal (rat) | 4.47×10⁻¹³ | 1.06×10⁻¹⁴ | 4.49×10⁻¹⁴ | 2.75×10⁻¹³ |
| Mammal (deer) | 1.73×10⁻¹¹ | 4.04×10⁻¹² | 1.02×10⁻¹² | 9.16×10⁻¹² |
| Mammal (deer) | 7.33×10⁻¹² | 1.82×10⁻¹² | 6.62×10⁻¹³ | 4.51×10⁻¹² |
| Detritivorous invertebrate | 3.72×10−07 | 8.91×10−08 | 3.45×10−08 | 2.29×10−07 |
| Bird egg | 6.19×10⁻¹⁰ | 1.60×10⁻¹⁰ | 6.87×10⁻¹¹ | 2.97×10⁻¹⁰ |
| Bird egg | 1.36×10−09 | 3.32×10⁻¹⁰ | 8.52×10⁻¹¹ | 1.14×10−09 |
| Reptile | 6.09×10⁻¹³ | 1.42×10⁻¹³ | 4.23×10⁻¹⁴ | 3.75×10⁻¹³ |
| Total RQ | 4.85×10−06 | 9.88×10−07 | 4.34×10−07 | 2.68×10−06 |
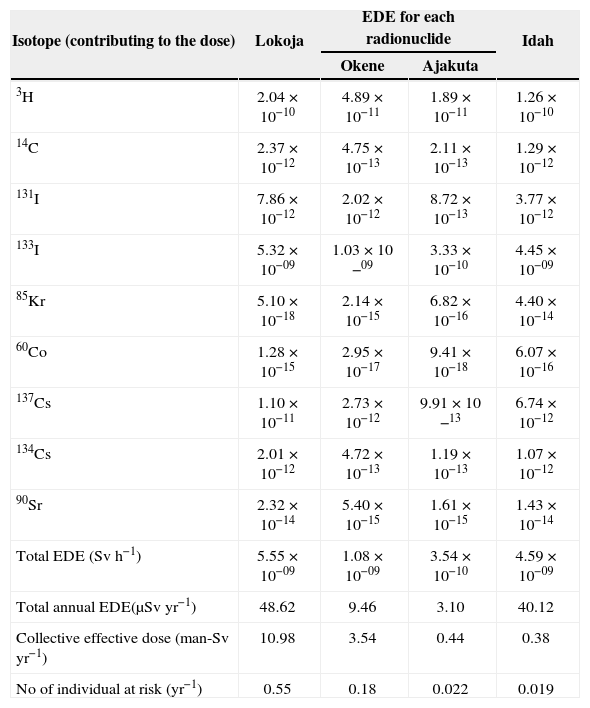
Potential EDE of each isotope and total EDE for each city.
| Isotope (contributing to the dose) | Lokoja | EDE for each radionuclide | Idah | |
|---|---|---|---|---|
| Okene | Ajakuta | |||
| 3H | 2.04×10⁻¹⁰ | 4.89×10⁻¹¹ | 1.89×10⁻¹¹ | 1.26×10⁻¹⁰ |
| 14C | 2.37×10⁻¹² | 4.75×10⁻¹³ | 2.11×10⁻¹³ | 1.29×10⁻¹² |
| 131I | 7.86×10⁻¹² | 2.02×10⁻¹² | 8.72×10⁻¹³ | 3.77×10⁻¹² |
| 133I | 5.32×10−09 | 1.03×10−09 | 3.33×10⁻¹⁰ | 4.45×10−09 |
| 85Kr | 5.10×10⁻¹⁸ | 2.14×10⁻¹⁵ | 6.82×10⁻¹⁶ | 4.40×10⁻¹⁴ |
| 60Co | 1.28×10⁻¹⁵ | 2.95×10⁻¹⁷ | 9.41×10⁻¹⁸ | 6.07×10⁻¹⁶ |
| 137Cs | 1.10×10⁻¹¹ | 2.73×10⁻¹² | 9.91×10⁻¹³ | 6.74×10⁻¹² |
| 134Cs | 2.01×10⁻¹² | 4.72×10⁻¹³ | 1.19×10⁻¹³ | 1.07×10⁻¹² |
| 90Sr | 2.32×10⁻¹⁴ | 5.40×10⁻¹⁵ | 1.61×10⁻¹⁵ | 1.43×10⁻¹⁴ |
| Total EDE (Sv h−1) | 5.55×10−09 | 1.08×10−09 | 3.54×10⁻¹⁰ | 4.59×10−09 |
| Total annual EDE(µSv yr−1) | 48.62 | 9.46 | 3.10 | 40.12 |
| Collective effective dose (man-Sv yr−1) | 10.98 | 3.54 | 0.44 | 0.38 |
| No of individual at risk (yr−1) | 0.55 | 0.18 | 0.022 | 0.019 |
EDE: Effective dose equivalent.
Table III presents potential effective dose equivalents (EDEs) for each isotope. The total annual EDE was obtained by summing the doses for each isotope in each city assuming that the reference population has a daily breathing rate of 22.2 m3, and it spends one third of its time on the contaminated ground; and also by assuming homogeneous concentrations and depositions of the radionuclides in the receptors.
As a further step to predict the radiation impact, the annual collective effective dose (Eq. 9) in the cities due to routine releases was assessed according to the ICRP (1990). Using the 2006 population data from the National Bureau of Statistics (www.geohive.com) and a 2.8% population growth rate, the population as of 2011 was 225 758, 373 833, 140 559, and 91 562 for Lokoja, Okene, Ajaokuta and Idah, respectively.

where SH is the collective effective dose equivalent, H is the annual effective dose equivalent for the city of interest and N is the projected 2011 population of that city based on the last census. Adopting a linear no-threshold (LNT) model, the total health risks due to radiological exposure were assessed by Eq. (10) assuming a homogeneous group of N persons:

where G is the collective health detriment, which was assumed to be proportional to the EDE; and Rk is the radiation risk factor given as 5×10⁻² Sv−1 (ICRP, 2007). This value represents the number of individuals with cancer-related health issues. The risk of incurring a cancer due to the controlled releases of (the selected) radioisotopes in the four cities is small compared to the cancer risk associated with terrestrial gamma radiation in some other cities (Jibiri, 2001) with the same geological formations as the ones considered by the current work.
4.2Results of hypothetical accidents simulationsDuring nuclear accidents, the radionuclides that cause large concern are 137Cs and 131I. The first one has a half-life of 30.0 years and has a detrimental effect on agriculture and stock farming, and thus on human life for decades (Yasunari et al., 2011). Inhaled or ingested, 131I becomes localized in the thyroid gland thereby increasing the risk of thyroid cancer and other thyroid diseases (Hoeve and Jacobson, 2012). Therefore, the post accidental air dispersion of these radioisotopes is relevant for decision making regarding the NPP siting.
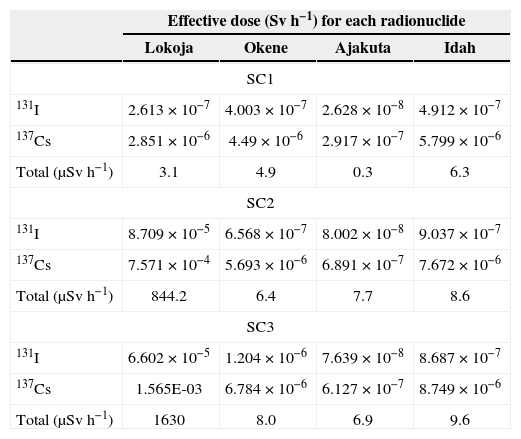
The ground depositions of contaminants (137Cs and 131I ) were relatively low due to the null precipitation that is typical of SC1. The advantage of the meteorological condition of SC1 is that pollutants’ concentrations were diluted by unstable wind. The concentrations and depositions were higher at Idah and Okene, due to the predominant wind direction between hours 10 and 24 (Fig. 6).

The first hypothetical accident scenario (SC1) simulation with identical emission to that of Fukushima was run considering the meteorological conditions of a typical dry season (December, 2011). The second scenario (SC2) considered a rainy day with a relatively small amount of rain (during May, 2011). The third scenario (SC3) considered the meteorology on September 12, a month characterized by heavy rainfall and relatively stable wind speed and direction.
The cases of SC2 and SC3 were typical of Lokoja, having the highest concentrations and depositions as a result of the steadiness of wind directions. In these scenarios the maximum depositions were three times higher in order of magnitude than the SC1 scenario, as shown in Figures 7 and 8, respectively.


The ground level concentrations of 137Cs for SC3 are higher than that of SC2. Another parameter that contributes to the removal of pollutants from the air is scavenging due to radioactive decay. In this case, the longer the half-life, the slower the scavenging due to radioactive decay processes.
Table IV presents the radiation doses that could be associated with each of the simulated scenarios due to their prevailing meteorological conditions. The ground level doses of SC1 are relatively lower than those of SC2 and SC3, as a result of the dilution of the plume’s content by turbulent activities in the air, as the dispersion continued. As mentioned before, the human doses of SC2 and SC3 in each of the cities are higher due to the wet scavenging of the pollutants. In the third scenario, the public dose was higher than in the first two cases because the receptor location (Lokoja) was the most exposed. However, it is important to mention that although this information is relevant for emergency preparedness, radiation carcinogenesis is a complex phenomenon. The results in Table IV are in agreement with those of Aliyu et al. (2014a), which adopt the GENII model for dose calculations on humans.
Radiation doses from the three hypothetical accident scenarios.
| Effective dose (Sv h−1) for each radionuclide | ||||
|---|---|---|---|---|
| Lokoja | Okene | Ajakuta | Idah | |
| SC1 | ||||
| 131I | 2.613×10⁻⁷ | 4.003×10⁻⁷ | 2.628×10⁻⁸ | 4.912×10⁻⁷ |
| 137Cs | 2.851×10⁻⁶ | 4.49×10⁻⁶ | 2.917×10⁻⁷ | 5.799×10⁻⁶ |
| Total (µSv h−1) | 3.1 | 4.9 | 0.3 | 6.3 |
| SC2 | ||||
| 131I | 8.709×10⁻⁵ | 6.568×10⁻⁷ | 8.002×10⁻⁸ | 9.037×10⁻⁷ |
| 137Cs | 7.571×10⁻⁴ | 5.693×10⁻⁶ | 6.891×10⁻⁷ | 7.672×10⁻⁶ |
| Total (µSv h−1) | 844.2 | 6.4 | 7.7 | 8.6 |
| SC3 | ||||
| 131I | 6.602×10⁻⁵ | 1.204×10⁻⁶ | 7.639×10⁻⁸ | 8.687×10⁻⁷ |
| 137Cs | 1.565E-03 | 6.784×10⁻⁶ | 6.127×10⁻⁷ | 8.749×10⁻⁶ |
| Total (µSv h−1) | 1630 | 8.0 | 6.9 | 9.6 |
In this paper, AERMOD (a state of the art atmospheric model) was used to estimate the potential human health and environmental impacts of Nigeria’s pioneer NPP, assuming that a generic reactor design was considered in operation on the selected site.
The dispersion process of a radioactive plume resulting from normal operation and hypothetical accidental releases was simulated, in order to quantify its human health impacts and environmental ramifications. This information will aid decision-making and emergency planning processes on the siting of the NPP.
Annual scaling factors for air concentrations and ground deposition of radioisotopes were used to estimate time-integrated values of the concentrations and depositions of the respective radionuclides during routine operations of the NPP. Although conservative values were adopted for the annual discharge of radionuclides, the study shows that, under normal operation, the NPP would not pose any significant health and environmental hazards.
Three different accident scenarios, which consider various meteorological conditions and a release rate similar to that of Fukushima were simulated in order to assess the human health impact due to radiological exposure. The results show high risks due to rain washout and unstable wind (SC1 and SC2), respectively. Under these scenarios (SC1 and SC2) the high and lethal doses at Lokoja were practically due to high air concentrations and depositions of radioactive iodine (131I)
For SC1, the ground depositions of the contaminants (137Cs and 131I ) were relatively low (compared to SC2 and SC3), which could be attributed to the null precipitation that is typical to SC1. The advantage of the meteorological condition of SC1 is that the pollutant concentrations were diluted by unstable wind.
In all simulations (normal and accidental scenarios), Lokoja, which is located in the predominant wind direction, showed the highest ground level air concentrations and depositions of radioisotopes, vis-à-vis the environmental and human health ramifications.
Although this study shows that routine discharges from the NPP would result in indiscernible environmental and human health impacts, state of the art dose and risk assessment codes (e.g., GENII or DCAL) should be involved in predicting cancer-related mortalities and morbidities as a result of a hypothetical accident in the new NPP, as this will aid decision-making with respect to the licensing of the pioneer NPP by local regulatory organizations.
The maximum depositions of 85Kr were observed in Lokoja and Idah. The ground depositions of the iodine and cesium isotopes were eight and nine times lower in order of magnitude than the ground deposition of 85K (the maximum value was 2.96×101 Bq m−2 for Lokoja). The minimum deposition of cesium and strontium isotopes, with values of 2.35×10⁻⁶ B qm−2 and 2.35×10⁻⁸ Bq m−2 of 137Cs and 90Sr, respectively, was found for Ajaokuta.
Environmental impact assessments (EIA) were conducted in order to determine the potential risks of normal operation releases from the NPP on terrestrial non-human biota. This was based on the ICRP recommendation on the incorporation of EIA in order to support decision-making with regard to the construction and operation of new nuclear facilities (ICRP, 2007). The results show that the probabilities of exceeding the screening dose (10µG h−1) during normal operations is acceptably lower than 5%. With this result, it was recommended that the assessment be terminated at the Tier 1 of the ERICA Tool. However, under hypothetical accident conditions there were cases in which there was a substantial probability of exceeding the screening dose and the assessments were continued to Tier 2.
The techniques used in this analysis have demonstrated that an accident with an identical release rate to that of Fukushima could lead to doses quite higher than the regulatory public dose within the first hour of exposure, and depending on the location of the population center, this could be highly detrimental to exposed individuals.
In a future work we will employ long-range dispersion (global) models (HYSPLIT) to assess the impacts of a new NPP in Itu Nigeria on receptor locations that are hundreds of kilometers away from the NPP site.
AcknowledgmentsOur sincere appreciation goes to the Malaysian Ministry of Higher Education and the Universiti Teknologi Malaysia for providing a research grant (Q.J130000.2526.03H67) from which part of this work was supported.
A.S. Aliyu wishes to acknowledge the support of the Research Management Center of Universiti Teknologi Malaysia for its support through the Post-Doctoral Fellowship scheme, project number Q.J130000.21A2.01E98 under Prof. Ahmad Termizi Ramli.