

The aim of this study was to assess the psychometric properties of the SISCO Inventory of Academic Stress in a Peruvian population.
MethodInformation was obtained from 628 college students belonging to private and public universities. The standard three-dimensional model and a five-factor model were tested by means of confirmatory factor analyses. Furthermore, reliability, measurement invariance across gender and validity related to other variables (perceived social support and academic procrastination) was inspected.
ResultsModels fitted the data adequately and the instrument was invariant across genders. In addition, an adequate reliability index was confirmed and significant associations with related variables were found.
ConclusionsThe current findings reveal that the SISCO Inventory of Academic Stress shows evidence of validity and reliability in Peruvian undergraduate students.
El objetivo de este estudio fue evaluar las propiedades psicométricas del Inventario de Estrés Académico SISCO en una muestra peruana.
MétodoSe obtuvo información de 628 estudiantes universitarios pertenecientes a universidades privadas y públicas. Dos modelos fueron evaluados mediante análisis factorial confirmatorio: el modelo tridimensional estándar y un modelo de cinco factores. Además, se analizó la confiabilidad, la invariancia factorial en función del género y la validez relacionada con otras variables (apoyo social percibido y procrastinación académica).
ResultadosLos modelos se ajustaron adecuadamente a los datos y el instrumento probó ser invariante entre varones y mujeres. Además, se confirmó un índice de confiabilidad adecuado y se encontraron asociaciones significativas con variables relacionadas.
ConclusionesLos hallazgos actuales revelan que el Inventario de Estrés Académico SISCO muestra evidencias de validez y confiabilidad en estudiantes universitarios peruanos.
University life can often be a source of stress; the demands of the education system become increasingly challenging and frequently require a reorganization of the individual. Students have the responsibility of meeting progressively rigorous academic obligations, sometimes within a limited timeframe, and may experience overload of assignments (Eppelmann et al., 2016). Likewise, another potential source of stress arises when parent, teacher, or student expectations cannot be realistically met (Berrío García & Mazo Zea, 2011).
The stress resulting from academic activities undertaken in the educational field and its consequences is often known as academic stress and it affects medium to high level education students. It has a negative effect on variables as diverse as emotional state, physical health or interpersonal relationships, and can be experienced differently for each person.
One of the main concerns in the field of academic stress is the conceptual discrepancy between many different authors (Barraza, 2005). This inconsistency makes it difficult to conceptualize it in an explicit and straightforward manner. In addition to this, stress has even been mistakenly treated as another construct, such as anxiety (Massone & Gonzalez, 2003).
In order to explain the occurrence of academic stress, Barraza (2007) proposes a cognitive systemic model, of an adaptive psychological nature, which occurs in three stages: first, the student is subjected to several evaluation demands in the educational context, which can be considered as stressors (input). Second, these stressors cause a systemic imbalance that manifests itself as various reactions and symptoms (indicators of imbalance) and, finally, the student makes use of a coping strategy (output) to restore the systemic balance.
Within this framework three essential elements can be identified as part of academic stress: stressors, symptoms and coping.
Stressors are events happening in the academic domain that generate stress, such as evaluations, an excessive number of tasks, or the responsibility of obtaining good grades at the university level. Symptoms are, in general terms, our response to stress, which can also be refactored into physical reactions (e.g., increase in heart and respiratory rate, sleep related problems, etc.), psychological reactions (e.g., irritability, restlessness or concentration issues) and behavioral reactions (e.g., difficulty with interpersonal relationships and expressing anger towards others). Finally, coping refers to the utilization of resources available to deal with the situation that caused the stress.
Academic stress and its impact on healthIn this context, it is important to know the impact that academic stress has as a potential cause of health problems; for example, in chronic diseases (Berrío García & Mazo Zea, 2011), cardiovascular diseases and weakened immune system (Trueba, Smith, Auchus, & Ritz, 2013).
Previous studies have documented the association between academic stress and various chronic non-communicable diseases, due to its potential impact on the immune system and metabolism, among other aspects of biochemistry. Research carried out with university students in Venezuela showed immunological changes (significant decrease in lymphocytes) associated with a higher level of stress and mental or emotional breakdown during the most academically demanding periods of time (Guarino, Gavidia, Antor, & Caballero, 2000).
The negative impact of academic stress can go even further and change one's lifestyle. A study conducted in Cuba with college students concluded that, as they approach stressful situations such as an examination period, students develop unhealthy habits like excessive use of caffeine, tobacco and, in some cases, tranquillizers (Puente Fabelo, Mayo Sánchez, Fabelo Roche, & Iglesias Moré, 2014).
Measurements of academic stressHaving established the extent and severity of the impact of academic stress, appropriate assessment tools are required to measure it. Many instruments have been designed to assess academic stress, such as: the Perceived Stress Scale (Cohen, Kamarck, & Mermelstein, 1983); the Academic Stress Inventory (IEA, Hernández, Polo, & Pozo, 1996), the Student-Life Stress Inventory (Gadzella, 1994), and the College Student Stress Scale (Feldt, 2008). Although we cannot deny the great contribution of each of these measurements to the field of academic stress, they present certain shortcomings. Some of these are unidimensional measures containing limited information regarding the construct (Cabanach, Souto-Gestal, & Franco, 2016). For example, the IEA shows greater sensitivity for global assessments of stress than for specific appraisals. Another limitation is that they evaluate stressful circumstances that transcend the academic conditions of university students, such as family or economic aspects.
The SISCO Inventory of Academic Stress is an instrument that negates some of the weaknesses of the aforementioned tools. Among the advantages of this inventory are: its timecost efficiency, its usability with large groups, and its structural design; all of which encompasses the exploration of the pivotal symptoms experienced in academic stress (in the physical, psychological, and behavioral aspects) and provides us with insight into the coping strategies used by the student.
It is important that instruments are suitable for use in any domain. With this in mind, evaluation guidelines were created, in which the reliability and validity of the measurement constitute necessary procedures for tests adaptation (Muñiz, Elosua, & Hambleton, 2013).
SISCO has validated its satisfactory psychometric properties: reliability and evidence of validity by means of internal consistency and contrasting groups that demonstrates its efficacy in a sample of 724 Mexican students (Barraza, 2008).
In Spanish-speaking countries, two instrumental studies analyzing SISCO's structure were found. Jaimes Parada (2008) validated the instrument in a Colombian context with young adults by means of content validity and exploratory factor analyses confirming its basic structure. Likewise, Jimenez Jorge (2013) reported two dimensions; prevalence to academic stress and coping, obtaining a high global reliability (α=.91) for the Cuban population.
In the Peruvian context, SISCO has some popularity and is used for diagnostic purposes, nevertheless it doesn’t have formal validation.
Academic stress and related variablesNumerous factors have been implicated in the complex phenomenon of academic stress. Among them psychosocial variables (coping strategies, social support), psychoeducational variables (academic self-concept, procrastination) and socioeconomic variables (place of residence, scholarships). These variables affect the entire stress process, from the appearance of the causal factors to the consequences themselves (Labrador, 1995).
In this study, we have chosen two important variables that can help explain, on the one hand, the recurrent presence of academic stress such as procrastination, as a risk variable (Barraza & Barraza, 2019) and on the other hand, the coping resource of social support as a protective factor (Glozah, 2013).
Academic procrastination is the improper management of academic time or postponement of activities in the educational field. Its prevalence is high among university students (Mortazavi, 2016).
Various past research findings reflect medium to large associations between perceived academic stress and procrastination (Furlan, Ferrero, & Gallart, 2014). In a study conducted by Cardona (2015), students who postpone a task were concerned about participating in class, identifying this as a stressor. In addition, they presented physical (chronic fatigue, restlessness) and psychological symptoms (concentration problems) typical of academic stress. Likewise, Córdova (2018) indicates that levels of procrastination decrease when the student makes use of adequate coping strategies.
Stress and procrastination have also been associated with variables such as mental symptoms, indicating that students with elevated academic stress and procrastination predisposition are more likely to present mental and physical symptoms (Furlan et al., 2014).
Another variable that has been proven related to academic stress is social support. Rayle and Chung (2007) concluded that social support of family and friends can reduce some academic stressors. Likewise, coping is positively associated with university adjustment. Social support is an important factor in this matter (Chao, 2012; Salami, 2011). The study of Symister and Friend (2003) showed that social support was positively related to health and to the recovery from illnesses. The feeling of having social support can reduce the negative impact of stress on various health problems. On the other hand, social support can strengthen the sense of control and the ability to cope more effectively with illnesses, for example by reducing the amount of medication required and improved recovery times.
In the present study, we hypothesized a positive correlation between academic stress and academic procrastination, specifically:
- -
The more symptoms and stressors perceived by the students, the more they procrastinate.
- -
The more coping strategies they use, the less they procrastinate. On the other hand, we hypothesized a negative correlation between academic stress and perceived social support:
- -
The more symptoms and stressors the students experience, the less social support they perceive.
- -
The more coping strategies they use, the more social support is perceived.
Research in academic stress has shown statistically significant differences depending on the gender. It was found that the level of perceived academic stress reported is greater in female students compared to their male counterparts. In a study carried out by Bedoya-Lau, Matos, and Zelaya (2012) with 187 Peruvian university students, 77.5% of them showed a prevalence of academic stress; the levels being higher among female students.
Likewise, in a study conducted by Backović, Živojinović, Maksimović, and Maksimović (2012) female students reported higher rates of academic stress and expressed that the main stressor which affected their perception of physical health was the examination period.
The present research study was designed with the following goals: First, to examine the three-dimensional factor structure of the SISCO Inventory of Academic Stress in a Peruvian population; second, to analyze the internal consistency of the scale, third, to determine criterion validity of the SISCO inventory with measurements of procrastination and perceived social support and, finally, to conduct a measurement invariance analyses across gender lines to evaluate if the factor structure is consistent in both groups and if this is the case, to compare means across groups.
MethodsParticipantsThe sample comprised 628 undergraduates from psychology and education faculty in three universities within the area of Metropolitan Lima using a non- probability convenience sampling technique. Age ranged from 19 to 34 years (M=21.78; SD=4.08).
From the total, 18.8% of the participants had a scholarship, and 49.2% had repeated at least one course. In addition, 290 (46.3%) were part-time workers (for at least two hours per week), while the remaining subjects were full-time students (F=336; 53.7%). Females constituted 69.2% of the total sample.
InstrumentsThe SISCO Inventory of Academic Stress (SISCO; Barraza, 2006)The SISCO Inventory is a measure of academic stress in students of upper education or postgraduates. Consists of 31 items including three broad factors: Stressors, Symptoms and Coping. The first item is intended to filter which respondents are suitable candidates to answer the questionnaire. The subsequent item measures the perceived intensity of academic stress. Stressors (first factor, 8 items) represent the frequency in which the demands of the environment are valued as stressors; Symptoms (second factor, 15 items) indicate the frequency in which the symptoms are presented; and Coping (third factor, 6 items), identify the frequency of coping strategies.
Responses are provided on a 5-point Likert type scale anchored by 1 (never) to 5 (always).
The original version by Barraza (2006) showed a three-dimensional factor structure and good internal consistency.
Social Support-Appraisals scale (SS-A; Vaux et al., 1986)The SS-A is a 15-item instrument that highlights the degree to which a person feels loved and part of a group such as family or friends. The items are distributed in three factors: Family (6 items), friends (6 items) and others (3 items). Participants responded to each statement on a four-point Likert scale ranging from totally agree to totally disagree.
For this study we used the validated version for the Peruvian context (Manrique-Millones, Millones-Rivalles, & Manrique-Pino, 2019), in which the SS-A presented good fit indexes. Likewise, all subscales had acceptable internal consistency.
Procrastination Assessment Scale-Students (PASS; Solomon & Rothblum, 1984)The PASS evaluated the frequency of cognitive-behavioral antecedents of procrastination. By means of the present study we used the subscale Reasons to Procrastinate. It encompasses 26 items. Responses to these items were assessed using a five- point scale ranging from 1 to 5. By means of the present study, internal consistency and confirmatory factor analyses (CFA) were conducted indicating that the instrument presented good reliability (α=.88) and acceptable fit indexes (RMSEA=.08, SRMR=.08 CFI=.94).
ProceduresData was collected in three private universities in Metropolitan Lima upon authorization from the head office, as well as approval for instrument use and validation from the original author.
After giving a full explanation of the study objectives and the conditions of anonymity, students were invited to participate. A consent form to be signed by students was requested the day of the data collection. Administration of the instruments was collective and conducted in the participants’ classrooms during the beginning of a regular class.
Statistical analysisTwo hypothesized models were tested by means of CFA using Lisrel 9.2. Related issues of multivariate non-normality (Jöreskog & Sörbom, 2015) and because of the ordinal scale nature of the items indicated that Diagonally Weighted Least Squares DWLS (with asymptotic covariance and polychorical correlation matrices) was the best estimation method to evaluate model fit. Accordingly, Satorra-Bentler scaled chi-square statistics (S-Bχ2) were used, likewise Comparative Fit Index (CFI), the Root Mean Square Error of Approximation (RMSEA) and the Standardized Root Mean Squared Residual (SRMR). An acceptable model fit is considered when CFI is close to .90 and a good fit when CFI is above .95. RMSEA/SRMR values of .08 show an acceptable fit and close or below .06 indicates good fit (Hu & Bentler, 1999).
A Satorra-Bentler scaled chi-square difference test (ΔS-Bχ2) and an Akaike Information Criterion (AIC) evaluation were performed to determine the equivalence of the two models. A significant S-Bχ2 difference and lower AIC/BIC values result in an improved model fit.
Reliability was evaluated with Jöreskog's Rho (ρ).
Measurement Invariance Analysis was performed to investigate whether the internal structure differs across gender. A stepwise Multi Group Confirmatory Factor Analysis (MGCFA) was used to evaluate nested models with gradually increasing parameters constraints. Invariance of the measurement model was tested in terms of factorial structure (configural invariance); in a subsequent model we assessed item loadings in factors (metric invariance); a third model in which the intercepts are set equal across groups (scalar invariance) was evaluated and finally invariance of measurement errors was tested, in which all error variances are constrained to be equal across groups.
The goodness-of-fit of the unconstrained model was evaluated using specific criteria to assess the differences in fit between successive levels of measurement invariance. Such differences should not exceed .010 for the CFI (ΔCFI<.010; Cheung and Rensvold, 2002), .015 for the RMSEA. The remaining statistical analyses were performed on SPSS version19©.
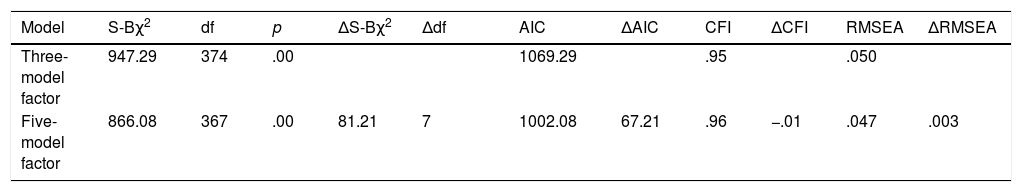
ResultsConfirmatory factor analysis. CFA was performed in order to determine if the factor structure of the scales could be retrieved in a Peruvian sample. Two models were evaluated: The standard three-dimensional model structure and a five-factor model which emerges from the sub-scale symptoms. Table 1 reports the results for the two models. In general, both models showed good fit of the data, with RMSEA=.050, (CI 90%=.046–.054) CFI=.95 and SRMR=.062 for the three-factor model and RMSEA=.047, (CI 90%=.043–.051), CFI=.96 and SRMR=.060 for the five-factor model. Particularly, the five-factor model resulted in a slightly better absolute fit, as indicated by strong goodness of fit indexes, significant S-Bχ2 differences and a reduced of AIC criteria compared with the three-dimensional model.
Summary of confirmatory factor analyses fit indices.
| Model | S-Bχ2 | df | p | ΔS-Bχ2 | Δdf | AIC | ΔAIC | CFI | ΔCFI | RMSEA | ΔRMSEA | |
|---|---|---|---|---|---|---|---|---|---|---|---|---|
| Three-model factor | 947.29 | 374 | .00 | 1069.29 | .95 | .050 | ||||||
| Five-model factor | 866.08 | 367 | .00 | 81.21 | 7 | 1002.08 | 67.21 | .96 | −.01 | .047 | .003 |
Note. S-Bχ2=Satorra–Bentler scaled chi-square value; df=degrees of freedom; ΔS-Bχ2=Satorra–Bentler scaled chi-square difference test; AIC=Akaike information criterion; ΔAIC=Akaike information criterion difference test; CFI=comparative fit index; ΔCFI=comparative fit index difference test; RMSEA=root mean square error of approximation; ΔRMSEA=root mean square error of approximation difference test.
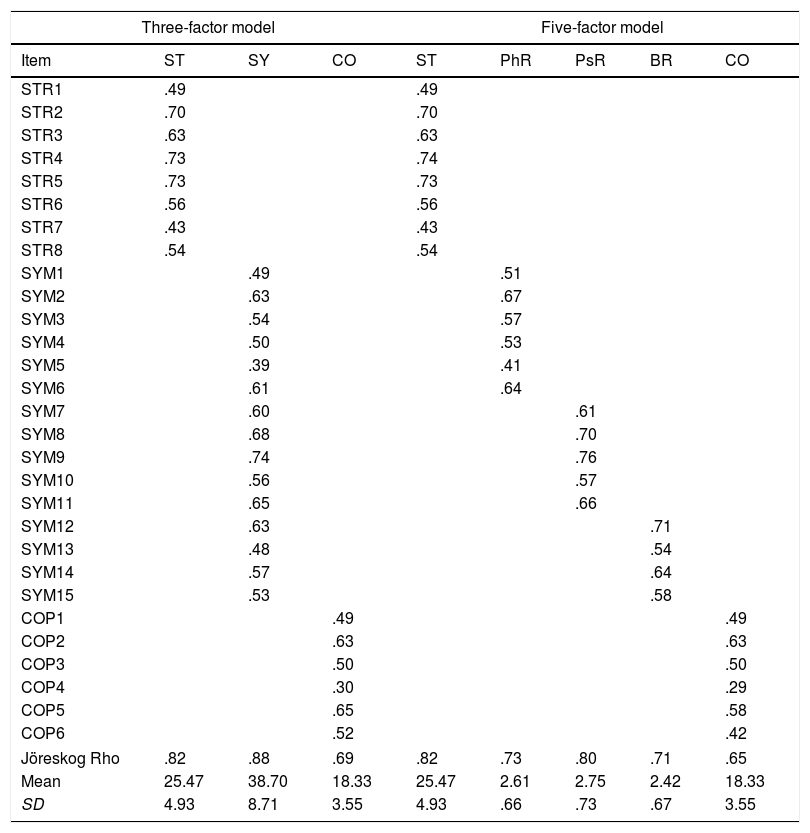
Table 2 displays the complete standardized factor loadings of the two models assessed in which all of them were significant.
SISCO inventory primary factor loadings, internal consistency, means and standard deviations for the three- and five-factor models.
| Three-factor model | Five-factor model | |||||||
|---|---|---|---|---|---|---|---|---|
| Item | ST | SY | CO | ST | PhR | PsR | BR | CO |
| STR1 | .49 | .49 | ||||||
| STR2 | .70 | .70 | ||||||
| STR3 | .63 | .63 | ||||||
| STR4 | .73 | .74 | ||||||
| STR5 | .73 | .73 | ||||||
| STR6 | .56 | .56 | ||||||
| STR7 | .43 | .43 | ||||||
| STR8 | .54 | .54 | ||||||
| SYM1 | .49 | .51 | ||||||
| SYM2 | .63 | .67 | ||||||
| SYM3 | .54 | .57 | ||||||
| SYM4 | .50 | .53 | ||||||
| SYM5 | .39 | .41 | ||||||
| SYM6 | .61 | .64 | ||||||
| SYM7 | .60 | .61 | ||||||
| SYM8 | .68 | .70 | ||||||
| SYM9 | .74 | .76 | ||||||
| SYM10 | .56 | .57 | ||||||
| SYM11 | .65 | .66 | ||||||
| SYM12 | .63 | .71 | ||||||
| SYM13 | .48 | .54 | ||||||
| SYM14 | .57 | .64 | ||||||
| SYM15 | .53 | .58 | ||||||
| COP1 | .49 | .49 | ||||||
| COP2 | .63 | .63 | ||||||
| COP3 | .50 | .50 | ||||||
| COP4 | .30 | .29 | ||||||
| COP5 | .65 | .58 | ||||||
| COP6 | .52 | .42 | ||||||
| Jöreskog Rho | .82 | .88 | .69 | .82 | .73 | .80 | .71 | .65 |
| Mean | 25.47 | 38.70 | 18.33 | 25.47 | 2.61 | 2.75 | 2.42 | 18.33 |
| SD | 4.93 | 8.71 | 3.55 | 4.93 | .66 | .73 | .67 | 3.55 |
Note. ST= stressors, SY=symptoms, CO=coping, PhR=physical response, PsR=psychological response, BR=behavioral response.
Measurement invariance. To test whether the factor structure is comparable for female and male students, a MGCFA was conducted for the three-factor model.
The fit of the configural model was acceptable SBS-χ2 (748)=1279.801, CFI=.95, RMSEA=.051 [90%CI .046, .055]. In Step 2, the factor loadings (Λ) were constrained to be equal groups. This level of invariance was nested within the previous model (configural). The fit of this model was also acceptable SBS-χ2 (777)=1326.126, CFI=.95, RMSEA=.051 [90%CI .046, .056]. There is a tendency to look at the difference between CFI values, suggesting that difference values should not exceed .01 (Byrne, 2008). Relying on this criterion, factor loadings between girls’ and boys’ sample were considered invariant. Further, in step 3, the fit of the scalar model (intercepts constrained to be equal across groups) was again acceptable SBS-χ2 (780)=1327.067, CFI=.95, RMSEA=.051 [90%CI .046, .055]. Finally, in step 4 error invariance was constrained to be equal across groups with an acceptable fit SBS-χ2 (809)=1336.727, CFI=.95, RMSEA=.049 [90%CI .044, .053].
Group comparisons in academic stress. Sex differences were conducted by means of t-test. Concerning stressors subscale results revealed that women were more likely than men to score high in stressors t(560)=−2.90, p=.004. Similar findings emerged for the symptoms subscale, women were found to have higher rates than men t(609)=−3.97, p<.001. There were no gender differences regarding coping subscale.
Reliability.Table 2 shows Jöreskog's Rho's (ρ). All sub-scales present acceptable internal consistency above .50 (George & Mallery, 2003), ranging from .69 to .88.
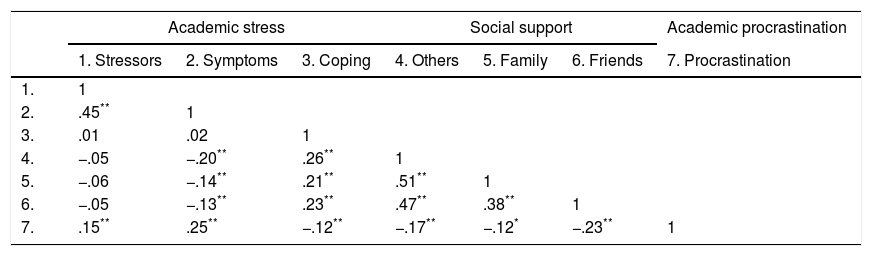
Validity related to other variables. Correlations between the SISCO and related variables – Perceived Social Support and Academic Procrastination- are included in Table 3.
Main results of correlation analyses with academic stress, perceived social support and academic procrastination.
| Academic stress | Social support | Academic procrastination | |||||
|---|---|---|---|---|---|---|---|
| 1. Stressors | 2. Symptoms | 3. Coping | 4. Others | 5. Family | 6. Friends | 7. Procrastination | |
| 1. | 1 | ||||||
| 2. | .45** | 1 | |||||
| 3. | .01 | .02 | 1 | ||||
| 4. | −.05 | −.20** | .26** | 1 | |||
| 5. | −.06 | −.14** | .21** | .51** | 1 | ||
| 6. | −.05 | −.13** | .23** | .47** | .38** | 1 | |
| 7. | .15** | .25** | −.12** | −.17** | −.12* | −.23** | 1 |
Note. *p≤.05; **p≤.01.
With regard to perceived social support, all three subscales (friends, family and others) showed meaningful negative associations with subscale symptoms (r=−.13, r=−.14 and r=−.20, respectively) and a significant positive relationship with subscale coping.
Concerning academic procrastination, subscale reasons to procrastinate was positive associated with subscale symptoms (r=.25) and stressors (r=.15) but have an inverse association with subscale coping (r=−.12).
DiscussionUniversity life starts off with an overwhelming amount of challenges, which over time take their toll on the student (Caldera-Montes, Reynoso-González, Gómez-Covarrubia, Mora-García, & Anaya-González, 2017). Understanding how people experience and cope with these situations is crucial. Reliable instruments that measure the level of academic stress are necessary for providing valuable information.
While some well-known instruments, which measure academic stress, present some limitations, such as unidimensionality and/or global appraisals assessments, there are good alternatives, such as the SISCO Inventory of Academic Stress, a sound psychometric tool.
The main objective of this paper is to analyze the psychometric properties of the SISCO Inventory of Academic Stress in the Peruvian context. Results support SISCO as an instrument that has evidence of validity. The factor structure was confirmed based on the theory and previous research studies (Barraza, 2006).
Reliability of the main sub-scales was deemed acceptable, as it was above the threshold mentioned by George and Mallery (2003). These results resemble the ones obtained in the original instrument and the study conducted in the Colombian sample (Jaimes Parada, 2008). In the Peruvian context, Rosales Fernández (2016) performed analyses of reliability in their pilot study with satisfactory results.
The multigroup CFA verified the existence of configural, scalar, metric and error variance invariance. For some authors, fulfillment of the first three constraint models is a sufficient condition to meet instrument measurement invariance. In this study, a strict factorial invariance, from which a quantitative comparative perspective provides a valid basis for making group comparisons, was also considered a necessary condition. In this regard, results reflected that overall, females had higher levels of academic stress than their male peers, specifically in the symptoms and stressors subscales. These results are consistent with those found by many other authors (Backović et al., 2012). For example, a study by Misra and Castillo (2004) showed that female college students reported greater academic stress than male college students in three specific areas: frustration dealing with delays in reaching goals, daily hassles, or failure to reach objectives; pressure, such as deadlines, or overload of activities; and self-imposed stress. Overall, such gender differences might be explained by women openly expressing their emotions more comfortably than men. Whereas men are reluctant to express their thoughts of not being able to deal with stressful situations. This might reflect gender socialization in the sense that women are encouraged to openly communicate their feelings, while men are discouraged from doing so because it might be seen as a sign of vulnerability.
Our last objective was to test the validity related to other variables, and in this sense, we could find relationships among perceived social support, procrastination and academic stress.
In agreement with previous studies, the results of this research showed that stress symptoms correlated negatively with social support. Such results shed light on the important role played by family, friends and significant others in the perception and management of academic stress. From the three different kind of responses, students scored higher in psychological symptoms, specifically restlessness, or inability to remain calm, and expression of concentration issues. Likewise, coping subscale was positively associated with social support, meaning that as more social support is perceived, the use of stress coping strategies increases.
With regard to procrastination and its relation to academic stress, a positive association among both variables was corroborated. In other words, the greater the presence of academic stress, the greater the tendency for procrastination. Another study, such as that of McCown, Blake, and Keizer (2012), is in agreement with the present research results. It shows that stress and academic procrastination are correlated in a meaningful way, while highlighting further that defeatism and difficulty to efficiently perform tasks are associated with high levels of stress and anguish. Concerning the subscale coping and its relationship with academic procrastination, an inverse association between both variables was found and is supported by previous studies (Sirois, 2014).
Although in general terms, the results of this study provide psychometric support to the SISCO Inventory of Academic Stress, some limitations must be acknowledged. First, although significant links between the studied variables were demonstrated, the cross-sectional nature of the data did not allow for the evaluation of causal relationships. Further longitudinal research is therefore needed to verify the direction of such associations. Second, the sample consisted of undergraduate individuals with a narrow age range. Accordingly, further study should analyze the psychometric properties of SISCO with other population segments (e.g. master students or high school students). Third, the current study was limited to self-report data, which may raise potential problems related to desirability bias and tiredness, both of which can skew the results.
Irrespective of the aforementioned shortcomings, the potential utility of the SISCO Inventory in educational/clinical settings is not diminished. The results provided in this study constitute a worthy contribution, by showing evidence of validity and reliability of the SISCO Inventory as a compelling instrument applicable to Peruvian undergraduate students.
Statement of transparencyD. Manrique Millones on behalf of the co-authors guarantee the accuracy, transparency and honesty of the data and information contained in the study.
Informed consent was obtained from all the participants. No relevant information has been omitted and all discrepancies between authors have been adequately resolved and described.
Authors’ contributionsD. Manrique-Millones conceived the study, performed the main statistical analyses (CFA and MGCFA) and wrote the first draft of the manuscript.
R. Millones-Rivalles was involved in the design of the study, literature review of the introduction section and made substantial contributions with the statistical analyses. O. Manrique-Pino, made substantial contribution in the acquisition and interpretation of the data.
D. Manrique-Millones, R. Millones-Rivalles, O. Manrique-Pino, have contributed to the final version of the manuscript which have read and approved for submission to the journal. All the authors assume the ethical commitments derived of this document publication.
FundingNo specific funding.
Conflicts of interestsThe authors declare that they have no conflicts of interests.