


Conventional transarterial chemoembolization (cTACE) has several limitations due to the lack of standardization. The aim of this study was to evaluate the chemical and physical characteristics and behaviors over time of emulsions for cTACE and to assess intra- and inter-operator variabilities in the preparation processes.
Materials and MethodsThis in vitro study involved evaluation of emulsions for cTACE prepared using two methods: water-in-oil (WiO) and chemotherapeutic-in-oil (CiO). Three emulsions were prepared with each method and obtained after 20, 50, and 100 pumping exchanges. A drop from each final mixture was analyzed via light microscopy (time 1) and after 5, 10, 15, and 20min since the end of preparation. After 20min, all preparations were re-mixed and new drops were re-evaluated. The intra- and inter-operator variabilities were analyzed.
ResultsThe mean droplet diameter decreased non-significantly when the number of pumping exchanges increased and increased significantly over time for both WiO and CiO. The droplets returned to their initial diameters after re-mixing. There were no significant differences in the intra- and inter-operator variabilities (P>0.01).
ConclusionsAny interventional radiologist, regardless of their experience, may prepare these emulsions. These data may represent a set of instructions to standardize cTACE.
The incidence of hepatocellular carcinoma (HCC) has been increasing over the last decade, and HCC is now the fifth most common cancer and one of the most common causes of cancer-related deaths worldwide, with a low 5-year survival rate (10%–15%) [1–5]. Curative treatments for HCC can be applied only in very early/early stages of liver disease accounting for <20% cases at presentation [6,7]. Unfortunately, many patients with HCC are diagnosed at intermediate stage [5,7,8] in which trans-arterial chemoembolization (TACE) is usually indicated [6,9,10].
Currently, various chemoembolization regimens are available and applied worldwide. The two principal TACE techniques are conventional TACE (cTACE) and drug-eluting bead TACE (DEB-TACE). In cTACE, a drug carried by lipiodol is administered as an arterial injection, followed by arterial embolization [11]. This technique has several limitations because of the lack of standardization at every step [12], starting from the choice of the drug (none is significantly more effective than the others) until the embolization endpoint [13]. This lack of standardization introduces many biases that limit comparisons of previously published series of patients treated with cTACE. Furthermore, patients with intermediate-stage HCC represented a markedly heterogenous population; in fact, a panel of experts proposed a sub-classification of this category in order to facilitate its clinical management [14]. Therefore, it is important to not introduce another bias related to TACE procedure. Finally, a common and widely approved standard for chemoembolization is advocated.
The second chemoembolization modality, DEB-TACE, was introduced in interventional radiological practice to address the issue of standardization [15]. DEB-TACE is characterized by arterial injection of the drug directly loaded on embolization particles (microspheres) that function as drug carriers [16]. Standardization of this technique combining the cytotoxic and ischemic effects is ensured by calibrating the microspheres to load the same amount of drug. Moreover, these microspheres are commercially available in various diameters [17,18]. Small microspheres can run distally in the vessels, allowing the release of chemotherapeutic agents very close into the tumor. In fact, DEB-TACE appears to be more effective in terms of greater tumor response and less toxic effects when using small microspheres than when using large ones [17]. Nonetheless, the superiority of DEB-TACE over cTACE has never been confirmed [19]. In particular, DEB-TACE and cTACE were equally effective and safe, with the only advantage of DEB-TACE being less post-procedural abdominal pain [19]. Moreover, DEB-TACE has higher immediate costs than cTACE [20]. Therefore, many interventional radiology centers worldwide continue to use cTACE [21,22].
In general, preparation of the cTACE mixture involves two main possible modalities: (i) the water-in-oil (WiO) technique, in which the final emulsion contains a chemotherapeutic agent diluted with an aqueous solution (or contrast media) and subsequently mixed with lipiodol, and (ii) the chemotherapeutic-in-oil (CiO) technique, in which the final emulsion contains the drug mixed directly in lipiodol [23,24]. Although several studies have reported detailed preparations of these emulsions [23,24], many questions remain unanswered. The first question is what happens when the number of mixes is changed? The second question is what happens to the emulsions over time? Finally, the third question is what are the intra- and inter-operator variabilities in the preparation of emulsions using different methods?
In this context, the aims of this study were to evaluate in vitro chemical and physical characteristics and behaviors over time of emulsions for cTACE prepared using two different methods and to assess the intra- and inter-operator variabilities in the preparation processes.
2Materials and methodsThis study did not involve human or animal subjects or patients and, therefore, Institutional Review Board approval was not required.
2.1cTACE emulsionsThe in vitro study evaluated two different cTACE emulsions: WiO and CiO. All emulsions were prepared under a suction hood to avoid aerial toxicity of chemotherapeutic agents. The emulsions were prepared by two different operators, one (XX) with over 15 years of experience in interventional radiology and another (XX) with 5 years of experience in the same radiological field.
2.1.1WiO preparationThe WiO preparation started with dilution of the chemotherapeutic agent with water. A non-ionic contrast agent was used instead of water for preparing an aqueous solution of epirubicin because it increases the density of the drug solution, which improves the stability of the final drug/lipiodol emulsion by lowering gravity-induced sedimentation [25]. To improve WiO emulsion, the volume of drug aqueous solution was kept lower than that of lipiodol: the ideal ratio is one volume of drug to two volumes of lipiodol [26]. For this, 5mL of Iomeron 350® iodine contrast agent (Bracco, Milan, Italy) and 10mL of standard iodized oil (Lipiodol®; Guerbet, Milan, Italy) were aspirated using a 10-ml Luer lock syringe and added to a vial with epirubicin powder (50mg; Farmorubicin; Pfizer, Latina, Italy); the mixture was shaken manually. Subsequently, when the epirubicin powder had dissolved in the contrast agent to form a homogenous solution, it was aspirated using a 20-ml Luer lock syringe. A three-way stopcock was used to mix the solution with 10mL lipiodol already aspirated with an additional 20-ml Luer lock syringe. The contents of the syringe loaded with the drug were first pushed toward the syringe containing lipiodol to form the WiO emulsion with drops of the drug within lipiodol [27]. The chemotherapeutic aqueous solution and lipiodol were vigorously mixed using a three-way stopcock to generate sufficient energy to reduce droplet size [26].
2.1.2CiO preparationThe CiO emulsion was obtained by directly mixing the chemotherapeutic agent with lipiodol. Specifically, 10mL lipiodol was aspirated using a 10-ml Luer lock syringe and directly introduced in a vial of epirubicin powder (50mg); the mixture was manually shaken. Subsequently, when epirubicin powder was mixed with lipiodol, the vial contents were aspirated using a 20-ml Luer lock syringe and mixed using a three-way stopcock and another 20-ml Luer lock syringe.
2.2Droplet assessmentsThe most important investigation regarding WiO preparation has found that the smaller the particles, the better their ability to reach the smaller tumoral neovessels [18]. Based on this finding, at least 20 pumping exchanges through the stopcock are required to obtain an internal phase droplet size in the range of 70–100μm [24].
In normal pathophysiology, HCC vascularity results in microscopic arteriovenous shunting that bypasses the tumor capillaries and flows directly to the lung. Therefore, small particles can bypass the vascular microcirculation of the tumor and liver, causing non-target chemoembolization, which is the known risk of pulmonary and non-target chemoembolization. However, droplets or microspheres with a caliber of ≥50–70μm cannot pass through any shunts because of their higher caliber, preventing the risk of pulmonary and non-target chemoembolization [28]. An internal phase droplet size in the range of 70–100μm is obtained with at least 20 pumping exchanges through the stopcock [24]. To the best of authors’ knowledge, there have been no quantitative investigations into the eventual internal phase droplet size after more than 20 vigorous pumping exchanges through the stopcock. Therefore, in this study, three emulsions with each technique, WiO and CiO, were prepared with 20, 50, and 100 vigorous pumping exchanges at a standard speed of 1 push/s using a three-way stopcock and two 20-ml Luer lock syringes. Furthermore, changes in different mixtures over time after preparation were determined. The procedure to track any changes was as follows. First, a drop was obtained from each of the six mixtures after preparation, was placed on a transparent slide, and immediately analyzed via light microscopy (time 1). A new drop from each preparation was obtained at 5 (time 2), 10 (time 3), 15 (time 4), and 20 (time 5) minutes after preparation without mixing again and analyzed via light microscopy. Finally, after 20min, all preparations were re-mixed and a new drop was again evaluated via light microscopy (time of re-mix, TR).
The light microscope was connected to a digital camera, and preparations from each passage were photographed. The measurements were made using tools of ImageJ (National Institutes of Health, Bethesda, Maryland, USA). The preparations were qualitatively evaluated via light microscopy for droplet margins. For each preparation, mean droplet diameter (± standard deviation [SD]) and droplet diameter range were evaluated.
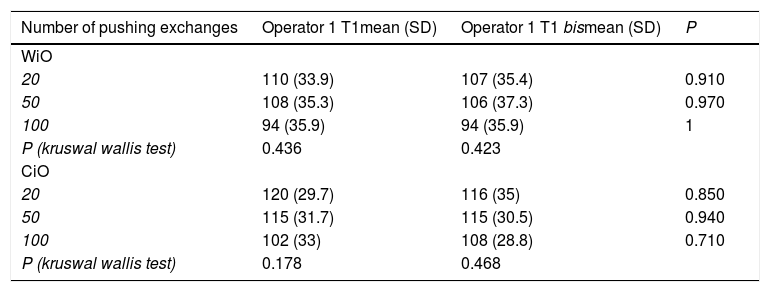
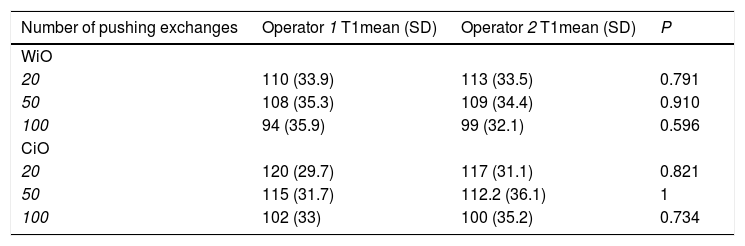
The same operator prepared two emulsions after 20, two after 50 and two after 100 pumping exchanges at different times (time 1 and time 1 bis) to calculate the intra-operator variability in mean droplet diameter for both WiO and CiO. Thereafter, the inter-operator variability in mean droplet diameter was calculated under the same conditions.
2.3Statistical analysisThe data collected during the study were summarized by groups and compared using descriptive statistical methods. Continuous variables were reported as mean and SD, while categorical variables as number and percentage. The normal distribution of droplets diameter among 10 evaluations performed by each operator at each time was checked with Shapiro-Wilk test. Variables with a normal distribution were compared using the t-test whereas variables without normal distribution were analyzed by the U-Mann-Whitney test or Kruskal Wallis test. Comparisons were made among two sets of pushing exchanges by the same operator (XX), at each number of pushing exchanges category (20, 50 or 100 pushing exchanges), among operators (XX vs XX) and at each time of droplet from preparation (times 1, 2, 3, 4, 5). The limit of statistical significance was set at P<0.05. Statistical analyses were performed using Stata/SE (Version 14.2; Stata Corp, Texas, United States of America) for Windows.
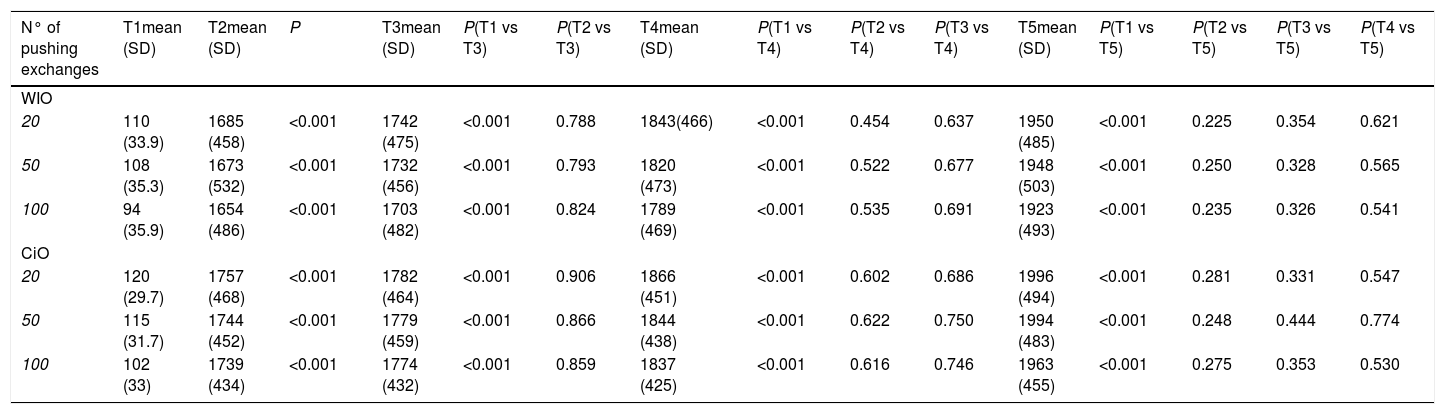
3Results3.1WiO preparationThe droplet margins of all WiO preparations appeared homogenously round regardless of their size. The mean droplet diameters (± SD) and the droplet diameter ranges of each WiO preparation (after 20, 50, and 100 pumping exchanges) at the different times (1, 2, 3, 4, 5, and TR) are presented in Table 1. The mean droplet diameter increased significantly over time (time 1 until 5) because the droplets tended to aggregate. The largest dimensional increase in droplet diameter occurred as early as 5min after preparation (110μm at time 1 vs. 1685μm at time 2; P<0.001) (Table 2) (Fig. 1). Conversely, mean droplet diameter did not increase significantly from time 2 until 5 (P>0.05). Upon re-mixing the preparations after 20min, droplet diameter returned to a value comparable to that at time 1. The mean droplet diameter decreased with increase in the number of pumping exchanges, although not significantly (P=0.436) (Table 3). There were no significant differences in intra-operator (Table 3) and in inter-operator variabilities (Table 4).
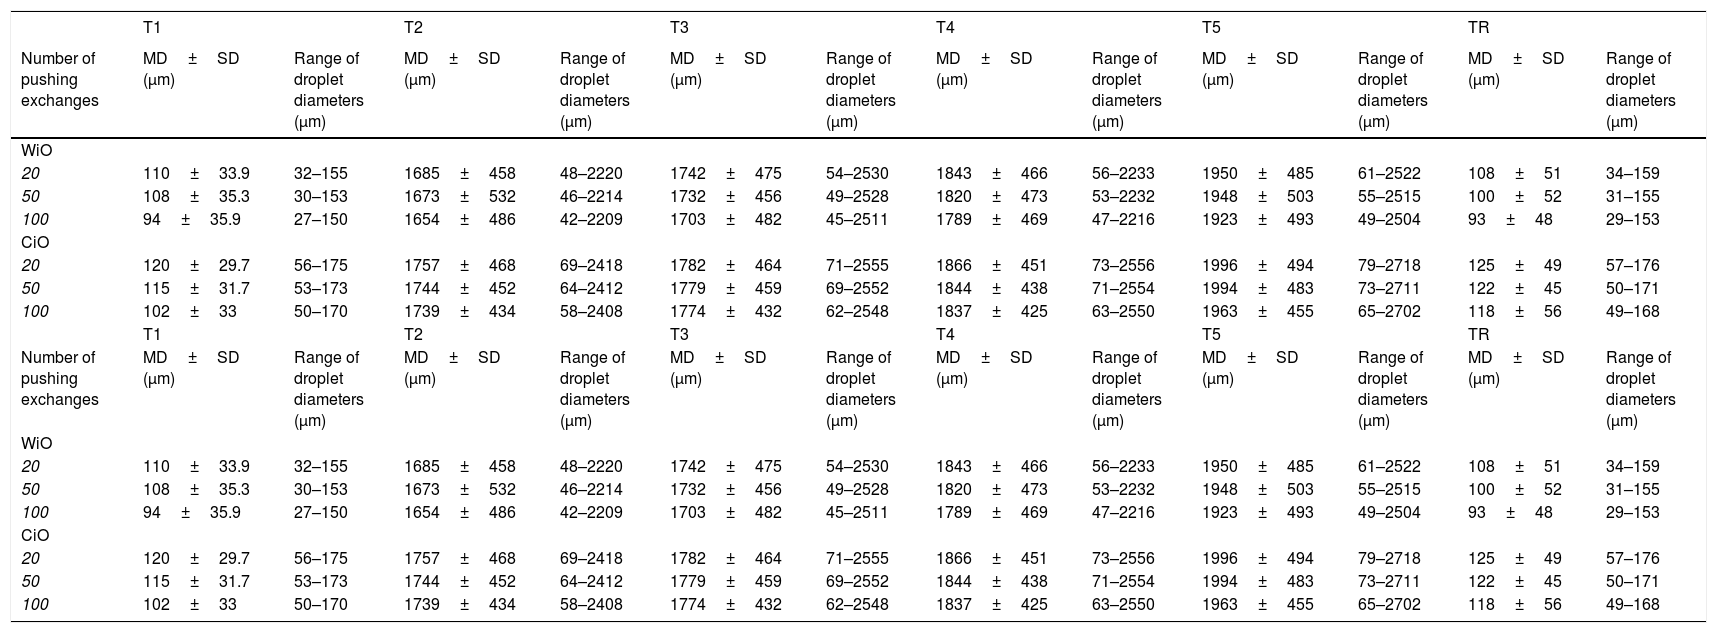
Characteristics of droplets in water-in-oil and chemotherapeutic-in-oil emulsions after different pumping exchanges and at different times after preparation for the leading operator (XX).
| T1 | T2 | T3 | T4 | T5 | TR | |||||||
|---|---|---|---|---|---|---|---|---|---|---|---|---|
| Number of pushing exchanges | MD±SD (μm) | Range of droplet diameters (μm) | MD±SD (μm) | Range of droplet diameters (μm) | MD±SD (μm) | Range of droplet diameters (μm) | MD±SD (μm) | Range of droplet diameters (μm) | MD±SD (μm) | Range of droplet diameters (μm) | MD±SD (μm) | Range of droplet diameters (μm) |
| WiO | ||||||||||||
| 20 | 110±33.9 | 32–155 | 1685±458 | 48–2220 | 1742±475 | 54–2530 | 1843±466 | 56–2233 | 1950±485 | 61–2522 | 108±51 | 34–159 |
| 50 | 108±35.3 | 30–153 | 1673±532 | 46–2214 | 1732±456 | 49–2528 | 1820±473 | 53–2232 | 1948±503 | 55–2515 | 100±52 | 31–155 |
| 100 | 94±35.9 | 27–150 | 1654±486 | 42–2209 | 1703±482 | 45–2511 | 1789±469 | 47–2216 | 1923±493 | 49–2504 | 93±48 | 29–153 |
| CiO | ||||||||||||
| 20 | 120±29.7 | 56–175 | 1757±468 | 69–2418 | 1782±464 | 71–2555 | 1866±451 | 73–2556 | 1996±494 | 79–2718 | 125±49 | 57–176 |
| 50 | 115±31.7 | 53–173 | 1744±452 | 64–2412 | 1779±459 | 69–2552 | 1844±438 | 71–2554 | 1994±483 | 73–2711 | 122±45 | 50–171 |
| 100 | 102±33 | 50–170 | 1739±434 | 58–2408 | 1774±432 | 62–2548 | 1837±425 | 63–2550 | 1963±455 | 65–2702 | 118±56 | 49–168 |
| T1 | T2 | T3 | T4 | T5 | TR | |||||||
| Number of pushing exchanges | MD±SD (μm) | Range of droplet diameters (μm) | MD±SD (μm) | Range of droplet diameters (μm) | MD±SD (μm) | Range of droplet diameters (μm) | MD±SD (μm) | Range of droplet diameters (μm) | MD±SD (μm) | Range of droplet diameters (μm) | MD±SD (μm) | Range of droplet diameters (μm) |
| WiO | ||||||||||||
| 20 | 110±33.9 | 32–155 | 1685±458 | 48–2220 | 1742±475 | 54–2530 | 1843±466 | 56–2233 | 1950±485 | 61–2522 | 108±51 | 34–159 |
| 50 | 108±35.3 | 30–153 | 1673±532 | 46–2214 | 1732±456 | 49–2528 | 1820±473 | 53–2232 | 1948±503 | 55–2515 | 100±52 | 31–155 |
| 100 | 94±35.9 | 27–150 | 1654±486 | 42–2209 | 1703±482 | 45–2511 | 1789±469 | 47–2216 | 1923±493 | 49–2504 | 93±48 | 29–153 |
| CiO | ||||||||||||
| 20 | 120±29.7 | 56–175 | 1757±468 | 69–2418 | 1782±464 | 71–2555 | 1866±451 | 73–2556 | 1996±494 | 79–2718 | 125±49 | 57–176 |
| 50 | 115±31.7 | 53–173 | 1744±452 | 64–2412 | 1779±459 | 69–2552 | 1844±438 | 71–2554 | 1994±483 | 73–2711 | 122±45 | 50–171 |
| 100 | 102±33 | 50–170 | 1739±434 | 58–2408 | 1774±432 | 62–2548 | 1837±425 | 63–2550 | 1963±455 | 65–2702 | 118±56 | 49–168 |
WiO: water-in-oil emulsion; CiO: chemotherapeutic-in-oil emulsion; MD: mean diameter; SD: standard deviation; T1: time 1, immediately after preparation; T2: time 2, 5min after preparation; T3: time 3, 10min after preparation; T4: time 4, 15min after preparation; T5: time 5, 20min after preparation; TR: time of re-mix.
Comparison of droplets diameter in water-in-oil and chemotherapeutic-in-oil emulsions after different pumping exchanges and at different times after preparation for the leading operator (XX).
| N° of pushing exchanges | T1mean (SD) | T2mean (SD) | P | T3mean (SD) | P(T1 vs T3) | P(T2 vs T3) | T4mean (SD) | P(T1 vs T4) | P(T2 vs T4) | P(T3 vs T4) | T5mean (SD) | P(T1 vs T5) | P(T2 vs T5) | P(T3 vs T5) | P(T4 vs T5) |
|---|---|---|---|---|---|---|---|---|---|---|---|---|---|---|---|
| WIO | |||||||||||||||
| 20 | 110 (33.9) | 1685 (458) | <0.001 | 1742 (475) | <0.001 | 0.788 | 1843(466) | <0.001 | 0.454 | 0.637 | 1950 (485) | <0.001 | 0.225 | 0.354 | 0.621 |
| 50 | 108 (35.3) | 1673 (532) | <0.001 | 1732 (456) | <0.001 | 0.793 | 1820 (473) | <0.001 | 0.522 | 0.677 | 1948 (503) | <0.001 | 0.250 | 0.328 | 0.565 |
| 100 | 94 (35.9) | 1654 (486) | <0.001 | 1703 (482) | <0.001 | 0.824 | 1789 (469) | <0.001 | 0.535 | 0.691 | 1923 (493) | <0.001 | 0.235 | 0.326 | 0.541 |
| CiO | |||||||||||||||
| 20 | 120 (29.7) | 1757 (468) | <0.001 | 1782 (464) | <0.001 | 0.906 | 1866 (451) | <0.001 | 0.602 | 0.686 | 1996 (494) | <0.001 | 0.281 | 0.331 | 0.547 |
| 50 | 115 (31.7) | 1744 (452) | <0.001 | 1779 (459) | <0.001 | 0.866 | 1844 (438) | <0.001 | 0.622 | 0.750 | 1994 (483) | <0.001 | 0.248 | 0.444 | 0.774 |
| 100 | 102 (33) | 1739 (434) | <0.001 | 1774 (432) | <0.001 | 0.859 | 1837 (425) | <0.001 | 0.616 | 0.746 | 1963 (455) | <0.001 | 0.275 | 0.353 | 0.530 |
N°: number; WiO: water-in-oil emulsion; CiO: chemotherapeutic-in-oil emulsion; SD: standard deviation; T1: time 1, immediately after preparation; T2: time 2, 5min after preparation; T3: time 3, 10min after preparation; T4: time 4, 15min after preparation; T5: time 5, 20min after preparation.
 and larger droplets 5min after preparation (time 2) (B).")
Characteristics of droplets in water-in-oil and chemotherapeutic-in-oil emulsions after different pumping exchanges at T1 after two different preparations performed by the same Operator (XX).
| Number of pushing exchanges | Operator 1 T1mean (SD) | Operator 1 T1 bismean (SD) | P |
|---|---|---|---|
| WiO | |||
| 20 | 110 (33.9) | 107 (35.4) | 0.910 |
| 50 | 108 (35.3) | 106 (37.3) | 0.970 |
| 100 | 94 (35.9) | 94 (35.9) | 1 |
| P (kruswal wallis test) | 0.436 | 0.423 | |
| CiO | |||
| 20 | 120 (29.7) | 116 (35) | 0.850 |
| 50 | 115 (31.7) | 115 (30.5) | 0.940 |
| 100 | 102 (33) | 108 (28.8) | 0.710 |
| P (kruswal wallis test) | 0.178 | 0.468 |
WiO: water-in-oil emulsion; CiO: chemotherapeutic-in-oil emulsion; SD: standard deviation; T1: time 1, immediately after preparation.
Characteristics of droplets in water-in-oil and chemotherapeutic-in-oil emulsions after different pumping exchanges, immediately after preparation by each operator.
| Number of pushing exchanges | Operator 1 T1mean (SD) | Operator 2 T1mean (SD) | P |
|---|---|---|---|
| WiO | |||
| 20 | 110 (33.9) | 113 (33.5) | 0.791 |
| 50 | 108 (35.3) | 109 (34.4) | 0.910 |
| 100 | 94 (35.9) | 99 (32.1) | 0.596 |
| CiO | |||
| 20 | 120 (29.7) | 117 (31.1) | 0.821 |
| 50 | 115 (31.7) | 112.2 (36.1) | 1 |
| 100 | 102 (33) | 100 (35.2) | 0.734 |
WiO: water-in-oil emulsion; CiO: chemotherapeutic-in-oil emulsion; SD: standard deviation; T1: time 1, immediately after preparation.
The droplet margins of all CiO preparations appeared homogenously round regardless of their size. The mean droplet diameters (± SD) and the droplet diameter ranges for each CiO preparation (after 20, 50, and 100 pumping exchanges) at the different times (1, 2, 3, 4, 5, and TR) are presented in Table 1. The mean droplet diameter increased significantly over time (time 1 until 5). The most significant aggregation occurred as early as 5min after preparation (120μm at time 1 vs. 1757μm at time 2; P<0.001) (Table 2). Conversely, mean droplet diameter did not increase significantly from time 2 until 5 (P>0.05). Upon re-mixing of preparations after 20min, droplet diameter returned to a value comparable to that at time 1. The mean droplet diameter decreased with increase in the number of pumping exchanges, although not significantly (P=0.178) (Table 3). There were no significant differences in intra-operator (Table 3) and in inter-operator variabilities (Table 4).
4DiscussionSince the first suggestions regarding the preparation of cTACE emulsions, which dates back to the early 1980–90s, it has been accepted that 20 pumping exchanges of the lipiodol and drug mixture produce large droplets (diameter range, 30–160μm). However, to the best of authors’ knowledge, no study has investigated changes in droplet parameters with increasing number of mixes. The present study demonstrated that there were no significant changes in mean diameter of droplets produced by 20, 50, or 100 pumping exchanges. Interestingly, the droplet mean diameter and the diameter range of droplets produced with these three different number of pumping exchanges remained unaltered for both WiO and CiO preparations. The diameter range of droplets are comparable to that reported by de Baere et al. [24]. Moreover, our results of mean droplet diameter and standard deviations, which were not previously reported in literature, suggest that the obtained droplet diameter is not too small to facilitate extrahepatic chemoembolization via the possible presence of extrahepatic shunts. Conversely, through quantitative analysis, this study demonstrated for the first time that 20 pumping exchanges of lipiodol and drug are sufficient to produce small drops that can reach tumors distally; therefore, these data are crucial for cTACE standardization. Moreover, these results have other implications. First, the data demonstrate that it is not possible to manually produce very small droplets. It is necessary to use blenders for obtaining very small droplets (10–40μm), such as that in another study [24]. Second, the droplet size range in this study was wide, consistent with that in other studies [23,24], and did not vary with increase in the number of pumping exchanges. To homogenize the droplet size, it is necessary to use modified stopcocks with porous filters that produce particles with even more homogenous diameters, specifically 50 and 100μm, which cannot easily be done manually [29].
The study demonstrated that there were no significant differences in intra- and inter-operator variabilities in droplet diameters of WiO and CiO emulsions. These results, which have not been previously demonstrated, are very important for use in a potential standardization protocol. In fact, these data show that the preparation process does not depend on the time of preparation (intra-operator variability) and degree of expertise of the operator (inter-operator variability).
Conventionally, it is believed that the mixture of lipiodol and drug must be prepared at the time of administration and promptly used after preparation [24]. Additionally, it has previously been proposed that mixtures should be re-homogenized, if necessary, during the same treatment session [26]. Neither of these two recommendations was based on quantitative analyss. Our data demonstrate for the first time that over time, the droplets in WiO and CiO emulsions tend to aggregate equally, ultimately increasing the droplet diameter. Interestingly, the maximum increase in droplet diameter was achieved as early as 5min after preparation regardless of the number of pumping exchanges. Specifically, droplet diameter increased by more than 10 times after 5min (>1500μm) and then more slowly up to 20min independent of the number of pumping exchanges and type of preparation (WiO or CiO). These aggregated droplets appear to be too large to be effective because they can occlude vessels proximally. Moreover, upon re-mixing the emulsions after just 20min, the droplet diameter returned to the initial values, which allowed them to be used effectively again. These data should be considered in any potential standardization of the emulsion process in clinical practice. In fact, in recent years, superselective catheterization has been shown to be associated with favorable outcomes of patients treated for HCC [30]. However, superselective catheterization needs time, and these data demonstrated that it is necessary to mix the emulsion immediately before the next injection, with no time limits.
In the near future, the use of different surveillance programs for patients with a high risk of developing HCC and a wide diffusion of magnetic resonance imaging performed using hepatospecific contrast media will probably allow HCC diagnosis in many patients and identification of some aggressive features [31–33]. Furthermore, advances in imaging techniques have enabled identification of aspects such as microvascular invasion [34]. Finally, cTACE represents one of the most used treatments for patients with HCC and may be the most effective therapeutic option for recurrent HCC in patients with microvascular invasion [10,35]. Therefore, it would be very useful to standardize the technique. Moreover, it is well known that the treatment choice is an independent prognostic factor in BCLC-B patients and curative options (that actually do not represent the standard of care for BCLC-B patients) offer a better patients’ outcome. Therefore, TACE (retained the standard of care for BCLC-B patients) could probably be replaced by other curative therapies, especially in patients with poor liver function [36]. Probably, this process is also due to the absence of a standardization of cTACE procedure. Results of the present study can be used to develop a protocol for cTACE standardization.
The standardization of TACE procedure allows to achieve another important advantage. It is well known that the doses delivered in the interventional radiological procedures are much higher than those in diagnostic imaging: therefore, efforts for dose optimization nowadays should be made mainly for interventional radiological procedures [37]. The standardization of TACE procedure allows to go through this direction. In fact, the emulsion if not re-mixed every five minutes could produce an increase of the angiographic time for example due to a blockage of microcatheters since the droplets tend to agglomerate.
An important limitation of this study is that only one chemotherapeutic agent, epirubicin, was tested in this analysis. However, epirubicin is the most commonly used agent in cTACE worldwide [38]; thus, these results can be used to standardize cTACE using this drug at the least.
5ConclusionThis study demonstrated that 20 pumping exchanges are sufficient to prepare WiO or CiO emulsions for cTACE. Re-mixing of the emulsion is needed every 5min to avoid aggregation into larger droplets in cases of highly lengthy infusions (i.e., large tumors) or multiple superselective catheterizations. Any interventional radiologist may prepare these emulsions regardless of their experience. These study results may represent a set of instructions for cTACE standardization.AbbreviationsHCChepatocellular carcinomaTACEtrans-arterial chemoembolizationcTACEconventional trans-arterial chemoembolizationDEB-TACEdrug-eluting bead trans-arterial chemoembolizationWiOwater-in-oilCiOchemotherapeutic-in-oilSDstandard deviationTRtime of re-mix
AbbreviationsHCChepatocellular carcinomaTACEtrans-arterial chemoembolizationcTACEconventional trans-arterial chemoembolizationDEB-TACEdrug-eluting bead trans-arterial chemoembolizationWiOwater-in-oilCiOchemotherapeutic-in-oilSDstandard deviationTRtime of re-mix
AbbreviationsHCC hepatocellular carcinoma trans-arterial chemoembolization conventional trans-arterial chemoembolization drug-eluting bead trans-arterial chemoembolization water-in-oil chemotherapeutic-in-oil standard deviation time of re-mix
None.


