


Hepatic encephalopathy (HE) is a frequent complication of cirrhosis and may cause cerebral damage. Neurodegenerative diseases can induce the release of neuroproteins like neurofilament light chain (NfL) and glial fibrillary acidic protein (GFAP) in body fluids, including blood plasma. We investigated whether NfL and GFAP could serve as potential diagnostic plasma biomarkers for overt HE (oHE).
Materials and MethodsWe included 85 patients from three prospective cohorts with different stages of liver disease and HE severity. The following patients were included: 1) 34 patients with primary sclerosing cholangitis (PSC) with compensated disease; 2) 17 patients with advanced liver disease without oHE before elective transjugular intrahepatic portosystemic shunt (TIPS) placement; 3) 17 intensive care unit (ICU) patients with oHE and 17 ICU patients without cirrhosis or oHE. Plasma NfL and GFAP were measured using single molecule assays.
ResultsICU oHE patients had higher NfL concentrations compared to pre-TIPS patients or ICU controls (p < 0.05, each). Median GFAP concentrations were equal in the ICU oHE and pre-TIPS patients or ICU controls. Plasma NfL and GFAP concentrations correlated with Model for End-Stage Liver Disease (MELD) scores (R = 0.58 and R = 0.40, p < 0.001, each).
ConclusionsPlasma NfL deserves further evaluation as potential diagnostic biomarker for oHE and correlates with the MELD score.
Hepatic encephalopathy (HE) is a brain dysfunction caused by liver insufficiency and/or portosystemic shunting [1]. Manifestations of HE range from minimal/covert HE (mHE) characterized by subclinical alterations to overt HE (oHE) with symptoms that require intervention and can include coma [1]. During the course of their disease, mHe occurs in 30–70% of patients with cirrhosis [2]. Ammonia concentrations have prognostic value in HE [2]. Hyperammonemia and systemic inflammation are key factors in the multifactorial pathogenesis of HE [3]. Ammonia concentrations in blood are relevant in diagnosing HE and estimating severity at presentation but do not relate to treatment intensity [4,5]. Low ammonia concentrations make the diagnosis of oHE far less likely. High ammonia concentrations can have various reasons, which is partly caused by the (pre)analytical variation which is prone to errors. Therefore, there is a need for more robust diagnostic biomarkers for HE.
Previously, it was assumed that HE was completely reversible, but there is increasing evidence that an episode of HE may cause cerebral damage [6–8]. Patients experience persistent cognitive impairment after resolution of an episode of oHE [7]. This can be explained by neuronal damage caused by hyperammonemia and its effects on the brain. Astrocytes attempt to detoxify free ammonia by binding it to glutamate with the formation of glutamine. Due to its osmotic capacity, glutamine causes swelling and dysfunction of the astrocytes in the brain [3]. In addition, mitochondria in astrocytes capture the excess of glutamine, creating free oxygen radicals, which in turn cause mitochondrial damage [9,10]. Since blood ammonia concentrations do not always correctly reflect the severity of HE, biomarkers reflecting the degeneration of astrocytes could be useful to make the diagnosis of HE more likely.
Neuroproteins, such as neurofilament light chain (NfL) and glial fibrillary acidic protein (GFAP), could be such biomarkers as both are released upon neuronal damage. NfL is found in high concentrations exclusively in neurons [11]. GFAP is expressed in astrocytes and contributes, amongst others, to the maintenance of the blood-brain barrier [12]. As a result of neurodegeneration, inflammation and other pathological processes in the brain, NfL and GFAP are released and elevated concentrations can be measured in both the cerebral spinal fluid (CSF) and plasma [13].
Increased NfL plasma concentrations have been found in patients with cirrhosis, as well as in patients with minimal HE and a history of oHE [14,15]. Two recently published studies regarding GFAP plasma concentrations in patients with cirrhosis report contradicting results. One study showed no alterations in plasma GFAP concentrations, while another study showed increased concentrations and an association with the presence of covert HE and blood ammonia concentrations [14,16]. Moreover, plasma neuroprotein concentrations can increase in critically ill patients over time during hospitalization [17].
NfL and GFAP have not yet been studied in patients with liver disease and a current episode of oHE. Whether increased NfL and GFAP concentrations reflect the severity of liver disease, the severity of oHE, or a combination of both remains unknown. There is a possible direct relation between neuronal and astrocyte damage in a current episode of oHE. Therefore, we hypothesized that NfL and GFAP are elevated in the plasma of patients with liver cirrhosis with a current episode of oHE and might serve as potential diagnostic biomarkers for oHE independent of liver disease severity.
2Materials and methodsA total of 85 samples of patients from three prospective cohorts were analyzed. Groups within these cohorts were matched using propensity score matching based on age and sex using the nearest neighbor matching option within the MatchIt R package [18].
The first cohort comprises 34 patients with primary sclerosing cholangitis (PSC) from the Dutch PSC Biobank. The Dutch PSC Biobank is a prospective biobank in which annual serum, plasma, whole blood, urine and feces are collected and stored at -80 degrees Celsius. All patients visiting the outpatient clinic of the Amsterdam UMC and fulfilling the PSC criteria as described by the European Association for the Study of the Liver (EASL) guidelines were invited to participate [19]. Patients with cirrhosis and available EDTA plasma samples were selected from this cohort (n = 17). Cirrhosis was defined as liver stiffness measurement with transient elastography (Fibroscan) of ≥ 15 kPa or a usual combination of radiological and biochemical criteria. Those patients were matched to 17 PSC patients without cirrhosis and available samples. These latter patients served as a negative disease control group. All patients included in the analyses were checked for the absence of oHE in their medical history.
The second cohort included patients from an ongoing prospective randomized controlled trial (Prevention of hepatic encephalopathy by administration of rifaximin and lactulose in patients with liver cirrhosis undergoing placement of a transjugular intrahepatic portosystemic shunt (TIPS): a multicentre randomised, double blind, placebo controlled trial, the PEARL trial) [20]. All patients had cirrhosis. From the currently available plasma EDTA samples (stored at -80 degrees Celsius), a total of 8 patients with no signs of HE before and three months after TIPS placement were matched to 9 patients with signs of new onset HE within three months after TIPS placement. None of these pre-TIPS patients had signs of oHE at the moment of blood sampling.
The third cohort consisted of 17 patients who were admitted to the intensive care unit (ICU) with grade 3/4 HE without signs of sepsis or an underlying neurological disease. These patients were included in a well-defined prospective observational ICU cohort (molecular diagnosis and risk stratification of sepsis -MARS- cohort) as described previously [21]. Another 17 patients from the MARS-cohort who were admitted to the ICU after scheduled cardiothoracic surgery, without cirrhosis, were matched and served as a control [21]. Plasma EDTA samples from the day of ICU admission were selected, or (if not available) the first available sample within 72 hours after ICU admission. In case multiple laboratory results (creatinine, bilirubin, albumin) were available on the day of sample withdrawal were available, the mean value was used.
From all patients, EDTA plasma was analyzed using a Single molecule assay (Simoa) to quantify concentrations of NfL and GFAP, as previously described [22]. For NfL analysis, the Simoa NF-light Advantage Kit was used, and for GFAP, the Simoa GFAP Discovery Kit was used. Both were purchased from Quanterix, Billerica, Massachusetts, USA; product numbers 103186 and 102336, respectively.
2.1Statistical analysisBaseline characteristics were summarized using descriptive statistics. Continuous variables were reported based on their distribution by mean with SD or median with interquartile range. Continuous variables with a normal distribution were compared using an unpaired t-test or one-way ANOVA in the case of multiple groups. Continuous variables with a non-normal distribution were compared using a Mann-Whitney U-test or Kruskal-Wallis test in the case of multiple groups. Chi-squared test or Fisher's exact test was used to compare categorical data, when appropriate. Spearman's rank correlation coefficient was calculated for correlation analyses. A significance level of 0.05 was used for all statistical tests. Statistical analyses were performed in R (version 4.0.2).
2.2Ethical statementThe study protocol was reviewed by the Medical Ethics Review Committee of Amsterdam University Medical Centers, location AMC (ref. W22_187 # 22.235) and it was concluded that this study is not subject to the Dutch Medical Research Involving Human Subjects Act (WMO). All patients from the Dutch PSC Biobank and PEARL trial signed informed consent, while patients from the MARS- cohort were included using an opt-out method. The Amsterdam UMC Biobank Assessment Committee approved the use of samples (ref. 2022.0658). This study was executed in line with the principles of the Declaration of Helsinki and current regulations.
2.3Data availabilityThe data supporting this study's findings are not publicly available but are available from the corresponding author on reasonable request.
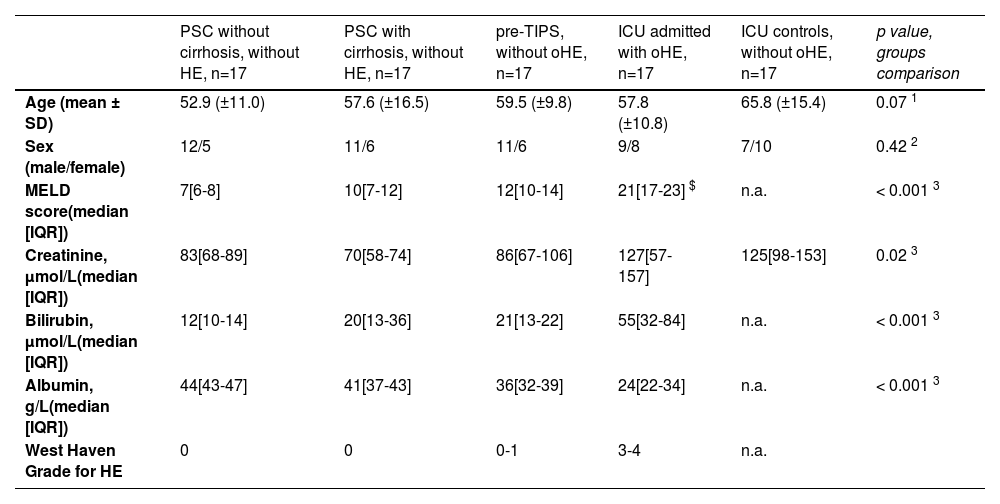
3ResultsThe mean age of all included patients was 58.9 years ± 13.4 (Table 1). No differences in age or sex were found between the groups. Male to female ratio was typical for PSC and pre-TIPS patients, at approximately 2:1. Calculated Model for End-Stage Liver Disease (MELD) scores of available samples were increased in pre-TIPS patients and ICU patients with oHE compared to those with PSC (p < 0.001). Alcohol as an etiology of chronic liver disease was 53 % in the pre-TIPS group and 47 % in the ICU oHE group.
Baseline characteristics of included patients with liver diseases.
| PSC without cirrhosis, without HE, n=17 | PSC with cirrhosis, without HE, n=17 | pre-TIPS, without oHE, n=17 | ICU admitted with oHE, n=17 | ICU controls, without oHE, n=17 | p value, groups comparison | |
|---|---|---|---|---|---|---|
| Age (mean ± SD) | 52.9 (±11.0) | 57.6 (±16.5) | 59.5 (±9.8) | 57.8 (±10.8) | 65.8 (±15.4) | 0.07 1 |
| Sex (male/female) | 12/5 | 11/6 | 11/6 | 9/8 | 7/10 | 0.42 2 |
| MELD score(median [IQR]) | 7[6-8] | 10[7-12] | 12[10-14] | 21[17-23] $ | n.a. | < 0.001 3 |
| Creatinine, µmol/L(median [IQR]) | 83[68-89] | 70[58-74] | 86[67-106] | 127[57-157] | 125[98-153] | 0.02 3 |
| Bilirubin, µmol/L(median [IQR]) | 12[10-14] | 20[13-36] | 21[13-22] | 55[32-84] | n.a. | < 0.001 3 |
| Albumin, g/L(median [IQR]) | 44[43-47] | 41[37-43] | 36[32-39] | 24[22-34] | n.a. | < 0.001 3 |
| West Haven Grade for HE | 0 | 0 | 0-1 | 3-4 | n.a. |
A difference in NfL concentrations was observed across all groups (one-way ANOVA, p < 0.001). The highest median NfL concentrations were found in the ICU patients with oHE (38.6 pg/mL [30.1–57.0]) (Fig. 1a). In ICU patients with oHE and pre-TIPS patients without oHE (29.3 pg/mL [16.6–35.8]), NfL concentrations were higher when compared to NfL concentrations in PSC patients with cirrhosis (6.3 pg/mL [4.9–12.1], both p < 0.001). ICU patients with oHE also had increased NfL concentrations compared to pre-TIPS patients (29.3 pg/mL [16.6–35.8], p = 0.03). ICU patients without oHE had lower NfL concentrations (19.33 pg/mL [18.7–34.8]) compared to ICU patients with oHE (p = 0.01). NfL concentrations in ICU patients without oHE were comparable to pre-TIPS patients and higher than in PSC patients with cirrhosis (p < 0.001). Within the PSC group, NfL concentrations were equal in patients with or without cirrhosis (7.8 pg/mL [5.8–8.4] vs 6.3 pg/mL [4.9-12.1], p = 0.68).
. Plasma concentrations of NfL (a) and GFAP (b) in the different groups. Compared using Mann-Whitney U-tests.")
Median GFAP concentrations were increased in ICU patients with oHE (138.7 pg/mL [100.9-178.2]) when compared to PSC patients with cirrhosis (77.0 pg/mL [65.6-97.0], p < 0.01). Patients in the ICU without oHE also had increased GFAP concentrations (132.5 pg/mL [98.9-208.9]) when compared to PSC patients with cirrhosis (p = 0.01). Notably, there was no difference in GFAP concentrations between pre-TIPS patients (125.8 pg/mL [88.5-166.8]) and PSC patients with cirrhosis (p = 0.053), ICU patients with oHE and pre-TIPS patients without oHE (p = 0.52) and between ICU patients irrespective of the presence of oHE (p = 0.87) (Fig. 1b).
When analyzing a potential relation of the biomarkers with disease severity measures, only patients with liver disease were included: the PSC patients, pre-TIPS patients and ICU patients with oHE. There was a moderate correlation between NfL concentrations and MELD scores in the total group (R = 0.58, p < 0.001) and a moderate correlation between GFAP concentrations and MELD scores (R = 0.40, p = 0.001) (Fig. 2). NfL and GFAP concentrations correlated with age (R = 0.43 (p < 0.001) and R = 0.38 (p = 0.001), respectively) (Supplementary Fig. 1).
 correlation with the MELD score in patients with liver disease. Correlation of NfL (a) and GFAP (b) with MELD score using Spearman")
NfL and GFAP concentrations (pg/mL) correlation with the MELD score in patients with liver disease.
Correlation of NfL (a) and GFAP (b) with MELD score using Spearman's rank correlation coefficient analyses. Fig. 2a shows a moderate correlation of NfL with the MELD score (R=0.58, p < 0.001). Fig. 2b shows a moderate correlation of GFAP with the MELD score (R=0.40, p = 0.001).
R = Spearman's rho value.
NfL concentrations in patients with PSC were similar to established age-adjusted reference values [23]. In patients with more advanced disease that required TIPS placement or admission to the ICU with an episode of oHE, the values exceeded any available reference value [23].
4DiscussionThere is a need for a biomarker that is more stable and easier to measure for HE than ammonia. Measurement of blood ammonia concentrations has several limitations, and biomarkers reflecting neural degeneration, such as neuroproteins, may be better for the diagnosis of HE.
In this study, neuroproteins NfL and GFAP were studied using single molecule assay on plasma from patients with various stages of chronic liver disease and with or without the presence of oHE. We found that NfL concentrations are higher when more advanced cirrhosis is present. NfL concentrations were highest in patients admitted to the ICU for oHE. Noteworthy, GFAP concentrations in ICU patients were comparable to concentrations in patients with different stages of liver disease and ICU controls. Furthermore, we found a moderate correlation between NfL concentrations and MELD scores.
NfL and GFAP were studied in patients with covert HE before [15]. NfL concentrations were increased in patients with cirrhosis and a history of oHE. This increase was similar in patients with current covert HE without a history of oHE and may illustrate the ongoing cerebral damage in patients with a history of oHE. GFAP concentrations were increased in patients with covert HE in the study of Gairing et al[16]. A moderate correlation was found with ammonia concentrations, which we could not establish in our limited cohort of pre-TIPS patients (data not shown). GFAP concentrations were increased in patients with HE grade 2, but this increase was comparable with patients with covert HE [16].
In our study, NfL concentrations were increased in ICU patients with oHE compared to ICU controls, pre-TIPS patients without oHE and PSC patients without oHE. Increased concentrations of NfL in pre-TIPS patients can be explained by (previous episodes of) covert HE. Covert HE is often seen in patients with more severe liver disease (as is the case in TIPS patients) and is not always clearly visible to the physician (therefore called covert). Recurrent oHE is a contraindication for TIPS placement in the trial from which the samples were used. We did not find a difference in concentrations of NfL or GFAP in patients with chronic liver disease (PSC), both with or without cirrhosis. This can be explained by the fact that none of these patients had a documented previous episode of oHE and that the included PSC patients had less advanced disease. GFAP concentrations were equally increased in patients pre-TIPS without oHE, ICU patients with oHE, and ICU controls. This makes GFAP not suitable as biomarker for oHE.
We observed a correlation with both measured neuroproteins and the MELD score. The correlation was stronger for NfL and reflects the stepwise increase of NfL in patients ranging from compensated to decompensated cirrhosis, irrespective of the presence of oHE. A weak correlation (R = 0.25) with GFAP concentrations and the MELD score was found before [16]. We found a moderate correlation (R = 0.4) with GFAP concentrations and the MELD score. Clinicians should be aware that patients with deteriorating MELD scores are at risk for cerebral damage due to toxicity as a result of decreased liver function. Early cognitive testing and treatment of HE might prevent further cerebral damage.
We also observed a correlation with both neuroproteins and age. However, this correlation has already been studied [24,25], and on itself was not explanatory for the differences observed in this study since we corrected for age on baseline characteristics. Multiple factors, such as decreased renal or liver function and especially cirrhosis itself, affect neuroprotein concentrations [14]. The extent to which these functions affect neuroprotein concentrations is still unknown. There seems to be an association with increased creatinine levels and NfL levels, but not with GFAP. [14] It is possible that decreased renal excretion plays a role. In addition, albumin concentrations seem to influence both neuroprotein concentrations. However, in our cohort, both groups who were admitted to the ICU had comparable increased creatinine levels and yet the group with oHE had higher NfL concentrations. Therefore, we believe that NfL could still be a potential biomarker for oHE.
Previously, a proof of principle study showed that oHE increased NfL concentrations (adjusted for age), indicating irreversible neuronal and axonal damage after an episode of oHE [15]. Established age-adjusted reference values [23] do not apply to patients with advanced liver disease without oHE and to patients with oHE at the ICU. For patients with liver disease, these age-adjusted reference values should still be established.
In relation to the prediction of post-TIPS HE, we found comparable NfL and GFAP concentrations in patients who did develop oHE after TIPS placement and those who did not. Thus, baseline NfL or GFAP concentrations might have a limited predictive value to predict post-TIPS HE. Other factors like compliance to lactulose and/or rifaximin might be of bigger influence on post-TIPS HE. In particular, increased NfL and GFAP concentrations in patients with advanced liver disease, such as in pre-TIPS patients, may indicate brain damage due to previously acquired covert HE or due to a fragile brain as a result of co-morbidity (e.g., alcohol).
Our study has strengths and limitations. Strengths of our study include the well-described prospective cohorts and matching for age and sex pre-analysis to overcome possible confounding of those two factors. The study is limited by the relatively small sample size in each group, and therefore, the interpretation of the results should be validated in a larger (prospective) cohort study. Whenever possible, patients should also be matched on renal- and liver function. Moreover, measurements should be performed longitudinally to observe the treatment effects on the disease course in relation to NfL concentrations over time. While ammonia measurements have their limitations and technical challenges, NfL is stable and not subject to (pre-)analytical variation. Unfortunately, a direct comparison of ammonia with GFAP or NfL in our cohort was not possible due to the limitations of ammonia measurements in stored samples.
5ConclusionsPlasma levels of NfL are associated with the presence of oHE, whereas plasma levels of GFAP appear not to be, based on our study results. NfL concentrations in patients with advanced liver disease are higher compared to patients with early disease (and without cirrhosis). Furthermore, NfL concentrations in patients with oHE admitted to the ICU increased more than in patients without oHE. Although further studies are needed, NfL may have the potential to become a useful biomarker for diagnosis and follow-up of (o)HE.


