


Edited by: Sonia Roman
Last update: January 2023
More infoPNPLA3 (rs738409) and TM6SF2 (rs58542926) variants, interindividual and ethnic differences may be risk factors for non-alcoholic fatty liver disease (NAFLD). The PNPLA3 G allele is associated with worse NAFLD evolution in Hispanics and Caucasians. TM6SF2 is associated with hypertriglyceridemia, NAFLD, and cardiovascular disease. We aimed to evaluate the association between genetic ancestry by Ancestry Informative Markers (AIM), PNPLA3 and TM6SF2 polymorphisms in patients with biopsy-proven NAFLD in an admixed population.
MethodsWe included adults with biopsy-proven NAFLD and excluded patients with the presence of other chronic liver disease, alcohol intake >100g/week, HIV, drug-induced fatty liver disease, or liver transplantation. We classified NAFLD using the Non-Alcoholic Steatohepatitis Clinical Research Network (NASH-CRN) histological scoring system. The PNPLA3 (rs738409 c.444C>G) and TM6SF2 (rs58542926 c.449C>T) genotyping were performed by RT-PCR. Genetic ancestry was determined using 46 insertion-deletion AIM; α<0.05 was considered significant.
ResultsA total of 248 patients with NAFLD were enrolled [34 with simple steatosis (NAFL); 214 with NASH]. Overall, we detected a greater European ancestry contribution (0.645), followed by African (0.173), Amerindian (0.095), and East Asian (0.087) ancestry contribution, without differences between NAFL and NASH patients. However, we found a higher African genetic ancestry contribution among patients with NAFL who had the PNPLA3 C/C genotype than those with the G allele (0.216 ± 0.205 versus 0.105 ± 0.101, respectively; p=0.047). Ancestry contributions did not differ among TM6SF2 genotypes.
ConclusionAmong NAFL patients, greater African genetic ancestry was associated to a lower frequency of the PNPLA3 G allele, demonstrating a possible NASH ancestry-related protective factor.
Non-alcoholic fatty liver disease (NAFLD) is prevalent worldwide and is a common indication for liver transplantation [1]. Due to the global obesity, type 2 diabetes (T2DM), and other metabolic syndrome components epidemic, it is expected that NAFLD will increase in frequency [2,3]. Patients with simple hepatic steatosis who progress to non-alcoholic steatohepatitis (NASH) appear to have increased cirrhosis, liver failure, and hepatocellular carcinoma (HCC) associated mortality [2,3]. Approximately 40% of patients with simple steatosis (NAFL) evolve to NASH, characterized by liver inflammation and hepatocellular injury, with or without fibrosis [2,3]. In addition to lifestyle changes, therapies aiming at reducing inflammation and fibrosis have been under evaluation over many years. Nonetheless, there still are no definite protocols with a significant impact on the infirmity evolution [4].
Studies that evaluate the genetic variants of NAFLD patients may help understand better the multifactorial pathogenesis of the disease. They may provide information on the interaction between genetic and environmental risk factors, opening the possibility of genetic-specific targets therapy. Patatin-like phospholipase domain-containing protein 3 (PNPLA3) acts as a lipase activity of lipid droplets suppressor, competing for a shared coactivator [3,5,6]. The I148M mutation is a loss of function allele and accumulation of this nonfunctional protein amplifies the failure of lipolysis resulting in greater accumulation of triglycerides and other lipotoxic lipids. Therefore, reducing PNPLA3 expression levels may attenuate its negative effect on hepatic lipolysis. Thus, individuals with a genetic variant that reduces PNPLA3 expression levels are less susceptible to the I148M effect on liver fat when compared to those without the reducing variant [3,5,7]. It is interesting to hypothesize the possibility of an etiological distinction between PNPLA3 I148M - NASH and other forms primarily driven by insulin resistance (IR). Another NASH-associated gene, transmembrane 6 superfamily member 2 (TM6SF2) (rs58542926 c.449C>T), has been associated with progression to fibrosis and HCC. More studies are needed to demonstrate the potential role of these polymorphisms in therapy, as well as prognostic factors [6, 8–11].
The epidemiology of NAFLD is characterized better in Caucasians. Several North American studies have evaluated the NAFLD ethnic variation and found an uneven distribution of the disease, with higher prevalence among Latinos and lower among African Americans[12]. The reasons for these differences remain unclear, and the known epigenetic, environmental, and metabolic variables associated with NAFLD so far are not sufficient to justify this variation. Therefore, further investigations of NAFLD in different ethnic groups may help understand its pathogenesis [12].
The frequency of PNPLA3 I148M appears to be higher in the Hispanic population and reduced in Europeans and African Americans [13–15]. In that analysis, there was no association between PNPLA3 genotypes and other NAFLD risk factors, such as obesity and IR [16–19]. However, in the last ten years, the association of the PNPLA3 I148M mutation with hepatic steatosis has been independently and robustly reproduced in several studies, including individuals from different ancestors and geographic regions. One study evaluated 127 obese youngsters (56 men and 71 women), 58 whites, 30 African Americans, and 39 Hispanics [20] . The results showed that liver fat and aminotransferase levels varied according to ethnicity and genotypes ofPNPLA3 (rs738409) polymorphism . Caucasians and African Americans with the PNPLA3 G/G variant had higher liver fat concentrations, while Hispanics with the same genotype had greater alanine aminotransferase (ALT) levels [20]. An association was also found between the PNPLA3 (rs738409) GG genotype and susceptibility to NAFLD in Han and Uighurs in northwestern China [21].
Sookoian et al. demonstrated a strong association between PNPLA3 I148M and NAFLD severity, as determined by histological evaluation of liver biopsies, regardless of body mass index (BMI), age, sex, and insulin sensitivity [22]. The PNPLA3 genetic variant appeared to be associated with the development of NASH, fibrosis, and cirrhosis in different populations and ancestors (Japanese, North American, Italian, Malay), as an independent risk factor in the pathogenesis of human NAFLD [22].
The Brazilian population has high genetic diversity due to miscegenation, mainly between Amerindians, blacks (Africans), and whites (Europeans). Considering the more than 500 years of genetic admixture, applying only skin color or self-denomination as methods of ethnic-racial classification does not cover all the nuances of this admixture [23]. In Brazil, throughout its territorial extension, there is an admixed population with different proportions, such as European, African, and Amerindian contributions, except for rare groups geographically isolated compound of quilombo´s remnants and communities of European descendants in the South region [23]. Unlike Europe, the United States, and even Africa, where there is an association between race and origin, the classification of different population groups in Brazil is more related to phenotypic morphological characters and socio-cultural aspects [24–26]. Analysis of ancestry informative genetic markers (AIM) revealed may provide more accurate estimates of the ethnic composition of hybrid populations such as the Brazilian. AIM is an indicator that presents an allelic frequency differential (δ) greater than 30% between any two geographically or ethnically defined populations. Studies have compared the frequencies of classical genetic markers such as protein, enzymatic or immunological polymorphisms of molecular variants (DNA) in geographically or ethnically defined populations. They showed that few loci present large frequency differentials (δ) and, therefore, may be considered specific alleles of a population [24,25].
We sought to investigate the influence of ancestry and its association with PNPLA3 or TM6SF2 gene variants in an admixed Brazilian population, using genetic markers that inform ancestry. To the best of our knowledge, no studies have investigated these ancestry variants in Brazil.
2Material and methods2.1Clinical design and patientsThis cross-sectional study evaluated 248 non-alcoholic fatty liver disease patients followed up at the Department of Gastroenterology from the University of Sao Paulo. All patients had the PNPLA3 (rs738409 c.444C>G) and TM6SF2 (rs58542926 c.449C>T) polymorphisms analyzed.
The inclusion criteria were Brazilian adults older than 18 years with biopsy-proven NAFLD. Exclusion criteria were as follows: the presence of any other chronic liver disease, alcohol intake >100 g/week, HIV, drug-induced fatty liver disease, and liver transplantation.
An expert pathologist evaluated the liver biopsies, who classified them according to Non-Alcoholic Steatohepatitis Clinical Research Network (NASH-CRN) [27,28] system for NAFLD, and divided patients into Non-Alcoholic Fatty Liver/Simple steatosis (NAFL) versus NASH [29]. This expert pathologist classified the histological fibrosis as follows: F0, no fibrosis; F1, portal fibrosis without septa; F2, portal fibrosis with few septa; F3, fibrosis/bridge septa between the central and portal veins; and F4, cirrhosis [28]. We considered significant liver fibrosis stage ≥F2 [3] and obtained demographic, anthropometric, and medical history data from medical records. We defined metabolic syndrome if three or more of the following criteria were present: fasting glucose ≥110 mg/dL, ≥130 mmHg, systolic or ≥85 mmHg diastolic blood pressure, triglycerides ≥150 mg/dL, high-density lipoproteins (HDL) <40 mg/dL in men and <50 mg/dL in women and abdominal obesity [30]. Reported laboratory tests were collected after a 12-hour overnight fast and evaluated at the time of liver biopsy. Patients had IR assessed using the Homeostatic Assessment Model (HOMA-IR) (22.5 × fasting insulin [mU/mL] × glucose [28].
2.2DNA isolation and genotypingGenomic DNA was isolated from 200 mL of blood by QIAamp DNA Blood Mini Kit (QIAGEN, Hilden, Germany). We genotyped PNPLA3 (rs738409 c.444C>G) and TM6SF2 (rs58542926 c.449C>T) using TaqMan primers and probes for allelic discrimination (7500 Fast Real-Time PCR system, Applied Biosystems, Thermo Fisher Brand, Foster City, CA, USA) per the manufacturer's recommendations. We also performed direct genotyping of random samples to validate the results and conducted quality control to check the reproducibility of the results. The staff who genotyped the samples were blind to the subject's clinical or biochemical data.
2.3Genetic ancestryThe ancestry of patients was determined using a panel of 46 ancestry informative markers (AIM), as previously reported at Molecular Oncology Research Center of Barretos Cancer Hospital .[31–33]. Briefly, following DNA extraction, and multiplex PCR with 46 primers, the amplified products were further subjected to capillary electrophoresis and fragment analysis on an ABI 3500 Genetic Analyzer (Applied Biosystems) according to the manufacturer's instructions. These 46 INDEL are used mainly to estimate ancestry proportions in admixed populations and assess the structure of those populations. These markers were selected because of their high allele frequency divergence between different ancestral or geographically distant populations, including more than 1,000 individuals from 40 reference populations of the Human Genome Diversity Project (HGDP) -Center d / Etude du Polymorphism (CEPH), in addition to individuals from Angola, Portugal, Taiwan and Brazilian indigenous peoples, which allowed the establishment of ancestral proportions in individuals and populations of high miscegenation, such as the Brazilian population [31].
Two observers independently examined the electropherograms, and the genotypes were automatically assigned with GeneMapper Software v4.1 (Applied Biosystems). The ancestry ratios were evaluated using the Structure Software v2.3.4 [33–35]. The data available for the HGDP-CEPH panel were used as reference for the ancestral populations, and a controlled analysis was performed to estimate individuals’ ancestry contribution. The Structure Software runs considering K = 4 consisted of 100,000 burning steps followed by 100,000 Markov Chain Monte Carlo iterations. The option “Use population information to test for migrants” was used with the admixture model, considering allele frequencies and updating the allelic frequencies using only individuals with POPFLAG = 1.
2.4StatisticsThe continuous variables were presented as number, percentage, and mean [standard deviation (SD)]. We analyzed the association between PNPLA3, TM62SF polymorphisms, and genetic ancestry contribution (African, Amerindian, European, East Asian) in NAFL and NASH patients, considering their clinical characteristics. The Chi-square test and the Fisher's exact test were used to compare categorical variables, and the Mann-Whitney and Kruskal-Wallis tests to evaluate numerical variables. Hardy-Weinberg equilibrium was assessed to evaluate genetic polymorphisms. Heterozygosity and polymorphic information content were also calculated in the studied groups. We utilized "The R Project for Statistical Computing Software for Windows, R version 4.0.5 (March 31, 2021)", and a two-tailed probability value <0.05 was considered significant.
2.5Ethical considerationsThe protocol was approved by the Research Ethics Committee of the Hospital de Clínicas of the Faculty of Medicine of the University of São Paulo (CAAE No. 1531382) and was in accordance with the Declaration of Helsinki. Written informed consent was obtained from all volunteers.
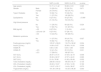
3ResultsWe included 248 patients with NAFLD, 34 with NAFL, and 214 with NASH with a mean age of 56 years (24-76 years). Females comprised the majority (n= 186, 75%). The prevalence of T2DM, MtS, BMI over 30kg/m2, higher serum insulin, aspartate aminotransferase (AST), and gamma-glutamyl transferase (GGT) levels, as well as higher HOMA-IR index, was greater in the NASH group compared to the NAFL subjects. These differences were statistically significant (Table 1).
Baseline characteristics of fatty liver disease patients from an admixed population
BMI, Body Mass Index; HOMA-IR, Homeostatic Assessment Model;
AST, aspartate aminotransferase; ALT, alanine aminotransferase
GGT, gamma glutamyl transferase; HDL cholesterol, High-density lipoprotein
LDL, Cholesterol, Low-density lipoprotein
Numeric variables are demonstrated as mean ± standard deviation
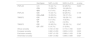
Overall, we observed a higher European ancestry contribution (0.645), followed by the African (0.173), Amerindian (0.095), and East Asian (0.087), confirming the admixed Brazilian population (Fig. 1). The genetic ancestry contributions were similar in the NAFL and NASH patients (Table 2). On the other hand, we found a higher African genetic ancestry contribution among patients with simple steatosis who had the C/C PNPLA3 genotype than those with the G allele (0.216 ± 0.205 versus 0.105 ± 0.101, respectively; p = 0.047). (Table 3). Among subjects with simple steatosis and European, East Asian, and Native American ancestries, the genotype frequencies of the G allele and C/C alleles were similar (Table 3).

Analysis of PNPLA3 and TM6SF2 genotypes and genetic ancestry by informative ancestry markers in patients with non-alcoholic fatty liver disease from an admixed population
NAFL, non-alcoholic fatty liver (simple steatosis)
NASH, non-alcoholic steatohepatitis
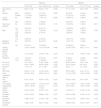
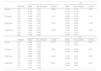
Genetic ancestry, clinical and laboratory variables according to the genotypes of the PNPLA3 and TM6SF2 variants in patients with simple steatosis
BMI, Body Mass Index; HOMA-IR, Homeostatic Assessment Model;AST, aspartate aminotransferase; ALT, alanine aminotransferase
GGT, gamma glutamyl transferase; HDL cholesterol, High-density lipoprotein
LDL, Cholesterol, Low-density lipoprotein
PNPLA3 (rs738409) polymorphism was in Hardy-Weinberg equilibrium, and heterozygosity was 0.6273. Allele*1 frequency found was 0.135.
In the NAFL group, the PNPLA3 C/C genotype frequency was 44.1%, while the G/C+G/G genotype, 55.9%. The C/C genotype frequency was 29% in the NASH group, while the G allele was present in 71% of the patients. This difference was not statistically significant (p=0.109, OR 1.935; CI95% 0.925-4.051) (Table 2). In this group (NAFL), the HDL-cholesterol levels were higher (54.21 versus 45.29, respectively; p=0.019) among PNPLA3 C/C patients compared with G/C and G/G subjects. On the other hand, the triglycerides levels were lower among PNPLA3 C/C patients (139.21 versus 216.12, respectively; p=0.016) (Table 3).
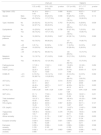
In the NASH group, the African genetic contribution was 0.175 among subjects with the G allele compared to 0.174 of the C/C genotype patients (p=0.387). European ancestry, in subjects with G allele, was 0.640 and C/C genotype, 0.639 (p=0.601); East Asian contribution in G allele was 0.086, similar to C/C genotype frequency, 0.095 (p=0.249). Native American ancestry contribution according to PNPLA3 genotype frequency was also similar, with C/C being 0.100 and G allele, 0.092 (p=0.663) (Table 4). In the NASH group, only patients with the PNPLA3 G allele showed high ALT and AST levels compared to other genotypes (p=0.017 and p=0.014, respectively) (Table 4). However, when we included ancestry in the analysis, there were no differences regarding AST and ALT levels. (Table Suppl.).
Genetic ancestry, clinical and laboratory variables according to the genotypes of the PNPLA3 and TM6SF2 variants in patients with non-alcoholic steatohepatitis
BMI, Body Mass Index; HOMA-IR, Homeostatic Assessment Model;
AST, aspartate aminotransferase; ALT, alanine aminotransferase
GGT, gamma glutamyl transferase; HDL cholesterol, High-density lipoprotein
The TM6SF2 (rs58542926) polymorphism was not in Hardy-Weinberg equilibrium (chi-square test: 6.122, p=0.013). Allele*1 frequency found was 0.265. Considering TM62SF e NAFL patients, the C/C genotype was found in 85.3% of patients and C/T plus T/T in 14.7%; and in the NASH, 90.1% had C/C and 9.9% C/T plus T/T (p=0.547, OR 0.634; CI95% 0.222-1.814) (Table 2). In the NAFL or NASH, genetic ancestry contributions were similar among groups. The TM62SF genotypes had no significant association with the studied variables (Tables 3 e 4).
Among all NAFLD patients, when evaluating the presence of significant or mild fibrosis, the contribution of genetic ancestry was similar between groups. We did not detect a statistically significant association between genetic ancestry and liver fibrosis stage, PNPLA3, and TM6SF2 polymorphisms (Table 5). There were no individuals with the TM6SF2 T/T genotype in the advanced fibrosis group (Table 5).
Association between liver fibrosis in patients with non-alcoholic fatty liver disease, genetic ancestry and PNPLA3 and TM6SF2 genotypes in patients from a mixed population.
Additionally, genetic ancestry did not influence variables such as gender, T2DM, HOMA-IR, MtS, ALT or AST, or NAFL.
4DiscussionNAFLD has emerged as a significant cause of liver disease and is speedily increasing as an indication for liver transplantation. Several authors have demonstrated an uneven distribution of NAFLD in ethnically distinct populations. Non-alcoholic fatty liver disease histology, risk factors, and natural history data are mainly from white individuals of a more homogeneous background and, thus, cannot be fully extrapolated to large, admixed populations [36,37].
To our knowledge, this is the first study to assess genetic ancestry and its potential influence on the PNPLA3 and TM62SF gene variants in patients with biopsy-proven NAFLD from a highly admixed population.
We evaluated subjects who comprised people from all over Brazil and represented well the Brazilian miscegenation. The state of São Paulo has a very heterogeneous population, characterized by a significant immigration history, which makes it an example of high miscegenation. Several studies suggest that the Brazilian population is admixed, especially of tri-hybrid structure (European, Amerindian and African ancestry), except in a few communities that remain geographically isolated. Therefore, the mixed proportions vary across the different country regions due to historical issues. In Sao Paulo, it is not surprising to see a higher contribution of European ancestry, given the number of post-war European immigrants concentrated in the South and Southeast regions. Previous analyzes also showed that in countries with high levels of ethnic admixture, as is the case in Brazil, skin color and other phenotypic characteristics may not be sufficient to identify the ancestry of individuals.
Data from our casuistry confirmed the association between the well-known clinical risk factors and the development of steatohepatitis, even though several genetic ancestry parameters were not significantly correlated to NAFL or NAFLD. Nevertheless, we found a higher African genetic ancestry contribution among patients with NAFL who had the PNPLA3 C/C genotype than those with the G allele (0.216 ± 0.205 versus 0.105 ± 0.101, respectively; p = 0.047). The genetic ancestry contributions did not differ among TM6SF2 genotypes.
Previous studies have shown that Hispanics and Caucasians have the highest frequency of NAFLD, while African Americans have the lowest [5]. Kollwitz et al.[38] studied more than 12,000 Hispanic adults, including subjects of Mexican, Dominican, Puerto Rican, Cuban, Central American, and South American descent. They reported a 19% prevalence of NAFLD that was highest in patients of Central American heritage, South Americans, or Mexicans, whereas individuals of Cuban, Puerto Rican, and Dominican origin had lower NAFLD rates. These observations, however, were not explained by differences in rates of metabolic syndrome, physical activity, obesity, or diet [38].
The PNPLA3 SNP (rs738409) is recognized as a risk factor for NAFLD, a NASH severity marker, and appears to be associated with ancestry, with its frequency varying in different populations of the world [15]. In the present study, the G allele frequency was higher (71%) than those observed in another study performed in the Brazilian population (34%) [39], and in another paper that reported its prevalence to be 45% in Americans, 35% in individuals from East Asia, 23% among Europeans, and 15% in Africans [36,39]. There are reports about the G allele being twice as common in Hispanic Americans compared to African Americans (40% versus 19%) and being correlated with a greater prevalence of NAFLD in Hispanic Americans compared with African Americans (24 versus 9%) [40]. The G allele's highest frequency was reported in Hispanics (49%) by some authors, with lower frequencies in European Americans (23%) and African Americans (17%) [41,42]. Studies have also described the presence of the G allele in Asian Indian subjects with NAFLD [15,43].
In our study, the fact that C/C homozygosis was associated with African genetic ancestry suggests that a lower frequency of the G allele is a possible favorable prognostic factor against NASH development in this admixed population that merit special attention in further studies. Racial miscegenation possibly balances the effect of genetic and other prognosis-associated risk factors for NAFLD in Brazilians, but we cannot speculate at this point if these differences in each ancestry contribution could modify these results. Generally, African descents have lower visceral adiposity than other ethnic groups [41]. These data may suggest this to be a possible reason for their lower NAFLD prevalence. However, it is possible that, with age, the level of visceral adiposity increases, and the black-people lower-level visceral adiposity racial-related protection would gradually dissipate and increase the risk of NAFLD afterward [41,42]. Previous data classifying race by self-denomination showed that African descents had a worse cardiovascular risk factors profile than Caucasians. But, recent analysis has related a higher proportion of African ancestry with better lipid profile, a lower baseline cardiovascular risk, and a modest, but statistically significant, lower risk on follow-up, even in more homogeneous populations in comparison with a higher proportion of European ancestry. [44,45]. NAFLD may trigger faster cardiovascular disease progression. Previous studies, mainly about viral hepatitis, suggest differences in cellular immune response related to ethnicity, with the inadequate immune response of CD4 T cells among Afro-descendants, suggesting deregulated effector function than Caucasians [46]. The influence of molecular and genetic changes and the inflammatory response on metabolic syndrome and ancestry-related NAFLD, especially in admixed populations, is still a field to be explored. Additionally, this sets the stage for looking at ancestry and the PNPLA3 as treatment response modifiers in treatment trials.
On the other hand, in our study, PNPLA3 (rs738409) and TM6SF2 (rs58542926) variants were not associated with NAFL or NASH. However, previous studies carried out in Brazilians that compared these SNPs from NAFLD patients and control subjects without NAFLD, reported a significant association between PNPLA3 and NAFLD and NASH progression [39,47]. In healthy Brazilians, the frequencies of PNPLA3 C/C and the G alleles were 49.25% and 50.74%, respectively, regardless of ancestry. They were 31.05% and 68.88% in NAFLD patients, respectively (p = 0.004). After adjusting for age and sex, in the logistic regression analyses, G/G homozygotes had a 3.3 times greater risk of having NAFLD than C/C subjects (p = 0.004).[47]
Another study evaluated 9,229 Hispanic, African-American, and European individuals. The authors found that the PNPLA3 G allele (rs738409) was strongly associated with increased hepatic fat concentrations and hepatic inflammation [15]. Other evidence has shown that the G allele was most common in Hispanics, the most susceptible group to NAFLD, and liver fat content was more than twice as high in homozygotes than in non-carriers. Resequencing showed another PNPLA3 allele (rs6006460 [T], encoding S453I) that was associated with lower liver fat content in African Americans, the group at the lowest risk of NAFLD [15]. Thus, the variation in PNPLA3 contributes to ancestry-related and inter-individual differences in liver fat content and susceptibility to NAFLD [15].
In the NAFL group, individuals with the G/C and G/G PNPLA3 genotypes presented a less favorable lipid profile, including lower HDL cholesterol and greater triglyceride levels when compared to C/C genotype. The NASH group did not carry the same findings, as well as there was no genetic ancestry influence. This topic is controversial, with some data showing no association between PNPLA3 variants and BMI, insulin resistance, HOMA-IR, plasma triglyceride, or cholesterol levels [15,48]. A recent analysis showed that a higher proportion of European ancestry was associated with increased triglycerides and lower HDL-cholesterol levels after controlling for clinical and demographic factors (p < 0.05) compared to subjects with West African genetic ancestry, demonstrating that this also influences these outcomes [44]. Moreover, after adjustment for potential confounders, a higher proportion of African genetic ancestry was associated with a modestly lower risk for cardiovascular events [45]. Genetic variations in PNPLA3 confer a markedly increased or decreased risk of severe histological features of NAFLD and impact on metabolic syndrome components related to NAFLD progression and may explain the observed differences in NAFLD rates in patients from different ancestries.
In this present study, patients with NASH had a higher frequency of type 2 DM, metabolic syndrome, obesity, insulin resistance, AST, and GGT levels when compared to those with NAFL, but they were not associated with PNPLA3 or TM6SF2. In a previous study from Brazil, the PNPLA3 G allele was associated with an increased risk of biopsy-proven NAFLD, even after adjustment for age and sex compared to the non-NAFLD control population [47]. In another model, including NAFLD patients selected by the fatty liver presence in ultrasound test, after adjusted for sex, age, BMI, and type2 DM, the G allele increased the chance to NAFLD, when compared to the non-NAFLD control group, and NASH when compared to patients with NAFL [39]. The risk for NASH was higher if G/G homozygosity was present [39]. The evaluation of TM6SF2 polymorphisms in the Brazilian population did not demonstrate any association with NAFLD or NASH [39].
Diagnosis of NAFLD was performed by imaging methods in some studies, with interpretive criteria that seem to vary a lot according to the professional experience of the different regions, which can compromise the performance of the analyzes and reduce the sensitivity and specificity of the results. A strength of our study is that we diagnosed NAFLD by liver biopsy. Lisboa et al. applied ultrasonographic criteria for NAFLD patient selection, and only individuals at risk for NASH were biopsied [39]. Radiological studies have also revealed differences when comparing NAFLD rates in individuals of various races or ethnicities. A multiethnic patient population study performed proton fat magnetic resonance spectroscopy in 2,287 subjects and noted a variation in the frequency of hepatic steatosis based on ethnicity: Hispanics, 45%, non-Hispanic whites, 33%, and Afro-Americans, 24%. Another analysis evaluated 1,142 adults of Hispanic and African American descent with abdominal CT scans, finding a prevalence of NAFLD in Hispanics of 24% compared to 10% in African Americans [48]. A study that screened patients based on ultrasound from 442 individuals revealed that 52% of Mexican Americans in the study population met radiological criteria for NAFLD [49].
The absence of the TM6SF2 (rs58542926) action would lead to the accumulation of hepatic triglycerides and lower the cardiovascular risk. Several studies found an association between the TM6SF2 T minor allele and liver steatosis, advanced fibrosis, and cirrhosis [3,47]. On the other hand, our study did not find, in both NAFL and NASH patients, any significant association between genetic ancestry and TM62SF (rs58542926) genotypes or other variables.
A study that evaluated multiethnic obese adolescents, comprising 42% Caucasians, 28% African Americans, and 30% Hispanics showed that the T allele was associated with high liver fat content in Caucasians and African Americans, elevated alanine aminotransferase levels in Hispanics, and a more favorable lipoprotein profile in Caucasians and Hispanics. Among subjects carrying the T allele, the liver biopsy showed a higher prevalence of fibrosis and increased non-alcoholic fatty liver disease activity score than those homozygous for the C allele [14].
Of note, our results agree with the unique study previously performed in a Brazilian population that observed no association between TM62SF variant with NAFLD or controls [39], and the TM6SF2 (rs58542926) was not in Hardy Weinberg equilibrium. The rs58542926 is a less frequent variant; therefore, the sample size perhaps explains the lack of presence of Hardy Weinberg equilibrium. Our study did not analyze the genetic ancestry influence on non-NASH controls. This fact could be a possible limitation of the PNPLA3 and TM6SF2 variants results.
5ConclusionsIn conclusion, we found a higher African genetic ancestry contribution among patients with simple hepatic steatosis who had the PNPLA3 C/C genotype than those with the G allele. This finding might suggest that African genetic ancestry contribution could be a good prognostic factor. Heterogeneous populations may balance the impact of risk factors on NAFLD patients, a possible explanation for the lack of association of the PNPLA3 G and TM6SF2 C alleles with NASH. However, other studies that use informative genetic markers of ancestry and diverse sample are still necessary for populations with N AFLD and high genetic heterogeneity.
Author contributionsLourianne N Cavalcante, Claudia P Oliveira, Daniel Mazo and Andre C Lyra had substantial contributions to the conception and design of manuscript; Rui Manuel Reis, Jun Porto and José Tadeu Stefano contributed to the acquisition, analysis or interpretation of the data. Adhemar Longatto-filho assisted in the writing of the article and review of intellectual content. Dr. Arun J Sanyal contributed his expertise to the final critical review of the study. Flair J Carrilho and Venancio A F Alves contributed to the final approval of the version to be submitted, and all authors are in agreement with all aspects of the paper. Claudia P Oliveira supervised the entire work. Lourianne N Cavalcante will be the correspondence author, ensuring that issues related to the accuracy or integrity of any part of the article are properly investigated and resolved; she also provided administrative, technical and material support for the study.
Highlights- •
PNPLA3 (rs738409) and TM6SF2 (rs58542926) variants are risk factors for non-alcoholic fatty liver disease (NAFLD)
- •
African descendants, evaluated by ancestry self-classification, have milder NAFLD.
- •
Higher PNPLA3 G allele frequency is associated with NASH and ancestry in more homogeneous populations.
- •
In an admixed population, higher African genetic ancestry was associated with a lower frequency of the PNPLA3 G allele among patients with simple steatosis (NAFL)
- •
There was no difference between genetic ancestry and PNPLA3 genotypes in subjects with NASH.
- •
The TM6SF2 variant did not influence ancestry or NAFLD in an admixed population sample.
We would like to thank Dr. Rui M Reis, Center for Research in Molecular Oncology, Barretos Cancer Hospital, for his support and availability to assist in this project, Dr Arun J Sanyal, Virginia Commonwealth University, for valued collaboration and Dr. Claudia P Oliveira, Faculty of Medicine, University of São Paulo, for your absolute support in all phases of this study.


