


The Balance of Risk (BAR) Score, a simple scoring system that combines six independent donor and recipient variables to predict outcome after liver transplantation (LT), was validated in a large U.S./European cohort of patients. This study aims to assess the performance of the BAR score to predict survival after liver transplantation and determine the factors associated with short and long-term survival in Latin-American patients.
Material and methodsA retrospective cohort study was performed in 194 patients [112 (55.4%) males; mean age 52±14 years] who underwent 202 LT during the period 2003–2015. Demographic, clinical, pathological and surgical variables, as well as mortality and survival rates, were analyzed. The BAR score was investigated through a receiver operating characteristics (ROC) curve with the calculation of the area under the curve (AUC) to evaluate the predictive score power for 3-month, 1 and 5-year mortality in a matched donor–recipient cohort. Youden index was calculated to identify optimal cutoff points.
ResultsThe AUC of BAR score in predicting 3-month, 1-year and 5-year mortality were 0.755 (CI95% 0.689–0.812), 0.702 (CI95% 0.634–0.764) and 0.610 (CI95% 0.539–0.678) respectively. The best cut-off point was a BAR score ≥15 points. In the multivariate analysis BAR score <15 was associated with higher survival rates at 3 months and 1 and 5-years.
ConclusionsBAR score <15 points is an independent predictor of better short and long-term survival in Latin-American patients undergoing LT. The BAR scoring system has an adequate diagnostic capacity allowing to predict 3 and 12-month mortality.
Since its implementation in 2002, the Model for End-Stage Liver Disease (MELD) scoring system has transformed liver allograft allocation in the United States and worldwide due to its accuracy to predict short-term mortality in cirrhosis, which is useful to prioritize patients in the waiting list [1]. However, this score is a poor predictor of long-term survival following liver transplantation (LT) [2,3]. The lack of donor and graft variables in the model could explain the discrepancy between MELD score and survival after LT. Also, several transplant centers evaluated if the “sickestfirst” policy affects the outcomes after LT. In this regard, a recent multicentric German study showed that post-LT survival markedly declined after the introduction of liver allocation using MELD score [4]. In another study, the MELD score was found to be a poor predictor of post-transplant outcome except for patients presenting the highest 20% of MELD scores [2]. Thus, more accurate tools to predict post-transplant outcomes are needed. Indeed, the current debate on prognostic scores in LT relates to transparency, fairness, and justice in the allocation process to balance equity, urgency, and utility [5–7]. Since recipient variables are not predictive of long-term survival, many attempts have been undertaken to improve the selection prior to LT. The use of a combined score that includes both recipient and donor parameters has already been tested [8]. Despite the fact that Survival Outcomes Following Liver Transplantation (SOFT) score allows predicting 3-month survival following LT accurately, the inclusion of an extensive list of covariates results in less applicability. Recently, a multicentric study – conducted in the United States and Europe – reported the Balance of Risk (BAR) Score [9]. This score which includes six independent donor and recipient variables has been shown to have a good predictive capacity even in the pediatric transplant population [10]. Nevertheless, in Latin America, a Brazilian study demonstrated a suboptimal ability of the BAR score concerning the prediction of survival after LT [11].
The current study aims to assess the performance of the BAR score to predict survival after LT in a Chilean transplant center and to determine the factors associated with short and long-term survival.
2Materials and methodsA retrospective cohort including 194 patients who underwent 202 LT during the period January 2003–December 2015 at the Pontificia Universidad Católica de Chile University Hospital was analyzed.
2.1Study populationThe study included all adults patients (≥ 18 years) undergoing LT because of acute or chronic liver disease from deceased brain death (DBD) donors. The exclusion criteria were a partial transplant (split and living donor transplantation), combined LT and incomplete medical records.
A database was designed to analyze demographic, clinical, pathological and surgical variables, mortality and survival. For this study, the waiting time considers only patients undergoing elective liver transplantation. We included patients who were allocated with MELD exception points, but only the real MELD score without the inclusion of the exception points was taken into consideration.
The BAR score was calculated according to the formula available at http://www.assessurgery.com/bar-score/bar-score-calculator, considering donor age (years), cold ischemia time (hours), retransplantation (yes/no), pre-operative life support (yes/no), recipient age (years) and MELD score. The score ranges from 0 to 27 points.
2.2Statistical analysisSoftware SPSS 22.0 (SPSS Inc. Chicago, IL) and MedCalc 14.8 (MedCalc Software bvba, Ostend, Belgium), considering as significant a p-value less than 0.05 was used. For the description of continuous variables, the mean and standard deviation or median and interquartile range was used as appropriate. The description of qualitative variables was performed using absolute frequencies and percentages. The Kolmogorov–Smirnov test was used to determine the distribution of the continuous variables. The BAR score was analyzed through a receiver operating characteristic (ROC) curve [12] with a calculation of the area under the curve (AUC) to know its capacity in the mortality prediction for the matched donor–recipient at 3-month, 1 and 5-year. To determine the best cut-off point, we calculated the Youden index (Youden index=sensitivity+specificity−1). Survival analysis was done using the Kaplan–Meier method, and the comparison between groups was performed using Log-rank test. Additionally, the cut-off point of 18 such as proposed by Dutkowski was also analyzed [9].
The multivariate analysis was performed using a Cox proportional hazards model to determine which factors were associated with survival, controlling for confounding variables. We introduced the variables of the univariate analysis having a p-value less than 0.2 into the multivariate model. Only the cut-off point of the BAR score obtained by the Youden index was included in the multivariate analysis. The variables that are contained in the BAR score did not appear in the analysis.
2.3Ethical approvalThis study was conducted in accordance with the ethical regulations of the Pontificia Universidad Católica de Chile. No specific informed consent was required due to the anonymized nature of the data retrieved. No data allowed the identification of patients under study.
3ResultsThere were 112 (55.4%) males; the mean patient age was 52±14 years (Table 1). The most frequent indication for LT was nonalcoholic steatohepatitis in 35 patients (17.3%), followed by alcohol abuse in 32 patients (15.8%). The median real MELD and BAR scores were 21 (14–29), and 8 (4–14) respectively. The minimum and maximum BAR values were 2 and 22. The median days in the intensive care unit and hospitalization were 3 (2–7) and 15 (11–24) respectively. The 30-day mortality was 20 (9.9%), and the in-hospital mortality was 23 (11.4%). Liver retransplantation was performed in 8 patients (4%).
Patients demographics, etiology of liver disease and clinical characteristics.
| Variables | n=202 |
|---|---|
| Gender (males) | 112 (55.4%) |
| Age (years) | 52±14 |
| Etiology of liver disease | |
| Nonalcoholic steatohepatitis | 35 (17.3%) |
| Alcoholic | 32 (15.8%) |
| Viral | 28 (13.9%) |
| Metabolic disease | 27 (13.4%) |
| Toxic drugs | 24 (11.9%) |
| Other diagnosis | 56 (27.7%) |
| Hepatocellular carcinoma | 47 (23.3%) |
| Urgent transplantation | 65 (32.2%) |
| Waiting time (months) | 9 (2–16) |
| Body mass index (kg/m2) | 27.1±3.6 |
| MELD | 21 (14–29) |
| Retransplantation | 8 (4%) |
| Life support at liver transplantation | 56 (27.7%) |
| BAR score | 8 (4–14) |
| In-hospital mortality | 23 (11.4%) |
MELD, Model for End-Stage Liver Disease; BAR, Balance of Risk.
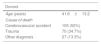
The mean age of the donors was 42±13 years. The median cold ischemia time and warm ischemia time were 7 (6–9) h and 35 (27–47) min (Table 2). The 3-month, 1-year, and 5-year survival were 87%, 81%, and 70% respectively.
Donors and operative factors.
| Donors | |
|---|---|
| Age (years) | 41.6±13.2 |
| Cause of death | |
| Cerebrovascular accident | 105 (52%) |
| Trauma | 70 (34.7%) |
| Other diagnosis | 27 (13.3%) |
| Operative factors | |
|---|---|
| Operative time (hours) | 6 (5–7) |
| Cold ischemia time (hours) | 7 (6–9) |
| Warm ischemia time (minutes) | 35 (27–47) |
| Packed red blood cell use (units) | 3.5 (2–6) |
In the ROC curve analysis (Fig. 1), the AUC of BAR score in predicting 3-month mortality was 0.755 (CI95% 0.689–0.812). The cut-off point calculated by the Youden index was BAR score ≥15 points. With this cut-off point, the sensitivity was 62.9%, and the specificity was 80%. When comparing the 3-month survival of patients with BAR scores ≥15 or lower than 15, statistically significant differences were detected between both groups (67% versus 93% respectively, p<0.01; Fig. 2).


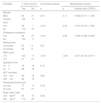
Table 3 presents the univariate and multivariate analysis of the factors associated with 3-month survival. In the univariate analysis, the variables related to a higher 3-month survival were: LT for Hepatocellular cancer (HCC) (p<0.01), elective LT (p<0.01) and BAR score below 15 points (p<0.01). However, in the multivariate analysis, only the BAR score below 15 points was associated with superior 3-month survival (Hazard ratio 0.210 (0.078–0.562); p<0.01).
Univariate and multivariate analysis of factors associated with 3-month survival after LT.
| Variables | 3-Month survival | Univariate analysis | Multivariate analysis | ||
|---|---|---|---|---|---|
| Yes | No | p | p | Hazard ratio (CI95%) | |
| Gender | |||||
| Male | 70 | 15 | 0.12 | 0.17 | 0.587 (0.273–1.261) |
| Female | 105 | 12 | |||
| HCC | |||||
| Yes | 46 | 1 | <0.01 | 0.07 | 0.163 (0.022–1.204) |
| No | 129 | 26 | |||
| Emergency transplant | |||||
| Yes | 49 | 16 | <0.01 | 0.98 | 1.009 (0.382–2.660) |
| No | 126 | 11 | |||
| Waiting time | |||||
| <9 months | 58 | 6 | 0.58 | ||
| ≥9 months | 68 | 5 | |||
| BAR score | |||||
| <15 | 140 | 10 | <0.01 | <0.01 | 0.210 (0.078–0.562) |
| ≥15 | 35 | 17 | |||
| Operative time | |||||
| <6h | 82 | 13 | 0.91 | ||
| ≥6h | 93 | 14 | |||
| WIT | |||||
| <45min | 85 | 14 | 0.76 | ||
| ≥45min | 90 | 13 | |||
| Packed red blood cells | |||||
| <6 units | 84 | 10 | 0.29 | ||
| ≥6 units | 91 | 17 | |||
| Body mass index | |||||
| <25kg/m2 | 56 | 10 | 0.59 | ||
| ≥25kg/m2 | 119 | 17 | |||
HCC, Hepatocelular Carcinoma; BAR, Balance of Risk; WIT, warm ischemia time.
The BAR score with a cut-off of 15 has prognostic significance for 12-month survival, with an AUC of ROC curve of 0.702 (CI95% 0.634–0.764) (Fig. 3). With this cut-off point, the sensitivity was 55.2%, and the specificity was 81.1%. When comparing the 1-year survival of patients with BAR scores ≥15 or lower than 15 points, statistically significant differences were detected between both groups (59% versus 88% respectively, p<0.01; Fig. 4).


Table 4 shows the univariate and multivariate analysis of the factors associated with 1-year survival. In the univariate analysis, the variables associated with higher 1-year survival were: LT for HCC (p<0.01), elective LT (p<0.01) and BAR score below 15 points (p<0.01). Meanwhile, only the BAR score below 15 points (Hazard ratio 0.277 CI95% 0.124–0.617; p<0.01) and LT for HCC (Hazard ratio 0.101 CI95% 0.014–0.738; p=0.02) were associated with better 1-year survival in the multivariate analysis.
Univariate and multivariate analysis of factors associated with 1-year survival after LT.
| Variables | 1-Year survival | Univariate analysis | Multivariate analysis | ||
|---|---|---|---|---|---|
| Yes | No | p | p | Hazard ratio (CI95%) | |
| Gender | |||||
| Male | 64 | 21 | 0.07 | 0.11 | 0.592 (0.311–1.128) |
| Female | 100 | 17 | |||
| HCC | |||||
| Yes | 46 | 1 | <0.01 | 0.02 | 0.101 (0.014–1.738) |
| No | 118 | 37 | |||
| Emergency transplant | |||||
| Yes | 44 | 21 | <0.01 | 0.82 | 1.093 (0.490–2.439) |
| No | 120 | 17 | |||
| Waiting time | |||||
| <9 months | 55 | 9 | 0.57 | ||
| ≥9 months | 65 | 8 | |||
| BAR score | |||||
| <15 | 133 | 17 | <0.01 | <0.01 | 0.277 (0.124–0.617) |
| ≥15 | 31 | 21 | |||
| Operative time | |||||
| <6h | 76 | 19 | 0.70 | ||
| ≥6h | 88 | 19 | |||
| WIT (minutes) | |||||
| <45min | 80 | 19 | 0.89 | ||
| ≥45min | 84 | 19 | |||
| Packed red blood cells | |||||
| <6 units | 77 | 17 | 0.76 | ||
| ≥6 units | 87 | 21 | |||
| Body mass index | |||||
| <25kg/m2 | 50 | 15 | 0.28 | ||
| ≥25kg/m2 | 114 | 23 | |||
HCC, Hepatocelular Carcinoma; BAR, Balance of Risk; WIT, warm ischemia time.
In the last ROC curve analysis (Fig. 5), the AUC of BAR score in predicting 5-year mortality was 0.610 (CI95% 0.539–0.678). The cut-off point calculated by the Youden index was also 15. With this cut-off point, the sensitivity was 42.8%, and the specificity was 80.8%. When comparing the 5-year survival of patients with BAR scores ≥15 or lower than 15 points, statistically significant differences were detected between both groups (52% versus 75% respectively, p<0.01; Fig. 6).


Table 5 summarizes the univariate and multivariate analysis of the factors associated with 5-year survival. In the univariate analysis, the variables related to better 5-year survival were: elective LT (p=0.02) and BAR score below 15 points (p<0.01). However, in the multivariate analysis, only the BAR score below 15 points was associated with higher 5-year survival (Hazard ratio 0.372 CI95% 0.177–0.782; p<0.01).
Univariate and multivariate analysis of factors associated with 5-year survival after LT.
| Variables | 5-Year survival | Univariate analysis | Multivariate analysis | ||
|---|---|---|---|---|---|
| Yes | No | p | p | Hazard ratio (CI95%) | |
| Gender | |||||
| Male | 88 | 29 | 0.27 | ||
| Female | 58 | 27 | |||
| HCC | |||||
| Yes | 39 | 8 | 0.06 | 0.14 | 0.548 (0.245–1.225) |
| No | 107 | 48 | |||
| Emergency transplant | |||||
| Yes | 40 | 25 | 0.02 | 0.74 | 1.133 (0.540–2.376) |
| No | 106 | 31 | |||
| Waiting time | |||||
| <9 months | 50 | 14 | 0.90 | ||
| ≥9 months | 56 | 17 | |||
| BAR score | |||||
| <15 | 118 | 32 | <0.01 | <0.01 | 0.372 (0.177–0.782) |
| ≥15 | 28 | 24 | |||
| Operative time | |||||
| <6h | 67 | 28 | 0.43 | ||
| ≥6h | 79 | 28 | |||
| WIT (minutes) | |||||
| <45min | 75 | 24 | 0.36 | ||
| ≥45min | 71 | 32 | |||
| Packed red blood cells | |||||
| <6 units | 70 | 24 | 0.47 | ||
| ≥6 units | 76 | 32 | |||
| Body mass index | |||||
| <25kg/m2 | 45 | 20 | 0.48 | ||
| ≥25kg/m2 | 101 | 36 | |||
HCC, Hepatocelular Carcinoma; BAR, Balance of Risk; WIT, warm ischemia time.
In the end, we assessed the cut-off point >18 in the prediction of 3-months mortality. The sensitivity found was 22.2%, and the specificity was 94.2%. When comparing the 3-month survival of patients with BAR scores >18 or ≤ than 18 points, statistically significant differences were detected between both groups (66% vs 89%, p<0.01).
When analyzing the cut-off point >18 in the prediction of one-year mortality, the sensitivity was 18.4%, and the specificity was 94.5%. When comparing the one-year survival of patients with BAR scores >18 or ≤ than 18 points, statistically significant differences were observed between both groups (59% versus 84%, p<0.01).
Then, we evaluated the cut-off point >18 in the prediction of five-year mortality. The sensitivity found was 14.2%, and the specificity was 94.5%. When comparing the 5-year survival of patients with BAR scores >18 or ≤ than 18 points, statistically significant differences were detected between both groups (50% versus 72%, p<0.01).
4DiscussionIn the present study, a BAR score <15 points was an independent predictor of higher 3-month, 1 and 5-year survival compared with patients with a score ≥15 as indicated by the Cox proportional hazards model. The ROC curve analysis showed a moderate predictive accuracy of the BAR score in the prediction of 3-month and 1-year mortality.
In the previous studies [9,10,13], the BAR score proved to be useful to find good donor–recipient matches in a quick, easy and reproducible way, and thus optimize the recipient survival and avoid futile LT. Nevertheless, in other studies, it showed suboptimal ability to fix donor–recipient matches because of other interfering survival predictor factors such as blood transfusions [11]. In contrast to other studies [14,15], we found no association between red blood cell transfusion and mortality in the short or long term follow-up. Neither the waiting time on the list, the operative time, the warm ischemia time nor the body mass index were associated with significant differences on survival.
The BAR score may be a useful guide to an individualized donor organ acceptance decision at the transplant center optimizing thereby the match donor/recipient efficacy of the gifted graft in regions with low donation rate such as our country [16].
The current study demonstrated an adequate ability of the BAR score for the prediction of 3-month and 1-year mortality after LT because the AUC was ≥0.700. Widely accepted international consensus requires AUC greater than 0.700 for a potentially useful clinical test, diagnostics and prognostic models [17–19]. This threshold could not be reached in this series by the AUC of the BAR score related to predicting 5-year mortality, but their death can be due to other causes such as recurrent diseases. It should be noted that the AUC obtained in the present study was lower than those achieved in studies based on the United Network for Organ Sharing and Organ Procurement and Transplantation Network databases [9,10]. This could be because these were the databases used for the creation of the BAR score, which has a greater number of transplants and they may not represent the characteristics of our patients. For example, when comparing the United Network for Organ Sharing database with our results it is noted that our patients have a higher MELD (median of 21 versus 18) at the time of liver transplantation. Another factor that can alter survival is the waiting time for LT. In the study by Dutkowski et al. it was 65 days versus 9 months in our study.
The last point that remains to be discussed is how to determine the optimal BAR cut-off score for the decision-making to transplant a particular recipient [11]. In the study of Dutkowski et al. [9] a cut-off point of 18 was proposed, but in the present study, after applying the Youden index, we obtained a cut-off point of 15. Based on these results, this cut-off may be more useful in transplantation decisions in our transplant environment. Anyway, the results obtained when applying the cut-off point of 18, showed statistically significant differences in patient survival in both short and long-term follow-up. We feel that the 18-point barrier could be seen as the futility frontier. It should be noted that the decrease in the value of the BAR score to consider a LT as futile will improve the survival of patients undergoing LT, but would necessarily imply that many recipients will not be acceptable or will never be able to obtain a liver graft for transplantation.
There are other scores, such as Donor Risk Index (DRI) [20,21] and the SOFT score [22] that also have good accuracy in predicting post LT survival. However, the DRI includes only donors factors in the score, and some of them such as race or donors height is less applicable in our Hispanic and native populations. On the other hand, the SOFT score which combines 18 risk factors is a less practical tool in clinical practice compared to the BAR score. So, a well-tested, and robust prognostic model incorporating suitable donor and recipient variables are urgently needed to increase transparency and testability of critical transplant decisions as a tool key to just raise trust in transplantation on the long-term. Recently in Brazil, two models [23,24] were created that combine factors of the recipient and the donor to obtain a greater survival of the recipient and the graft. It is necessary to perform new studies to determine if these models are useful in other LT centers.
Although LT for HCC was associated with superior 1-year survival, this finding was not confirmed in the 3-month and 5-year survival analysis. Therefore, no firm conclusions can be drawn from this finding.
The limitations of the present study are its retrospective nature of the design, the relatively lower number of patients compared to previous studies and the fact that these results represent the experience of a single center in our country. This last point is fundamental because other centers could have different characteristics of recipients, donors or grafts and this would limit the external validity of the present study. The benefit of this study is to demonstrate that the BAR score is applicable in the Latin American population with good performance.
In conclusion, the BAR score below 15 is an independent factor associated with a higher short and long-term survival on the follow-up in DBD-LT. We feel in our population the BAR score represents an adequate predictor of 3-month and 1-year mortality with a cut-off point of 15.
However, validation in broader patient populations may be necessary although to find a model robust enough to be applicable across different centers and countries may not be possible [25].AbbreviationsAUC area under the curve balance of risk deceased brain death donor risk index hepatocellular cancer liver transplantation model for end-stage liver disease receiver operating characteristics survival outcomes following liver transplantation warm ischemia time
- -
Participated in research design: Jorge A. Martínez, Sergio Pacheco, Jean P. Bachler, Nicolás Jarufe, Eduardo Briceño, Juan F. Guerra, Rodrigo Wolff.
- -
Participated in the writing of the paper: Jorge A. Martínez, Sergio Pacheco, Eduardo Briceño, Juan F. Guerra, Carlos Benítez, Rodrigo Wolff, Francisco Barrera, Marco Arrese.
- -
Participated in the performance of the research: Jorge A. Martínez, Sergio Pacheco, Jean P. Bachler, Nicolás Jarufe, Eduardo Briceño.
- -
Contributed new reagents or analytic tools: Jorge A. Martínez, Sergio Pacheco, Jean P. Bachler, Nicolás Jarufe.
- -
Participated in data analysis: Jorge A. Martínez, Sergio Pacheco, Jean P. Bachler, Nicolás Jarufe, Eduardo Briceño, Juan F. Guerra, Carlos Benítez, Rodrigo Wolff, Francisco Barrera, Marco Arrese.
- -
Author who is responsible for the integrity of the work as a whole: Jorge A. Martínez.
This study was conducted in accordance with the ethical regulations of the Pontificia Universidad Católica de Chile. No specific informed consent was required due to the anonymized nature of the data retrieved. No data allowed the identification of patients under study.
FundingNo funding to report.
Conflicts of interestThe authors declare no conflicts of interest.


