


Introduction and aim. Association of vitamin D deficiency (VDD) with fatty liver (FL) disease is controversial. The purpose of this study was to analyze the association of VDD with FL.
Material and methods. Cross-sectional study. Data on cardiovascular risk factors, medications, alcohol intake, smoking, diet, and physical activity were obtained. Biochemical, anthropometric, and blood pressure variables were measured. The 25-hydroxyvitamin D (25(OH)D) was quantified through chemoluminescence. The presence of FL, defined as a liver/spleen attenuation index lower than 1.0, was identified through computed axial tomography (CAT).
Results. The study included 1,467 subjects (49.7% men) with a mean age of 53.3 ± 9.3 years and BMI of 28.3 ± 4.0 kg/m2. Only 11% had optimum values of vitamin D, and 25(OH)D concentration was lower in participants with FL. Multivariate logistic regression models, adjusted for age, gender, BMI, sampling season, glucose, total cholesterol, triglycerides, HOMA-IR, hs-CRP, ALT, AST, and elevated VAT, revealed an association between FL and vitamin D (VD) insufficiency (RM 1.61 [0.99-2.61]) and with VDD (RM 1.68 [1.02-2.77]); however, statistical significance was lost when including caloric consumption and physical activity in the model.
Conclusions. In Mexican adults, deficient VD concentration and FL were not independently associated of caloric consumption and physical activity.
In humans, the sources of vitamin D (VD) are food, dietary supplements and, mainly, the skin by exposure to 7-dehydrocholesterol to ultraviolet light. In the liver, the 25-hydroxylase enzyme transforms VD from the diet and skin into 25-hydroxyvitamin D (25(OH)D). This metabolite is the main circulating form and with the longest halflife, hence, it is the most utilized as marker of the content of this vitamin in the organism. Aside from its well-known effect on the regulation of calcium metabolism and in bone tissue homeostasis, some evidences suggest that VD participates in the regulation of cell proliferation, differentiation, and apoptosis, as well as in the regulation of immune cells.1,2
Low VD values in serum represent one of the most prevalent deficiencies in micronutrients worldwide. In the North of the USA, VD deficiency (VDD) has been informed in 60%, and in the state of Florida in 42%.3 In the European population, up to 70% could present VD deficiency or insufficiency.4 In our country, the national health survey of 2006 revealed that approximately 30% of the population presents this deficiency.5 A large number of studies have shown association of low 25(OH)D concentrations with cardiometabolic risk factors, like obesity, insulin resistance, diabetes, dyslipidemia, and metabolic syndrome.6–8 Non-alcoholic fatty liver disease (NAFLD), defined as the increase in liver fat content in the absence of excessive alcohol consumption and of viral origin alterations or of other types,9 is currently the most prevalent disease of the liver, and is present in 20 to 30% of the general population, tightly associated with obesity, particularly with the elevation of intra-abdominal visceral fat.10 In Mexico, NAFLD affects 32.4% of the adult population.11 Studies on the relation between VD and NAFLD have shown inconsistent results. Some did not find any association in either adults12 or a pediatric population,13 whereas other studies showed an inverse association between 25(OH)D concentration and the presence of NAFLD, but factors with important confounding roles, like visceral abdominal fat, physical activity, and energy consumption, were not included in the statistical models.14–16 Despite that the prevalence of excess weight, NAFLD, and VDD are high, the relation of VD with fatty liver has not been studied in the Mexican population.
The study on the Genetics of the Atherosclerotic Disease (GEA, for its initials in Spanish) is a cohort project being carried out currently at the National Institute of Cardiology “Ignacio Chávez” (INCICH, for its initials in Spanish), in Mexico City. The cross-sectional stage of the study was performed between 2008 and 2013 with an ample characterization of participants from the clinical, biochemical, and radiological points of view, which provided the opportunity to include them in this study aimed at determining if VDD is associated independently with the presence of fatty liver in the Mexican population.
Materials and MethodsThe study included participants from the GEA Project, designed to investigate the genetic and metabolic bases associated to the development of coronary artery disease (CAD) in the Mexican population. The cross-sectional stage of the GEA Project included 1,000 patients with premature CAD and 1,500 control subjects, residents of Mexico City, with special care in characterizing participants with and without CAD. The group with CAD was chosen from the outpatient service and the department of Hemodynamics of the INCICH. The control group was formed with volunteers of the open population, without clinical signs of CAD and no familial history of premature CAD, who were invited through written media. From both groups, we excluded participants with renal, hepatic, thyroid, or malignant diseases or those under corticosteroid treatment.17 The GEA study was approved by the Research and Bioethics Committee of the INCICH and was performed following the guidelines of the Helsinki Declaration. All participants signed the institutional informed consent form.
Study populationThis study is a cross-sectional analysis of the 1,500 control subjects, we excluded all subject without a liver to spleen attenuation ratio (n = 31) and missing 25(OH)D quantification (n = 5). The final analyzed sample was of 1467 subjects. The particular features of this population provide a good opportunity to analyze in a Mexican population the possible association of 25(OH) D with FL, as imaging studies were available for the diagnosis of FL. All participants answered standardized and validated questionnaires to obtain information on family and medical history, alcohol and tobacco consumption, dietary habits18 and physical activity.19
Anthropometric measures. Weight was determined with a calibrated scale, and height with a wall stadiometer SECA 222 (Hamburg, Germany). BMI was calculated by dividing the weight in kilograms by the square of the height in meters. Overweight was considered when the BMI was of 25 to 29.9 kg/m2, and obesity when ≥ 30 kg/m2. Waist circumference was measured with a fiberglass metric tape at the midpoint of the distance between the lower part of the last rib and the iliac crest. After resting for at least 10-min, blood pressure was measured three times in sitting position, using a digital sphygmomanometer (Welch Allyn, series 52000), and the last two measurements were averaged for analysis.
SamplesAfter a 12 h fasting, venous blood samples were obtained. Concentrations of glucose, total cholesterol (TC), triglycerides (Tg), high density lipoprotein cholesterol (HDL-C), aspartate aminotransferase (AST), and alanine aminotransferase (ALT), were measured in fresh samples through standardized enzymatic-colorimetric methods (Roche/Hitachi, Germany) in a Hitachi 902 autoanalyzer (Hitachi LTD, Tokyo, Japan). Low density lipoprotein cholesterol (LDL-C) concentration was calculated with the Friedewald formula modified by DeLong, et at.20 Precision and accuracy of lipid measurements at the laboratory of endocrinology are periodically evaluated by the Centers for Disease Control and Prevention (CDC) of Atlanta, GA, USA. Total high-sensitivity C-reactive protein (hs-CRP) was quantified by immunonephelometry (BN Pro Spec Nephelometer, Dade Behring, Marburg, GmbH, Germany). The coefficient of variation was < 6% for all assays. Plasma insulin concentrations were determined by a radioimmunoassay (Millipore Cat. No. HI14K, MO, USA) the intra- and inter-assays CV values were 2.1% and 6.8%, respectively. Hyperinsulinemia was defined as a value > 16.97 μυ/mL in women and > 15.20 /¿U/ mL in men. Resistance to insulin was estimated by the hemostatic model of insulin resistance (HOMA-IR).21 Insulin resistance was defined as HOMA-IR values > 75th percentile (3.66 μυ/mL in women and 3.38 μυ/mL in men). Adiponectin concentration was determined with an ELISA kit (R&D Systems, Minneapolis, USA) Quantikine kit. Hypoadiponectinemia was considered when adiponectin concentration was < 25th percentile (8.67 μg/mL in women and 5.3 μg/mL in men). Percentile values of insulin, HOMA-IR, and adiponectin were obtained from a subsample of the GEA study that included 131 men and 185 women without obesity and with normal values of blood pressure, glucose, and lipids. Diabetes mellitus was defined according to the American Diabetes Association criteria,22 or when participants were using glucose-controlling drugs and those with a previous diagnosis of diabetes performed by a physician. Concentration of 25(OH)D was quantified using chemiluminescence assay (Architect plus CI8200). Low, mid, and high concentration controls were used, which showed variation coefficients of 3.6%, 3.1%, and 4.05%, respectively. The inter-assay variation coefficient was of 2.1%. Vitamin D deficiency was considered when the 25(OH) D concentrations were < 20 ng/mL and insufficiency when values ranged from 20.1 to 29.9 ng/mL.23 Vitamin D consumption was assessed with a semi-quantitative food frequency questionnaire (FFQ)18 designed and validated by the National Institute of Public Health of Mexico. The amount consumed per day was estimated through a database of Mexican food contents.24 Physical activity was measured using the Baecke questionnaire.19 Total activity was obtained from the sum of the work exercise and leisure time activities. This questionnaire has been validated in adult populations and provides reliable information.
TomographyVisceral (VAT) and subcutaneous (SAT) abdominal adipose tissue, as well as liver and spleen attenuation, were quantified by computed axial tomography (CAT) using a 64-channel multidetector (Somaton Sensation, Siemens, Malvern, PA, USA) and interpreted by an experienced radiologist. From the obtained images, we assessed:
Statistical analysisData are presented as mean ± S.D., median (interquartile range), or percentage. Comparison among groups was performed with ANOVA, Kruskal-Wallis, or Chi square statistical tests, as needed. A simple Spearman correlation analysis was performed to know the relation of VD concentration with FL risk factors. Simple and multiple logistic regression analyses were performed to evaluate the independence of the relation between VDD and FL with adjustments according to four models. The first included age, BMI, and season of the year in which the sample was obtained; the second included model 1 plus glucose, total cholesterol and triglycerides; the third included model 2 plus HOMA-IR, hs-CRP, ALT, AST, and VAT; and the fourth consisted of model 3 plus total physical activity and total kilocalories consumption. We also performed a multivariate logistic regression analysis in the population without diabetes, stratified by the presence of insulin resistance. Values of p < 0.05 were considered statistically significant. All statistical analyses were performed using the SPSS software (SPSS version 16.0, Inc., Chicago, Il, USA).
ResultsThe study included 1,467 subjects (49.7% men), with a mean age of 53.3 ± 9.3 years, and BMI of 28.3 ± 4.0 kg/m2. Global prevalence of FL was of 33.2% and significantly higher in men than in women (36.5% vs. 29.9%, p = 0.008). Analysis of the prevalence of vitamin D revealed that in the studied population only 11% had optimal VD status, whereas insufficiency and deficiency were observed in 50.4% and 38.5% (p < 0.0001), respectively. As compared to men, women showed lower proportions in both optimal levels (6.5% vs. 15.6%, p < 0.0001) and insufficiency (44.6% vs. 56.4%, p < 0.0001) and a significantly higher prevalence of VDD (48.9 vs. 28%, p < 0.0001).
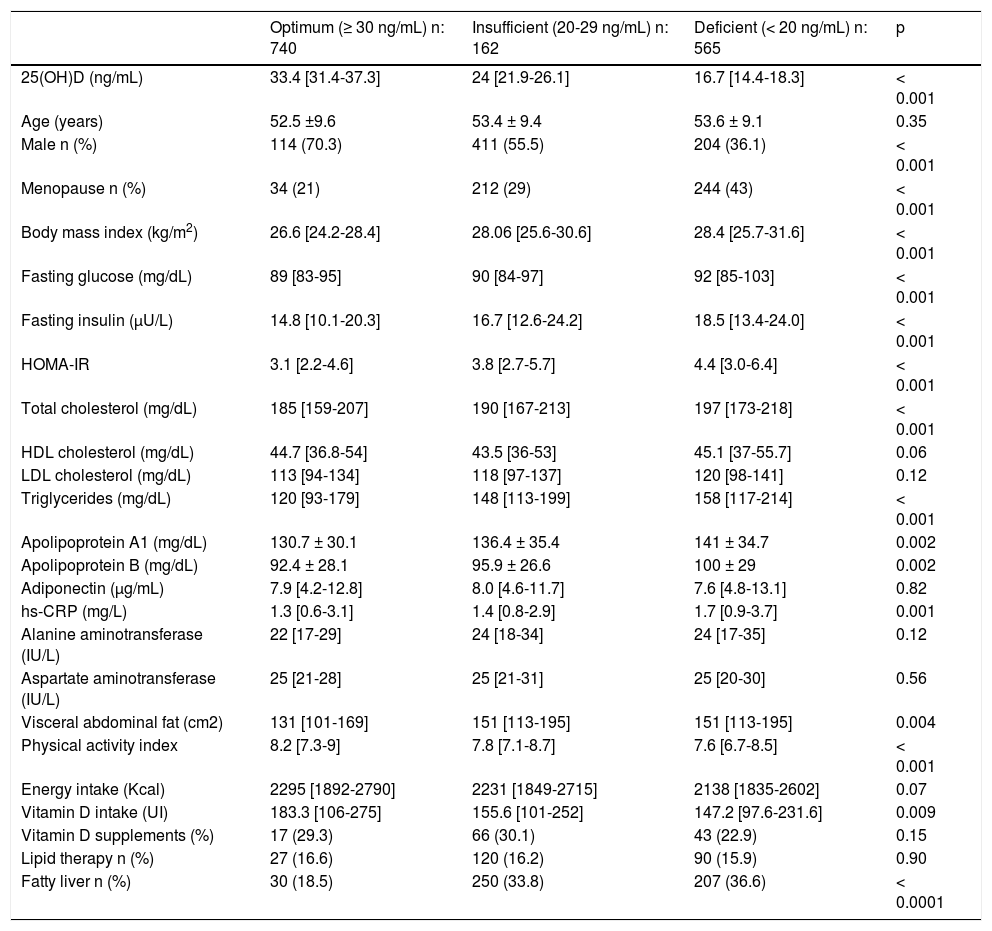
Table 1 shows the clinical characteristics of the studied population according to their VD status. As compared to the other two groups, those with VDD showed higher values of BMI, glucose, insulin, HOMA-IR, total cholesterol, triglycerides, hs-CRP, and VAT (p < 0.001), as well as a significantly higher prevalence of FL, and included a higher proportion of postmenopausal women. In contrast, the proportion of men, total physical activity, and VD intake were lower in subjects with VDD.
Clinical and anthropometric characteristics according to vitamin D status.
| Optimum (≥ 30 ng/mL) n: 740 | Insufficient (20-29 ng/mL) n: 162 | Deficient (< 20 ng/mL) n: 565 | p | |
|---|---|---|---|---|
| 25(OH)D (ng/mL) | 33.4 [31.4-37.3] | 24 [21.9-26.1] | 16.7 [14.4-18.3] | < 0.001 |
| Age (years) | 52.5 ±9.6 | 53.4 ± 9.4 | 53.6 ± 9.1 | 0.35 |
| Male n (%) | 114 (70.3) | 411 (55.5) | 204 (36.1) | < 0.001 |
| Menopause n (%) | 34 (21) | 212 (29) | 244 (43) | < 0.001 |
| Body mass index (kg/m2) | 26.6 [24.2-28.4] | 28.06 [25.6-30.6] | 28.4 [25.7-31.6] | < 0.001 |
| Fasting glucose (mg/dL) | 89 [83-95] | 90 [84-97] | 92 [85-103] | < 0.001 |
| Fasting insulin (μU/L) | 14.8 [10.1-20.3] | 16.7 [12.6-24.2] | 18.5 [13.4-24.0] | < 0.001 |
| HOMA-IR | 3.1 [2.2-4.6] | 3.8 [2.7-5.7] | 4.4 [3.0-6.4] | < 0.001 |
| Total cholesterol (mg/dL) | 185 [159-207] | 190 [167-213] | 197 [173-218] | < 0.001 |
| HDL cholesterol (mg/dL) | 44.7 [36.8-54] | 43.5 [36-53] | 45.1 [37-55.7] | 0.06 |
| LDL cholesterol (mg/dL) | 113 [94-134] | 118 [97-137] | 120 [98-141] | 0.12 |
| Triglycerides (mg/dL) | 120 [93-179] | 148 [113-199] | 158 [117-214] | < 0.001 |
| Apolipoprotein A1 (mg/dL) | 130.7 ± 30.1 | 136.4 ± 35.4 | 141 ± 34.7 | 0.002 |
| Apolipoprotein B (mg/dL) | 92.4 ± 28.1 | 95.9 ± 26.6 | 100 ± 29 | 0.002 |
| Adiponectin (μg/mL) | 7.9 [4.2-12.8] | 8.0 [4.6-11.7] | 7.6 [4.8-13.1] | 0.82 |
| hs-CRP (mg/L) | 1.3 [0.6-3.1] | 1.4 [0.8-2.9] | 1.7 [0.9-3.7] | 0.001 |
| Alanine aminotransferase (IU/L) | 22 [17-29] | 24 [18-34] | 24 [17-35] | 0.12 |
| Aspartate aminotransferase (IU/L) | 25 [21-28] | 25 [21-31] | 25 [20-30] | 0.56 |
| Visceral abdominal fat (cm2) | 131 [101-169] | 151 [113-195] | 151 [113-195] | 0.004 |
| Physical activity index | 8.2 [7.3-9] | 7.8 [7.1-8.7] | 7.6 [6.7-8.5] | < 0.001 |
| Energy intake (Kcal) | 2295 [1892-2790] | 2231 [1849-2715] | 2138 [1835-2602] | 0.07 |
| Vitamin D intake (UI) | 183.3 [106-275] | 155.6 [101-252] | 147.2 [97.6-231.6] | 0.009 |
| Vitamin D supplements (%) | 17 (29.3) | 66 (30.1) | 43 (22.9) | 0.15 |
| Lipid therapy n (%) | 27 (16.6) | 120 (16.2) | 90 (15.9) | 0.90 |
| Fatty liver n (%) | 30 (18.5) | 250 (33.8) | 207 (36.6) | < 0.0001 |
Data are expressed as median (interquartile range) or n (percentage). HOMA-IR: homeostasis model assessment of insulin resistance. hs-CRP: high sensitivity C reactive protein.
The simple Spearman correlation analysis in the whole population showed inverse and significant relations among 25(OH)D and BMI (r = -0.14), VAT (r = -0.05), glucose (r = -0.12), insulin (r = -0.11), HOMA-IR (r = -0.15), total cholesterol (r = -0.13), LDL-C (r = -0.06), triglycerides (r = -0.12), apoA-1 (r = -0.12), apoB (r = -0.08), and hs-CRP (r = -0.09), and direct and significant relations between 25(OH)D concentration and physical activity (r = 0.19) and L:SAR (r = 0.11).
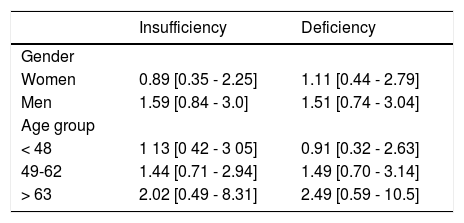
Independence of the association between VD insufficiency/deficiency and FL was evaluated by using multivariate logistic regression analysis (Figure 1). After adjusting for the variables included in models 1, 2, and 3 (age, gender, BMI, season of sampling, glucose, total cholesterol, triglycerides, HOMA-IR, hs-CRP, ALT, AST, elevated VAT), results revealed a 61% increase in the risk for FL in the participants with VD insufficiency (OR 1.61 [0.99-2.61], p = 0.05) and of 68% in those with VDD (OR 1.68 [1.02-2.77], p = 0.03). However, when physical activity and the total caloric consumption were added to the model, the statistical significance was lost. Also, similar analyses in the subjects without diabetes, stratified by insulin resistance (results not shown) did not reveal an independent association between VDD and FL. Additionally, we performed a stratified analysis by gender and age group (Table 2), these results confirmed the lack of association between the state of VD and the hepatic steatosis in both genders and age group.
. Model 1: Adjusted for age, sex, BMI, and recruitment season. Model 2: model 1 + glucose, tota cholesterol and triglycerides. Model 3: model 2 + HOMA-IR, hs-CRP, ALT, AST and elevated visceral fat. Model 4: model 3 + total physical activity and total kcal intake.")
Multivariate analysis of the association between vitamin D insufficiency/deficiency and fatty liver in the study population. Values are expressed in OR (95% CI). Model 1: Adjusted for age, sex, BMI, and recruitment season. Model 2: model 1 + glucose, tota cholesterol and triglycerides. Model 3: model 2 + HOMA-IR, hs-CRP, ALT, AST and elevated visceral fat. Model 4: model 3 + total physical activity and total kcal intake.
Association of vitamin D deficiency/insufficiency with fatty liver disease according to gender and age group.
| Insufficiency | Deficiency | |
|---|---|---|
| Gender | ||
| Women | 0.89 [0.35 - 2.25] | 1.11 [0.44 - 2.79] |
| Men | 1.59 [0.84 - 3.0] | 1.51 [0.74 - 3.04] |
| Age group | ||
| < 48 | 1 13 [0 42 - 3 05] | 0.91 [0.32 - 2.63] |
| 49-62 | 1.44 [0.71 - 2.94] | 1.49 [0.70 - 3.14] |
| > 63 | 2.02 [0.49 - 8.31] | 2.49 [0.59 - 10.5] |
Values expressed in OR (95% CI). Adjusted for age, sex, BMI, recruitment season, glucose, total cholesterol, triglycerides, HOMA-IR, hs-CRP, ALT, AST, elevated visceral fat, total physical activity and total kcal intake.
Results of this study performed in 1467 Mexican adults, with a mean age of 53.3 ± 9.3 years, revealed high prevalence of insufficiency (50.4%) and deficiency (38.5%) of vitamin D, mainly in women. Although the non-adjusted prevalence of FL was significantly higher in the groups with VD insufficiency and deficiency as compared to the group with optimal concentrations (33.8%, 36.6% vs. 18.5%, p < 0.0001), the multivariate logistic regression analysis adjusted by a wide variety of potential confounding and mediating factors revealed that there is no association between the low VD values and the presence of FL.
In recent years, studies on the association of VD with FL have reported conflicting results. An Italian study, of 262 patients, showed association of low VD values with FL independently of factors like age, gender, diabetes, dyslipidemia, and insulin resistance.14 Another study in a Korean population that included 345 men and 736 women, with an average age of 56.9 years, found an association of low VD value with FL after adjusting for potential confounding factors, including visceral abdominal fat, but only in patients with diabetes and in those without diabetes, but with insulin resistance.16 In an eastern China population, with high prevalence of FL (43%), an inverse relation between VDD and excess intrahepatic fat15 was observed. It is important to point out that in all these studies, the multivariate analyses were not adjusted for energy consumption,14–16 physical activity or abdominal visceral fat,14,15 which are factors with an important role on the development of FL. In the multivariate logistic regression analysis of the data from the present study, the association of VDD with FL was not modified by the adjustment for several factors with confounding potential including abdominal visceral fat; however, the statistical significance of the association was lost when physical activity and energy consumption were added to the model (Figure 1). These findings suggest that the discrepancies between our results and those of studies that have shown an association between VDD and excess of intrahepatic fat could be explained, at least partially, by the mentioned differences in the statistical analyses.
On the other hand and in line with our results, several prior studies in adults12,28 and children13,29 have not found an association between low 25(OH) D values and FL. The study of Brill, et al. is worthwhile mentioning, as it used methods considered gold standards, such as the euglycemic clamp to measure insulin sensitivity, proton magnetic resonance imaging, and spectroscopy (1H-MRS) to determine the content of hepatic fat, and liver biopsy to evaluate the severity of injuries.12 In the 239 adult patients studied, grouped according to normal (> 30 ng/mL), insufficient (20-30 ng/mL), and deficient (< 20 ng/mL) values of 25(OH) D and paired by BMI, total adiposity or prevalence of prediabetes/type 2 diabetes, the authors did not find differences in insulin sensitivity, in the amount of hepatic fat or in the severity of the histological injuries when comparing the three groups. Similarly, another study that included 102 pediatric patients, of 2 to 18 years of age with FL confirmed by liver biopsy, did not find an association of VDD with the severity of the disease in the histological images.13 These findings are consistent with a large study in adolescents, in which the concentrations of VD were not found independently associated with the presence of NAFLD diagnosed through ALT elevation.30 Results of a study performed in the USA that included 244 patients with NAFLD and 39 control subjects, in whom liver biopsy was performed due to suspicion of excess intrahepatic fat, did not reveal association of low 25(OH)D values with either the presence or the histological severity of NAFLD after adjusting for confounding factors.31 Collectively, the results of these studies and our present findings suggest that low 25(OH)D values are not associated with an increase in intrahepatic fat.
Strengths of our study include the participation of a large number of individuals that were adequately characterized from the clinical, demographical, biochemical, and tomographic points of view. In addition, statistical analyses were adjusted for factors influencing both the development of VDD and NAFLD.
The present study does have some limitations. First, due to its cross-sectional design, it is not possible to establish a causal relation. Second, NAFLD diagnosis was performed through CAT and after excluding hepatitis B and C, HIV/AIDS, and Chagas disease, but other potential causes of tomographic abnormalities, like viral hepatitis A, D, E, and G, autoimmune hepatitis, metabolic liver disease, anti-trypsin deficiency, Wilson’s disease, hemochromatosis, and celiac disease were not excluded. Third, NAFLD diagnosis was not confirmed through liver biopsy. However, a significant correlation has been shown between liver attenuation images of CAT and the histological grade of steatosis.32 Fourth, 25(OH)D was measured only once, although, 25(OH)D concentrations seem to be constant along time,33 besides, analyses were adjusted for the season of the year in which the sample was collected to diminish the impact of variations in sunlight radiation.34
In conclusion, the results of this study show a high prevalence of vitamin D insufficiency and deficiency in the studied population, particularly in women. Subjects with deficient 25(OH) D levels showed a higher prevalence of metabolic alterations as compared to those with adequate levels of this vitamin. However, after adjusting for a wide variety of factors with an important confounding potential, the low 25(OH) D concentrations were not found associated with the presence of NAFLD.
Abbreviation- •
25(OH)D: calcidiol.
- •
BMI: body mass index.
- •
CAD: coronary artery disease.
- •
CAT: computed axial tomography.
- •
FL: fatty liver.
- •
HOMA-IR: homeostasis model assessment of insulin resistance.
- •
NAFLD: nonalcoholic fatty liver disease.
- •
VAT: visceral abdominal adipose tissue.
- •
VD: vitamin D.
- •
VDD: vitamin D deficiency.
This project was supported by the National Council for Science and Technology (CONACYT GRANT: SALUD-2014-1-233727).
AcknowledgmentThe authors thank the subjects who participated in this study, as well as the staff of the Endocrinology and Molecular Biology Department.


