


The Hepamet fibrosis score was introduced for the diagnosis of advanced liver fibrosis in patients with non-alcoholic fatty liver disease (NAFLD). To date, external validation is limited, and its utility in combination with liver stiffness measurement (LSM) has not been explored.
Material and MethodsThis is a cross-sectional study on NAFLD patients who had a liver biopsy and LSM on the same day. The diagnostic performance of the Hepamet fibrosis score was evaluated using the area under the receiver operating characteristic curve (AUROC).
ResultsThe data for 196 patients were analyzed (mean age 50 ± 11 years old, 50% men, 56.6% Malay, 27.6% Chinese, 15.8% Indian, 67.9% NASH, 15.8% advanced liver fibrosis). The AUROC of Hepamet fibrosis score for the diagnosis of advanced liver fibrosis was 0.85 (95% CI, 0.80 – 0.91). Using the <0.12 and ≥0.47 cut-offs from the original study, the sensitivity, specificity, positive predictive value, negative predictive value, the proportion of indeterminate results and misclassification rate were 81.8%, 91.8%, 47.4%, 98.2%, 32.1% and 6.1%, respectively. Using LSM <10 kPa and ≥15 kPa for the diagnosis of absence and presence of advanced liver fibrosis, respectively, in patients with Hepamet fibrosis score ≥0.47 (i.e., the two-step approach) reduced indeterminate results and misclassification to 16.1% and 3.6%, respectively.
ConclusionsWe found the Hepamet fibrosis score to have good diagnostic accuracy in a population that was largely unrepresented in earlier work and demonstrated its utility in a two-step approach with LSM for the diagnosis of advanced liver fibrosis.
Non-alcoholic fatty liver disease (NAFLD) has emerged as the most common cause of chronic liver disease, affecting an estimated 25% of the global population [1]. The severity of liver fibrosis has been identified as the single most important predictor of long-term outcome in NAFLD patients with the risk of liver-related mortality and all-cause mortality increasing exponentially with increasing liver fibrosis stage [2]. As only a small but significant proportion of NAFLD patients have advanced liver fibrosis and NAFLD patients do not have specific symptoms unless they have progressed to decompensated liver disease, identifying NAFLD patients with advanced liver fibrosis for more aggressive management represents an important step in tackling the disease. A two-step approach has been proposed, whereby NAFLD patients identified as being at higher risk of advanced liver fibrosis based on a widely available test are referred for a second test for further risk stratification [3,4]. The original work was based on the use of the NAFLD fibrosis score and liver stiffness measurement with 8 kPa and 17 kPa cut-offs [3], but this was refined to the use of the Fibrosis-4 score and liver stiffness measurement with 10 kPa and 15 kPa cut-offs [4]. The Fibrosis-4 score had similar performance to the NAFLD fibrosis score despite requiring less variables for its calculation, and it has therefore emerged as the preferred test. Recently, a novel fibrosis score, called the Hepamet fibrosis score, has been developed for identifying NAFLD patients with advanced liver fibrosis [5]. The Hepamet fibrosis score has been reported to be superior to the NAFLD fibrosis score and the Fibrosis-4 score. However, there is limited external validation. Furthermore, the performance of the Hepamet fibrosis score in comparison with the NALFD fibrosis score and the Fibrosis-4 score in a two-step approach that is followed by liver stiffness measurement is unknown. Therefore, we aimed to study the performance of the Hepamet fibrosis score when used alone and when used in a two-step approach with liver stiffness measurement for the diagnosis of advanced liver fibrosis, comparing with the use of the NAFLD fibrosis score and the Fibrosis-4 score, in our cohort of biopsy-proven NAFLD patients.
2Material and MethodsThe patients included in this study were patients who were screened for a non-alcoholic steatohepatitis (NASH) clinical trial conducted at the University of Malaya Medical Centre between 2012 and 2015. The full details of the clinical trial can be found elsewhere [6]. Briefly, consecutive adult NAFLD patients (>18 years old) seen at the Gastroenterology and Hepatology Clinic of the University of Malaya Medical Centre were considered for inclusion into the clinical trial. The diagnosis of NAFLD was based on ultrasonography findings of fatty liver and exclusion of significant alcohol intake, use of medications that can cause hepatic steatosis, viral hepatitis B and C infection, and other causes of chronic liver disease, where indicated [7]. NAFLD patients with serum alanine aminotransferase (ALT) or aspartate aminotransferase (AST) levels ≥40 IU/L were offered screening for the clinical trial, which included a liver biopsy. Screening was also offered when there were other reasons for NASH to be suspected (e.g., significant liver fibrosis based on liver stiffness measurement, obese patients with metabolic syndrome). Patients who were on insulin therapy were excluded from this study to limit the influence of supra‐physiological results of insulinemia due to insulin therapy.
Demographic, anthropometric and relevant clinical data were obtained using a standard protocol on the day of the liver biopsy procedure. Obesity was defined as body mass index (BMI) ≥25 kg per m2[8]. Central obesity was defined as waist circumference >90 cm for men and >80 cm for women [9]. Hypertension was considered present when there was a self-reported history of hypertension, blood pressure was ≥130/80 mmHg, or when the patient was on anti-hypertensive agent [10]. Venous blood was drawn after an overnight fast on the day of the liver biopsy procedure for complete blood count, glucose, glycated haemoglobin (HbA1c), insulin, lipid profile, liver profile and tests for viral hepatitis B and C infection. Diabetes mellitus was considered present when there was a self-reported history of diabetes mellitus, fasting glucose was ≥7.0 mmol/L, HbA1c was ≥6.5 %, or when the patient was on anti-diabetic agent. Patients without diabetes mellitus who had fasting glucose ≥ 5.6 mmol/L were considered to have impaired fasting glucose [11]. Serum triglyceride ≥1.7 mmol/L was considered elevated while serum high-density lipoprotein (HDL) cholesterol <1.0 mmol/L for men or <1.3 mmol/L for women was considered reduced [12]. Homeostatic model assessment for insulin resistance (HOMA-IR) was calculated using the formula fasting glucose (mmol/L) * fasting insulin (mlU/L) / 22.5.
2.1Calculation of the Hepamet fibrosis score and other fibrosis scoresThe Hepamet fibrosis score was calculated from the formula 1 / (1 + e [5.390 – 0.986 x Age [45-64 years of age] – 1.719 x Age [≥65 years of age] + 0.875 x Male sex – 0.896 x AST [35-69 IU/L] – 2.126 x AST [≥70 IU/L] – 0.027 x Albumin [4-4.49 g/dL] – 0.897 x Albumin [<4 g/dL] – 0.899 x HOMA [2-3.99 with no Diabetes Mellitus] – 1.497 x HOMA [≥4 with no Diabetes Mellitus] – 2.184 x Diabetes Mellitus – 0.882 x platelets x 1.000/µL [155-219] – 2.233 x platelets x 1.000/µL [<155]) [5]. Previously reported cut-offs of <0.12 and ≥0.47 were used for the diagnosis of the absence and presence of advanced liver fibrosis, respectively; a score of ≥0.12 and <0.47 was considered indeterminate. Fibrosis-4 score was calculated from the formula [age (years) × AST (U/L)] / [platelet count (× 109/L) × ALT (U/L)½] [13]. Previously reported cut-offs of <1.30 and ≥2.67 were used for the diagnosis of the absence and presence of advanced liver fibrosis, respectively; a score of ≥1.30 and <2.67 was considered indeterminate. The NAFLD fibrosis score was calculated from the formula −1.675 + 0.037 × age (years) + 0.094 × BMI (kg per m2) + 1.13 × impaired glucose tolerance or diabetes mellitus (yes = 1, no = 0) + 0.99 × AST to ALT ratio − 0.013 × platelet (× 109/L) − 0.66 × albumin (g/dL) [14]. Previously reported cut-offs of <-1.455 and >0.675 were used for the diagnosis of the absence and presence of advanced liver fibrosis, respectively; a score of ≥-1.455 and ≤0.675 was considered indeterminate.
2.2Liver biopsy and histological assessmentUltrasonography‐guided percutaneous liver biopsy was performed by either one of two experienced operators (WKC, SM) using 18G Temno® II semi‐automatic biopsy needle (Cardinal Health, Dublin, OH). Liver biopsy specimens were processed using standard laboratory procedures. Liver biopsy slides were stained with haematoxylin and eosin stain and Masson's trichrome stain. Liver biopsy slides were examined by an experienced histopathologist (NRNM) who was blinded to clinical data. NASH was defined as the presence of steatosis, lobular inflammation and ballooning with or without fibrosis. Histopathological findings were reported according to the NASH Clinical Research Network Scoring System [15]. Fibrosis stages 1a, 1b and 1c were considered stage 1 for the purpose of analysis. Advanced liver fibrosis was defined as fibrosis stages ≥F3. The experienced histopathologist (NRNM) in this study had an almost perfect intra-observer agreement for fibrosis staging with Fleiss' kappa (95% CI) of 0.926 (0.818 - 1.000) as reported in a separate study that looked at intra- and inter-observer variability for fibrosis staging. The inter-observer agreement with the other three pathologists in the study was substantial to almost perfect with weighted kappa (95% CI) of 0.776 (0.601 - 0.950), 0.794 (0.602 - 0.986) and 0.848 (0.692 - 1.000), respectively [16].
2.3Transient elastographyTransient elastography was performed by either one of two experienced operators (WKC, SM) using Fibroscan 502 Touch with M probe (EchoSens, Paris, France) on all patients on the same day of the liver biopsy procedure. Adequate pressure of the probe on the skin surface, good layering on TM mode and a straight imaginary line on A mode were ensured for each measurement. An examination was considered successful and reliable when there were at least 10 valid measurements with interquartile range/median for liver stiffness measurement ≤30% [17]. Liver stiffness measurement <10 kPa and ≥15 kPa were used for the diagnosis of the absence and presence of advanced liver fibrosis, respectively; liver stiffness measurement ≥10 kPa and <15 kPa was considered indeterminate [4]. In the two-step approach, patients with a Hepamet fibrosis score ≥0.12, Fibrosis-4 score ≥1.30, or NAFLD fibrosis score ≥-1.455 were subjected to liver stiffness measurement for the diagnosis of advanced liver fibrosis.
2.4Statistical analysisData were analyzed using standard statistical software, SPSS 27 (IBM, New York, U.S.). Continuous variables were reported as mean ± standard deviation or median (interquartile range) and analyzed using t-test or Mann-Whitney test, as appropriate. Categorical variables were reported as percentages and analyzed using chi-square or Fisher's exact test, as appropriate. The performance of the Hepamet fibrosis score, the Fibrosis-4 score and the NAFLD fibrosis score for the diagnosis of advanced liver fibrosis was determined and compared using the area under the receiver operating characteristics curve (AUROC). AUROC was interpreted as follows: 0.90‐1.00 = excellent, 0.80‐0.90 = good, 0.70‐0.80 = fair and <0.70 = poor. The sensitivity, specificity, positive predictive value, negative predictive value, misclassification rate and indeterminate rate were determined for each of the fibrosis scores when used alone, when used in a two-step approach and when used with liver stiffness measurement for all patients. The Z score calculator for two proportions was used for comparing two proportions. Significance was assumed when p <0.05.
2.5Ethical statementThe clinical trial from which the data for this study came conformed to the ethical guidelines of the 1975 Declaration of Helsinki, and approval was obtained from the University of Malaya Research Ethics Committee (UMREC) prior to its commencement (Approval Date: 25 May 2011; Reference No.: 853.1). All patients who participated in the clinical trial provided written informed consent.
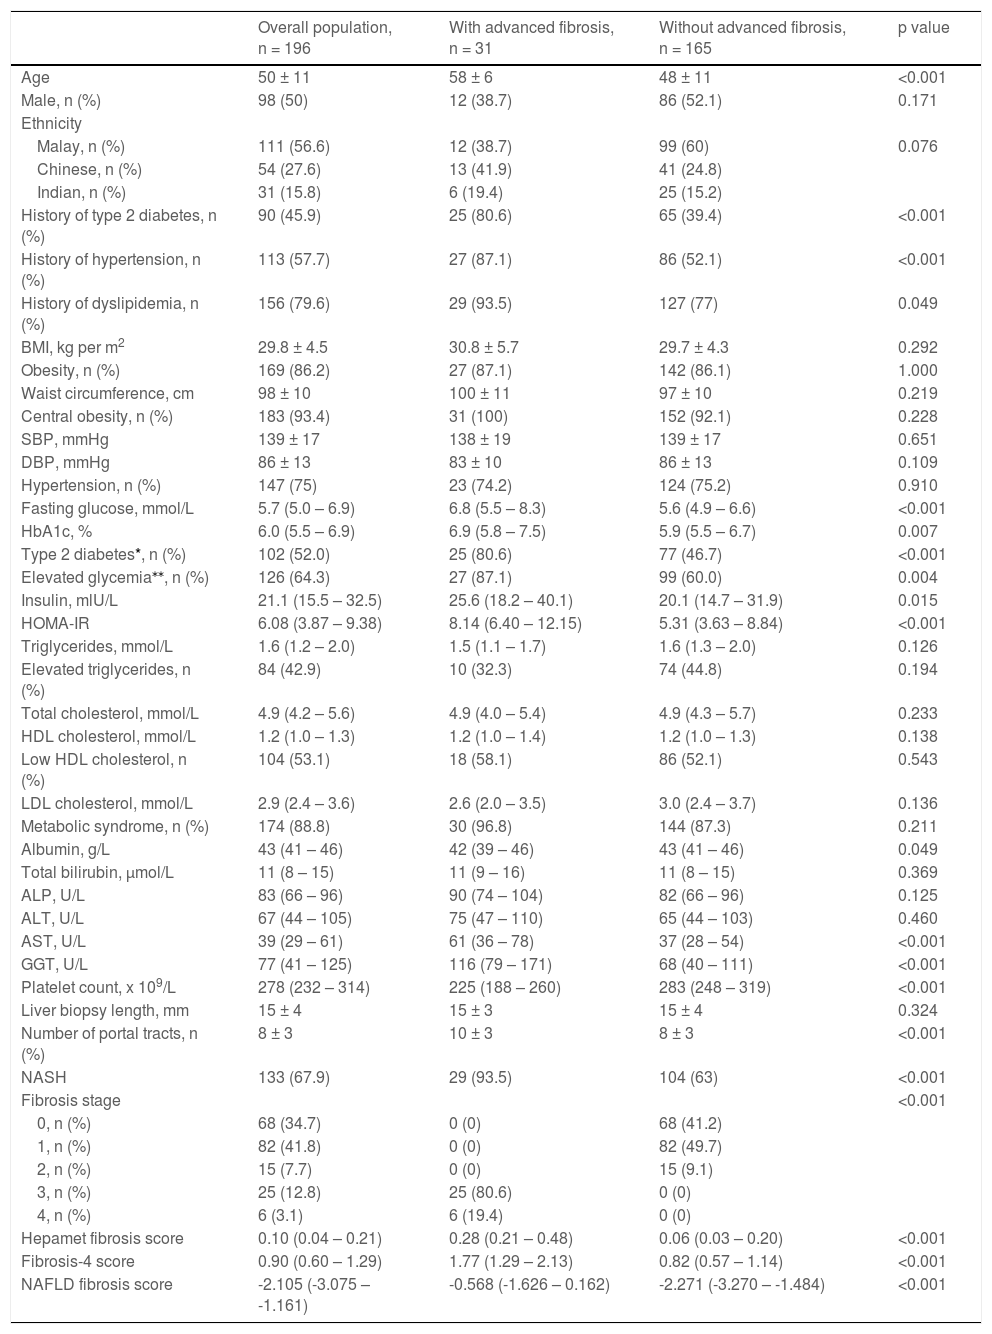
3Results3.1Patient characteristicsThe data for 196 patients were analyzed. Patient characteristics are presented in Table 1. The mean age of the study population was 50 ± 11 years old, and the study population consisted of an equal proportion of male and female patients. The majority of patients were obese (86.2%), centrally obese (93.4%) and had metabolic syndrome (88.8%). The proportion of patients with diabetes mellitus, hypertension and dyslipidemia was 45.9%, 57.7% and 79.6%, respectively. The mean length of the liver biopsy specimen was 15 ± 4 mm, while the mean number of portal tracts was 8 ± 3. The proportion of patients with NASH was 67.9%, while the proportion of patients with advanced liver fibrosis was 15.8%.
Patient characteristics.
| Overall population, n = 196 | With advanced fibrosis, n = 31 | Without advanced fibrosis, n = 165 | p value | |
|---|---|---|---|---|
| Age | 50 ± 11 | 58 ± 6 | 48 ± 11 | <0.001 |
| Male, n (%) | 98 (50) | 12 (38.7) | 86 (52.1) | 0.171 |
| Ethnicity | ||||
| Malay, n (%) | 111 (56.6) | 12 (38.7) | 99 (60) | 0.076 |
| Chinese, n (%) | 54 (27.6) | 13 (41.9) | 41 (24.8) | |
| Indian, n (%) | 31 (15.8) | 6 (19.4) | 25 (15.2) | |
| History of type 2 diabetes, n (%) | 90 (45.9) | 25 (80.6) | 65 (39.4) | <0.001 |
| History of hypertension, n (%) | 113 (57.7) | 27 (87.1) | 86 (52.1) | <0.001 |
| History of dyslipidemia, n (%) | 156 (79.6) | 29 (93.5) | 127 (77) | 0.049 |
| BMI, kg per m2 | 29.8 ± 4.5 | 30.8 ± 5.7 | 29.7 ± 4.3 | 0.292 |
| Obesity, n (%) | 169 (86.2) | 27 (87.1) | 142 (86.1) | 1.000 |
| Waist circumference, cm | 98 ± 10 | 100 ± 11 | 97 ± 10 | 0.219 |
| Central obesity, n (%) | 183 (93.4) | 31 (100) | 152 (92.1) | 0.228 |
| SBP, mmHg | 139 ± 17 | 138 ± 19 | 139 ± 17 | 0.651 |
| DBP, mmHg | 86 ± 13 | 83 ± 10 | 86 ± 13 | 0.109 |
| Hypertension, n (%) | 147 (75) | 23 (74.2) | 124 (75.2) | 0.910 |
| Fasting glucose, mmol/L | 5.7 (5.0 – 6.9) | 6.8 (5.5 – 8.3) | 5.6 (4.9 – 6.6) | <0.001 |
| HbA1c, % | 6.0 (5.5 – 6.9) | 6.9 (5.8 – 7.5) | 5.9 (5.5 – 6.7) | 0.007 |
| Type 2 diabetes*, n (%) | 102 (52.0) | 25 (80.6) | 77 (46.7) | <0.001 |
| Elevated glycemia⁎⁎, n (%) | 126 (64.3) | 27 (87.1) | 99 (60.0) | 0.004 |
| Insulin, mlU/L | 21.1 (15.5 – 32.5) | 25.6 (18.2 – 40.1) | 20.1 (14.7 – 31.9) | 0.015 |
| HOMA-IR | 6.08 (3.87 – 9.38) | 8.14 (6.40 – 12.15) | 5.31 (3.63 – 8.84) | <0.001 |
| Triglycerides, mmol/L | 1.6 (1.2 – 2.0) | 1.5 (1.1 – 1.7) | 1.6 (1.3 – 2.0) | 0.126 |
| Elevated triglycerides, n (%) | 84 (42.9) | 10 (32.3) | 74 (44.8) | 0.194 |
| Total cholesterol, mmol/L | 4.9 (4.2 – 5.6) | 4.9 (4.0 – 5.4) | 4.9 (4.3 – 5.7) | 0.233 |
| HDL cholesterol, mmol/L | 1.2 (1.0 – 1.3) | 1.2 (1.0 – 1.4) | 1.2 (1.0 – 1.3) | 0.138 |
| Low HDL cholesterol, n (%) | 104 (53.1) | 18 (58.1) | 86 (52.1) | 0.543 |
| LDL cholesterol, mmol/L | 2.9 (2.4 – 3.6) | 2.6 (2.0 – 3.5) | 3.0 (2.4 – 3.7) | 0.136 |
| Metabolic syndrome, n (%) | 174 (88.8) | 30 (96.8) | 144 (87.3) | 0.211 |
| Albumin, g/L | 43 (41 – 46) | 42 (39 – 46) | 43 (41 – 46) | 0.049 |
| Total bilirubin, µmol/L | 11 (8 – 15) | 11 (9 – 16) | 11 (8 – 15) | 0.369 |
| ALP, U/L | 83 (66 – 96) | 90 (74 – 104) | 82 (66 – 96) | 0.125 |
| ALT, U/L | 67 (44 – 105) | 75 (47 – 110) | 65 (44 – 103) | 0.460 |
| AST, U/L | 39 (29 – 61) | 61 (36 – 78) | 37 (28 – 54) | <0.001 |
| GGT, U/L | 77 (41 – 125) | 116 (79 – 171) | 68 (40 – 111) | <0.001 |
| Platelet count, x 109/L | 278 (232 – 314) | 225 (188 – 260) | 283 (248 – 319) | <0.001 |
| Liver biopsy length, mm | 15 ± 4 | 15 ± 3 | 15 ± 4 | 0.324 |
| Number of portal tracts, n (%) | 8 ± 3 | 10 ± 3 | 8 ± 3 | <0.001 |
| NASH | 133 (67.9) | 29 (93.5) | 104 (63) | <0.001 |
| Fibrosis stage | <0.001 | |||
| 0, n (%) | 68 (34.7) | 0 (0) | 68 (41.2) | |
| 1, n (%) | 82 (41.8) | 0 (0) | 82 (49.7) | |
| 2, n (%) | 15 (7.7) | 0 (0) | 15 (9.1) | |
| 3, n (%) | 25 (12.8) | 25 (80.6) | 0 (0) | |
| 4, n (%) | 6 (3.1) | 6 (19.4) | 0 (0) | |
| Hepamet fibrosis score | 0.10 (0.04 – 0.21) | 0.28 (0.21 – 0.48) | 0.06 (0.03 – 0.20) | <0.001 |
| Fibrosis-4 score | 0.90 (0.60 – 1.29) | 1.77 (1.29 – 2.13) | 0.82 (0.57 – 1.14) | <0.001 |
| NAFLD fibrosis score | -2.105 (-3.075 – -1.161) | -0.568 (-1.626 – 0.162) | -2.271 (-3.270 – -1.484) | <0.001 |
Type 2 diabetes was considered present when there was a self-reported history of type 2 diabetes, fasting glucose was ≥7.0mmol/L, HbA1c was ≥6.5 %, or when the patient was on anti-diabetic agent.
Elevated glycemia includes patients with impaired fasting glucose (fasting glucose ≥5.6 mmol/L) and patients with type 2 diabetes
BMI, body mass index; HbA1c, glycated hemoglobin; HDL, high-density lipoprotein; LDL, low-density lipoprotein; ALP, alkaline phosphatase; ALT, alanine aminotransferase; AST, aspartate aminotransferase; GGT, gamma glutamyl transferase; NASH, non-alcoholic steatohepatitis; NAFLD, non-alcoholic fatty liver disease.
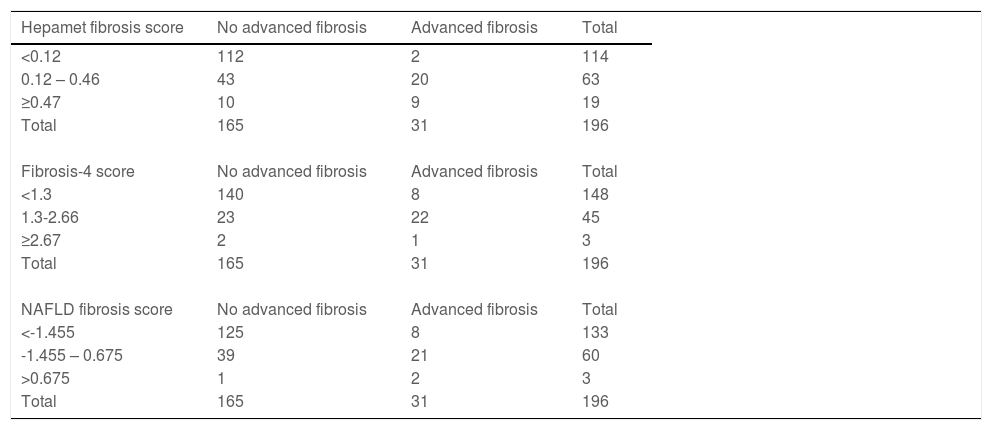
The Hepamet fibrosis score was significantly higher among patients with advanced liver fibrosis compared with patients without advanced liver fibrosis [0.35 (0.21 – 0.48) vs. 0.13 (0.03 – 0.20), p <0.001]. The Hepamet fibrosis score had good diagnostic accuracy for advanced liver fibrosis with AUROC of 0.85 (95% CI, 0.80 – 0.91) (Fig. 1). The distribution of patients in the different diagnostic groups using the Hepamet fibrosis score, the Fibrosis-4 score and the NAFLD fibrosis score are shown in Table 2. The Hepamet fibrosis score had a sensitivity, specificity, positive predictive value and negative predictive value of 81.8%, 91.8%, 47.4% and 98.2%, respectively. The proportion of patients in the indeterminate range was 32.1%. The misclassification rate was 6.1%. The proportion of patients with low Hepamet fibrosis score who had advanced liver fibrosis was 1.8%, while the proportion of patients with high Hepamet fibrosis score who did not have advanced liver fibrosis was 52.6%.

The distribution of patients in the different diagnostic groups using the Hepamet fibrosis score, the Fibrosis-4 score and the NAFLD fibrosis score.
The Hepamet fibrosis score did not perform better than the Fibrosis-4 score or the NAFLD fibrosis score for the diagnosis of advanced liver fibrosis, with the AUROC of the Fibrosis-4 score and the NAFLD fibrosis score being 0.89 (95% CI, 0.83 – 0.95, p = 0.223) and 0.85 (95% CI, 0.79 – 0.92, p = 0.946), respectively (Fig. 1). The proportion of patients in the indeterminate range was lower for the Fibrosis-4 score compared with the Hepamet fibrosis score (23% vs. 32.1%, p <0.05). The proportion of patients in the indeterminate range was not significantly different between the NAFLD fibrosis score and the Hepamet fibrosis score (26% vs. 32.1%, p = 0.184). The misclassification rates for the Fibrosis-4 score (5.1%) and the NAFLD fibrosis score (4.6%) were not significantly different from the Hepamet fibrosis score (6.1%) (p = 0.660 and p = 0.503, respectively). However, the sensitivity of the Hepamet fibrosis score (81.8%) was significantly higher compared with the Fibrosis-4 score (11.1%) and the NAFLD fibrosis score (20%) (p <0.05 for both comparisons). The proportion of patients with low Fibrosis-4 scores who had advanced liver fibrosis was 5.4%, while the proportion of patients with high Fibrosis-4 scores who did not have advanced liver fibrosis was 66.7%. These values were 5.6% and 33.3%, respectively, for the NAFLD fibrosis score.
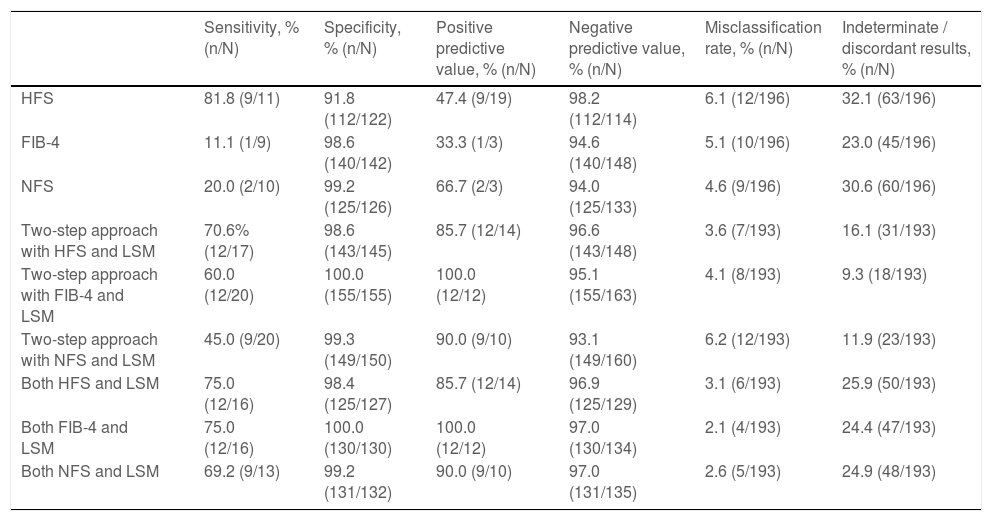
3.4Combining the Hepamet fibrosis score and liver stiffness measurement for assessment of advanced liver fibrosisThree of the 196 patients were excluded from this analysis due to failed or unreliable liver stiffness measurement. Using the two-step approach reduced the proportion of patients with indeterminate results (from 32.1% to 16.1%) and the misclassification rate (from 6.1% to 3.6%) (Table 3 and Fig. 2). Using the Fibrosis-4 score and the NAFLD fibrosis score to select patients for liver stiffness measurement similarly reduced the proportion of patients with indeterminate results (from 23% to 9.3% for the Fibrosis-4 score and from 30.6% to 11.9% for the NAFLD fibrosis score) and the misclassification rate for the Fibrosis-4 score (from 5.1% to 4.1%), but not for the NAFLD fibrosis score (from 4.6% to 6.2%) (Table 3, Supplementary Fig. S1, and Supplementary Fig. S2). In contrast, using both Hepamet fibrosis score and liver stiffness measurement in all patients resulted in a greater proportion of patients with indeterminate results (25.9%) due to discordant results among those with low Hepamet fibrosis scores (Table 3 and Fig. 3). This was similarly observed for the Fibrosis-4 score and the NAFLD fibrosis score, with indeterminate results at 24.4% and 24.9%, respectively (Table 3, Supplementary Fig. S3 and Supplementary Fig. S4).
Sensitivity, specificity, positive predictive value, negative predictive value, misclassification rate and proportion of patients with indeterminate / discordants results when using the Hepamet fibrosis score, Fibrosis-4 score and NAFLD fibrosis score alone, or in combination with liver stiffness measurement in a two-step approach or both tests for all patients.
HFS, Hepamet fibrosis score; FIB-4, Fibrosis-4 score; NFS, NAFLD fibrosis score; LSM, liver stiffness measurement.


In this study on 196 patients with biopsy-proven NAFLD, we found the Hepamet fibrosis score to have good accuracy for the diagnosis of advanced liver fibrosis. This is consistent with the original training and validation study by Ampuero and colleagues [5]. However, in contrast, the Hepamet fibrosis score was not found to be superior to the Fibrosis-4 score and the NAFLD fibrosis score in our study. Although the Hepamet fibrosis score had significantly higher AUROC compared with the Fibrosis-4 score and the NAFLD fibrosis score in both the training and validation cohorts in the study by Ampuero and colleagues, there was significant overlap in the 95% CI of the AUROCs of the different fibrosis scores from each of the participating centres. In the only other external validation study, Higuera‑de‑la‑Tijera and colleagues similarly did not find a significant difference in the accuracy of the Hepamet fibrosis score for the diagnosis of advanced liver fibrosis compared with the Fibrosis-4 score and the NAFLD fibrosis [18]. The magnitude of difference in the performance of the Hepamet fibrosis score for the diagnosis of advanced liver fibrosis compared with other fibrosis scores is an important consideration because it requires HOMA, which is not routinely performed and requires additional cost, in its calculation. A similar consideration has favored the Fibrosis-4 score over the NAFLD fibrosis score for the diagnosis of advanced liver fibrosis as the former requires a smaller number of variables that are more readily available and performs as well as, if not better, compared with the latter [4]. In a previous study, we found the MACK-3 [combination of HOMA, AST and cytokeratin-18 (CK18)] to be a marker of active NASH and hypothesized that it would perform better as a marker of fibrotic NASH in populations with a greater proportion of patients with both active NASH and significant liver fibrosis [19]. This may similarly underlie the difference in the performance of the Hepamet fibrosis score in the different study populations, which have a different proportion of patients with both active NASH and advanced liver fibrosis. Another possible explanation is an ethnic difference in HOMA [20], as our study population consisted of 72.4% of patients of Malay or Indian ethnicity, which are completely unrepresented in both earlier studies.
The high negative predictive value of the lower cut-off of fibrosis scores has positioned them as an important screening tool since there is a high prevalence of NAFLD in the general population but only a small yet significant proportion of patients with advanced liver fibrosis. However, the low positive predictive value of the lower cut-off necessitates additional tests, such as liver stiffness measurement, to improve the diagnosis of advanced liver fibrosis. While this approach has been tested with the Fibrosis-4 score and the NAFLD fibrosis score previously [3,4], it has not been tested for the Hepamet fibrosis score. In the current study, we found the use of the Hepamet fibrosis score in a two-step approach with liver stiffness measurement to be feasible, similar to the Fibrosis-4 score and the NAFLD fibrosis score. Although the use of the Hepamet fibrosis score in the two-step approach was associated with the highest proportion of patients with indeterminate results at 16.1%, it had the lowest misclassification rate at 3.6%. A lower misclassification rate may be arguably more important than the proportion of indeterminate results (within acceptable limits) as patients with indeterminate results may be considered as having increased risk and be followed, whereby those with disease progression over time would be eventually diagnosed. On the other hand, misclassification may lead to a false sense of security and missed opportunity for intervention on one end and anxiety and unnecessary downstream management on the other.
Despite our best effort, this study has several limitations. First, the use of liver biopsy as a reference test is inherently limited by sampling variability [21] and observer variability [16,22]. The fibrosis stage has been shown to differ by 1-2 stages between two liver biopsies taken from the same patient in 45.1% of cases [21]. On the other hand, there is only moderate agreement in fibrosis staging between two independent pathologists, with a discrepancy rate of 68.7% [22]. The discrepancy rate in fibrosis staging was 40.8% in another study that included four independent pathologists [16]. Nevertheless, liver biopsy remains the reference test for the evaluation of a diagnostic test for liver fibrosis. Although none of the liver biopsy specimens were deemed inadequate for assessment by our pathologist, the mean length of the liver biopsy specimen and the number of portal tracts in our study did fall short of the recommended international standards, which may have affected the interpretation of diagnostic accuracy in our study [23]. Secondly, the patients included in this study, as in most studies on a diagnostic test for NAFLD, were NAFLD patients in a tertiary centre who underwent a liver biopsy. Therefore, the patients are likely to have more severe liver disease and the findings of this study may not be representative of NAFLD patients in the general population. However, it is likely that the fibrosis scores will have even better negative predictive value for advanced liver fibrosis for NAFLD patients in the general population. Lastly, the term metabolic dysfunction-associated fatty liver disease (MAFLD) was not yet introduced at the time data for this study was collected and has therefore not been included. However, all patients in this study fulfilled the criteria for MAFLD.
5ConclusionsIn conclusion, our study provides further external validation of the good diagnostic performance of the Hepamet fibrosis score in a population that was largely unrepresented in earlier work. Although the Hepamet fibrosis score was not found to be better than the Fibrosis-4 score and the NAFLD fibrosis score, we demonstrated its high negative predictive value and utility in a two-step approach with liver stiffness measurement for the diagnosis of advanced liver fibrosis. Furthermore, the Hepamet fibrosis score had the lowest misclassification rate when used in a two-step approach with liver stiffness measurement compared with the Fibrosis-4 score and the NAFLD fibrosis score.
Author contributionsWKC conceptualized the study. KHC, PS, NRNM, SM and WKC contributed to the data. SEC and FC performed data analysis and drafted the manuscript. All authors reviewed the draft manuscript, contributed to important intellectual content, and approved the final manuscript.
Data availability statementData of this study will be available to all investigators of this study. Data sharing to colleagues outside the study group may be considered upon reasonable request and has to be approved by all investigators of this study.
Declaration of interestWKC has served as a consultant for Abbvie, Boehringer Ingelheim and Novo Nordisk; and a speaker for Viatris and Hisky Medical. The other authors have no conflict of interest to declare.


