


Introduction and aims. The association between thyroid function and non-alcoholic fatty liver disease (NAFLD) remained controversial. A large cross-sectional study aimed to explore the relationship in euthyroid population.
Material and methods. A total of 1773 euthyroid subjects who underwent health check-up during one-year period were enrolled. NAFLD was diagnosed by ultrasound and fatty liver index (FLI). Fibrosis was estimated by BARD score. Thyroid function parameters, including thyroid-stimulating hormone (TSH), free triiodothyronine (FT3), and free thyroxine (FT4), were recorded. Multivariate logistic regression analyses were performed to identify the independent risk factors. Odds ratios (ORs) with 95% confidence intervals (CIs) were calculated.
Results. NAFLD was diagnosed by ultrasound in 638 (35.98%) subjects and by FLI ≥ 60 in 694 (39.14%) subjects. Regardless of ultrasound or FLI, the overall analysis demonstrated that TSH and FT3 levels were significantly higher in subjects with NAFLD than subjects without NAFLD, but FT4 level was not significantly different between them. This association remained in middle-age subjects, but not elderly subjects. In the multivariate logistic regression analysis, TSH (OR = 1.108, 95%CI = 1.056-1.398, P = 0.024) and FT3 (OR = 1.258, 95%CI = 1.123-1.409, P = 0.000) levels were independently associated with the risk of NAFLD diagnosed by ultrasound; and only FT3 level (OR = 1.252, 95%CI = 1.074 - 1.460, P = 0.004) was independently associated with the risk of NAFLD estimated by FLI ≥ 60. Additionally, FT3 level (OR = 1.178, 95%CI = 1.025 − 1.354, P = 0.021) was independently associated with the risk of fibrosis estimated by BARD score ≥ 2 in NAFLD subjects.
Conclusion. Among the euthyroid population, FT3 and TSH levels were positively associated with the risk of NAFLD.
Non-alcoholic fatty liver disease (NAFLD) is characterized as hepatic steatosis in the absence of significant alcohol use, which will evolve to non-alcoholic steatohepatitis (NASH), liver fibrosis, and cirrhosis.1,2 In this world, the prevalence of NAFLD diagnosed by imaging in the general population is about 25%,3 despite the data from direct assessment of NAFLD by biopsy is rarely available. The incidence of NAFLD seems to be higher in Asian countries than in Western countries (52.34 vs. 28 per 1,000 person-years).3 According to the recommendations from recently updated American Association for the Study of Liver Diseases (AASLD) practice guidance and Asia-Pacific Working Party,1,2 metabolic syndrome and its components (i.e., obesity, type 2 diabetes, arterial hypertension, and dyslipidemia) are established risk factors for NAFLD, and sleep apnea, colorectal cancer, pancreato-duodenal resection, osteoporosis, psoriasis, and endocrinopathies (i.e., hypothyroidism, hypopituitarism, hypogonadism, and polycystic ovary syndrome) are emerging risk factors.
Nowadays, there is an increasing knowledge regarding association between thyroid function and risk of NAFLD, because thyroid dysfunction is associated with weight gain and occurrence of insulin resistance and lipid metabolism disorders. Until now, two large population-based studies from the Netherlands supports that free thyroxine (FT4) levels are inversely associated with risk of NAFLD. A population-based study, which was based on the Rotterdam study and involved 9,419 individuals, demonstrated that the risk of developing NAFLD was significantly higher in individuals with subclinical and clinical hypothyroidism than in those with euthyroidism.4 In this study, subclinical and clinical hypothyroidisms were characterized as increased thyroid-stimulating hormone (TSH) with normal and increased FT4 levels, respectively. Another population-based study, which was based on the Lifelines cohort study and involved 20,289 individuals, found that higher free triiodothyronine (FT3) and lower FT4 levels were significantly associated with higher risk of NAFLD in individuals with euthyroidism.5 Notably, the Fatty Liver Index, which was an indirect diagnostic criterion for NAFLD with a moderate diagnostic accuracy, was employed in both of the two large studies. Thus, their findings should be further validated.
On the other hand, according to the available evidence, the association of thyroid function parameters with risk of NAFLD in euthyroid subjects remains controversial. Xu, et al. conducted a cross-sectional study in 878 elderly (age ≥ 65 years) subjects with euthyroidism, of whom all were retried employees from a company in Ningbo, China.6 In line with the findings from the Lifelines cohort study, the researchers found that subjects with NAFLD had significantly lower FT4 levels and higher TSH levels than subjects without. However, the FT3 levels were statistically similar between the two groups. Similarly, Tao, et al. enrolled 739 subjects with euthyroidism and confirmed the Xu’s findings.7 Liu, et al. also performed a cross-sectional study in 3,506 middle-age (age 36–60 years) subjects with euthyroidism, of whom all underwent health check-up in Jinan, China.8 In contrast with the above-mentioned findings, the researchers found that subjects with NAFLD had significantly higher FT3 levels than subjects without. However, the FT4 and TSH levels were similar between the two groups. The accurate reasons why the findings were opposite among these Chinese studies are lacking.
Based on this background, a cross-sectional study was performed to evaluate the relationship between NAFLD and thyroid function parameters in a euthyroid general population and to further explore this relationship according to the different age groups.
Material and MethodsStudy designThis is a cross-sectional study. The study was approved by the Ethical Committee of the First Affiliated
Hospital of China Medical University. Inclusion criteria were as follows:
- •
Subjects who visited the Physical Examination Center at the First Affiliated Hospital of China Medical University for a health check-up between January 2015 and December 2015.
- •
Subjects who underwent thyroid function tests.
- •
Subjects with euthyroidism.
Exclusion criteria were as follows:
- •
Excessive alcohol consumption > 20 g/day.
- •
A history of hepatitis B or C virus infection.
- •
Autoimmune hepatitis.
- •
Other liver diseases.
- •
Taking any hepatotoxic or thyroid medications.
After an overnight fast period, each subject went through a complete health check-up in the early morning. The examination included a health habit questionnaire, anthropometric measurements and laboratory tests. Height and weight were measured using an autoanthropometer without shoes or outerwear. The body mass index (BMI, kg/m2) was calculated as weight (kg) divided by the square of height (m2). Waist circumference (WC) was measured with a calibrated tape positioned midcourt line between the lower costal margin and the iliac crest while the patient breathed smoothly. Blood pressure of the right arm was measured twice using an electronic sphygmomanometer, with participants resting at least 5 min and then in a sitting posture. The two measurements for each subject were acquired 3-min interval, and the average value was figured up as systolic blood pressure (SBP) and diastolic blood pressure (DBP).
Fasting whole venous blood specimens were obtained to measure the biochemical parameters of alanine ami-notransferase (ALT), aspartate aminotransferase (AST), alkaline phosphatase (ALP), γ-glutamyltransferase (GGT), triglyceride (TG), total cholesterol (TC), high-density lipoprotein cholesterol (HDL-C), low-density lipoprotein cholesterol (LDL-C), serum creatinine (Cr), blood urea nitrogen (BUN), and fasting plasma glucose (FPG). All values were measured by standard methods using a Hitachi Cobas 8000 autoanalyzer.
Serum FT3 and FT4 levels were assessed by a luminescence enzyme immunoassay (Beckman Coulter, Fullerton, CA). Serum TSH levels were assessed by a sensitive third-generation immunochemiluminescent assay (Beckman Coulter, Fullerton, CA). The intra-assay coefficients of variation (CV) for FT3, FT4 and TSH were 6.1%, 5.6% and 5.1%, respectively; and the corresponding inter-assay CV were 3.7%, 2.8% and 3.1%, respectively. Euthyroidism was defined as FT3, FT4 and thyroid-stimulating hormone (TSH) level in the normal range (2.63-5.70 pmol/L for FT3, 9.01–19.05 pmol/L for FT4, and 0.35-4.94 mIU/L for TSH).
Evaluation of NAFLDNAFLD was diagnosed on the basis of the results of hepatic ultrasonography using a Siemens Acuson X300 machine with a 3.5-MHz probe (Siemens, Erlangen, Germany). Hepatic ultrasound was operated by experienced physicians who were blinded to the clinical and laboratory data. Adiposis hepatica was diagnosed based on the characteristic echo patterns, as suggested by the Chinese National Consensus Workshop on NAFLD. Diagnosis of NAFLD was established after excluding excessive alcohol intake (> 20 g/day) or other causes of liver diseases, for instance, viral or autoimmune hepatitis, drug-induced liver diseases.
Fatty liver index (FLI) is a simple and accurate tool for non-invasive diagnosis of NAFLD, which is developed by Bedogni, et al.9 and externally validated by Koehler, et al.10 In the present study, we also estimated the diagnosis of NAFLD by FLI. BARD score is a readily available tool for excluding the presence of advanced fibrosis in NAFLD subjects, which is developed and validated by Harrison, et al.11
Statistical analysesAll the statistical analyses were conducted using SPSS software (SPSS Inc., Chicago, IL, USA) in version 17.0. Continuous variables were represented as mean ± standard deviation or median with interquartile range (IQR) depending on whether continuous data were normally distributed. For comparisons of continuous data, independent t-test or Mann-Whitney U-test was used. Chi-squared test was used for comparisons of categorical variables. Spearman rank correlation analysis was conducted to evaluate the correlation between serum thyroid hormone levels and other parameters. Multiple logistic regression analysis was performed to discern the independent risk factors relating to NAFLD diagnosed by ultrasound and FLI and significant fibrosis diagnosed by BARD score. Odds ratios (ORs) with 95% confidence intervals (95%CIs) were calculated. Subgroup analyses were performed according to the different age groups (middle age: 36–60 years; elderly age: > 60 years). A two-tailed value of P < 0.05 was considered statistically significant.
ResultsPatientsIn total, 1773 subjects were included. Among them, 638 (35.98%) had NAFLD. The mean age was 49.82 ± 10.31 years and 41.51% was male.
Comparison between subjects with and without NAFLD- •
Overall subjects. Subjects with NAFLD had significantly higher age, BMI, WC, SBP, DBP, FPG, TG, TC, LDL-C, ALT, AST, ALP, GGT, BUN, Cr, TSH, and FT3 and a significantly lower HDL-C (Table 1). However, the FT4 was not significantly different between subjects with and without NAFLD.
Table 1.Overall comparison between subjects with and without NAFLD diagnosed by ultrasound.
Variables Subjects with NAFLD (n = 638) Subjects without NAFLD (n = 1,135) P value Age (years) 50.42 ± 8.90 49.30 ± 11.36 0.023 Gender (male, n %) 268 (42.01%) 466 (41.06%) 0.697 Body mass index (kg/m2) 27.60 ± 3.12 24.12 ± 2.94 0.000 Waist circumference (cm) 88.99 ± 8.18 78.95 ± 8.36 0.000 Systolic blood pressure (mmHg) 132.16 ± 18.62 122.45 ± 18.74 0.000 Diastolic blood pressure (mmHg) 80.83 ± 11.63 74.53 ± 11.80 0.000 Fasting plasma glucose (mmol/L) 5.90 ± 1.73 5.32 ± 0.90 0.000 Triglyceride (mmol/L) 2.34 ± 1.77 1.28 ± 0.90 0.000 Total cholesterol (mmol/L) 5.12 ± 0.95 4.90 ± 0.95 0.000 High-density lipoprotein cholesterol (mmol/L) 1.15 ± 0.29 1.39 ± 0.34 0.000 Low-density lipoprotein cholesterol (mmol/L) 3.32 ± 0.85 3.13 ± 0.85 0.000 Alanine aminotransferase (U/L) 24.0 (17.0 - 34.0) 16.0 (12.0 - 22.0) 0.000 Aspartate aminotransferase (U/L) 20.0 (16.0 - 24.0) 18.0 (15.0 - 22.0) 0.000 Alkaline phosphatase (U/L) 70.0 (59.0 - 81.0) 63.0 (52.0 - 75.0) 0.000 γ-glutamyltransferase (U/L) 33.0 (23.0 - 50.0) 19.0 (13.0 - 27.0) 0.000 Blood urea nitrogen (mmol/L) 5.25 ± 1.25 5.11 ± 1.28 0.025 Serum creatinine (imol/L) 67.84 ± 12.90 61.93 ± 15.23 0.000 Thyroid-stimulating hormone (mlU/L) 1.67 (1.17 - 2.36) 1.58 (1.08 - 2.30) 0.019 Free triiodothyronine (pmol/L) 4.63 (4.23 - 4.98) 4.43 (4.08 - 4.80) 0.000 Free thyroxine levels (pmol/L) 12.79 (11.90 - 13.70) 12.71 (11.70 - 13.70) 0.121 Data are presented as means ± SD, median (IQR) or percentages.
We also compared the difference between subjects with and without NAFLD estimated according to FLI. Statistical results remained (Table 2). TSH and FT3, rather than FT4, was significantly associated with NAFLD estimated by FLI ≥ 60.
Table 2.Overall comparison between subjects with and without NAFLD estimated by FLI = 60.
Variables FLI ≥ 60 (n = 694) FLI < 60 (n = 1,079) P value Age (years) 50.33 ± 8.98 49.32 ± 11.44 0.038 Gender (male, n %) 298 (42.94%) 436 (40.41%) 0.291 Body mass index (kg/m2) 27.64 ± 3.08 23.79 ± 2.72 0 Waist circumference (cm) 89.17 ± 7.80 77.94 ± 7.76 0 Systolic blood pressure (mmHg) 132.15 ± 18.55 121.66 ± 18.60 0 Diastolic blood pressure (mmHg) 80.90 ± 11.72 73.92 ± 11.52 0 Fasting plasma glucose (mmol/L) 5.87 ± 1.68 5.30 ± 0.90 0 Triglyceride (mmol/L) 2.35 ± 1.65 1.18 ± 0.95 0 Total cholesterol (mmol/L) 5.12 ± 0.93 4.87 ± 0.96 0 High-density lipoprotein cholesterol (mmol/L) 1.15 ± 0.28 1.42 ± 0.34 0 Low-density lipoprotein cholesterol (mmol/L) 3.31 ± 0.83 3.11 ± 0.87 0 Alanine aminotransferase (U/L) 24.0 (17.0 - 34.0) 15.0 (12.0 - 22.0) 0 Aspartate aminotransferase (U/L) 20.0 (16.0 - 24.0) 18.0 (15.0 - 21.0) 0 Alkaline phosphatase (U/L) 70.0 (59.0 - 81.0) 63.0 (52.0 - 75.0) 0 γ-glutamyltransferase (U/L) 34.0 (24.0 - 53.0) 18.0 (13.0 - 25.0) 0 Blood urea nitrogen (mmol/L) 5.27 ± 1.24 5.08 ± 1.29 0.001 Serum creatinine (imol/L) 68.38 ± 12.87 60.89 ± 15.09 0 Thyroid-stimulating hormone (mlU/L) 1.66 (1.16 - 2.37) 1.59 (1.09 - 2.30) 0 Free triiodothyronine (pmol/L) 4.63 (4.21 - 4.98) 4.42(4.07 - 4.78) 0.002 Free thyroxine levels (pmol/L) 12.78 (11.90 - 13.63) 12.71 (11.65 - 13.73) 0.13 Data are presented as means ± SD, median (IQR) or percentages.
- •
Middle-age subjects. Middle-age subjects with NAFLD had significantly higher age, BMI, WC, SBP, DBP, FPG, TG, TC, LDL-C, ALT, AST, ALP, GGT, Cr, TSH, and FT3 and a significantly lower HDL-C (Table 3). However, the FT4 was not significantly different between middle-age subjects with and without NAFLD.
Table 3.Comparison between middle-aged subjects with and without NAFLD diagnosed by ultrasound.
Variables Subjects with NAFLD (n = 488) Subjects without NAFLD (n = 875) P value Age (years) 49.21 ± 5.66 47.72 ± 6.54 0 Gender (male, n %) 228 (46.72%) 366 (41.83%) 0.081 Body mass index (kg/m2) 27.54 ± 3.05 24.17 ± 2.92 0 Waist circumference (cm) 89.60 ± 8.18 79.02 ± 8.31 0 Systolic blood pressure (mmHg) 131.17 ± 18.42 121.30 ± 17.42 0 Diastolic blood pressure (mmHg) 80.95 ± 11.57 74.65 ± 11.62 0 Fasting plasma glucose (mmol/L) 5.88 ± 1.70 5.30 ± 0.87 0 Triglyceride (mmol/L) 2.35 ± 1.73 1.32 ± 0.96 0 Total cholesterol (mmol/L) 5.13 ± 0.94 4.90 ± 0.90 0 High-density lipoprotein cholesterol (mmol/L) 1.15 ± 0.29 1.38 ± 0.33 0 Low-density lipoprotein cholesterol (mmol/L) 3.33 ± 0.84 3.14 ± 0.81 0 Alanine aminotransferase (U/L) 25.0 (18.0-34.5) 16.0 (12.0-23.0) 0 Aspartate aminotransferase (U/L) 20.0 (16.0-24.0) 18.0 (15.0-21.0) 0 Alkaline phosphatase (U/L) 70.0 (59.0-81.0) 62.0 (52.0-74.0) 0 γ-glutamyltransferase (U/L) 34.0 (24.0-52.0) 19.0 (14.0-30.0) 0 Blood urea nitrogen (mmol/L) 5.20 ± 1.15 5.10 ± 1.21 0.115 Serum creatinine (imol/L) 68.47 ± 12.49 61.29 ± 12.45 0 Thyroid-stimulating hormone (mIU/L) 1.68 (1.18-2.34) 1.58 (1.09-2.30) 0.047 Free triiodothyronine (pmol/L) 4.65 (4.25-5.00) 4.44 (4.11-4.82) 0 Free thyroxine levels (pmol/L) 12.76 (11.87-13.70) 12.69 (11.59-13.63) 0.146 Data are presented as means±SD or median (IQR) or percentages.
- •
Elderly subjects. Elderly subjects with NAFLD had significantly higher age, BMI, WC, SBP, FPG, TG, ALT, GGT, and Cr and a significantly lower HDLC (Table 4). However, the TSH, FT3, and FT4 were not significantly different between elderly subjects with and without NAFLD.
Table 4.Comparison between elderly subjects with and without NAFLD diagnosed by ultrasound.
Variables Subjects with NAFLD (n = 121) Subjects without NAFLD (n = 206) P value Age (years) 68.06 ± 6.34 66.08 ± 5.84 0.014 Gender (male, n %) 32 (26.45%) 74 (35.92%) 0.077 Body mass index (kg/m2) 27.84 ± 3.19 24.84 ± 2.66 0 Waist circumference (cm) 89.62 ± 7.71 81.97 ± 7.51 0 Systolic blood pressure (mmHg) 141.34 ± 18.01 135.58 ± 20.43 0.024 Diastolic blood pressure (mmHg) 81.49 ± 12.10 78.71 ± 11.69 0.072 Fasting plasma glucose (mmol/L) 6.23 ± 1.80 5.68 ± 1.01 0.002 Triglyceride (mmol/L) 2.17 ± 1.83 1.30 ± 0.71 0 Total cholesterol (mmol/L) 5.12 ± 1.02 5.11 ± 1.21 0.984 High-density lipoprotein cholesterol (mmol/L) 1.19 ± 0.28 1.37 ± 0.35 0 Low-density lipoprotein cholesterol (mmol/L) 3.31 ± 0.93 3.33 ± 1.07 0.834 Alanine aminotransferase (U/L) 18.0 (14.0 - 25.0) 15.0 (13.0-22.0) 0.006 Aspartate aminotransferase (U/L) 19.0 (16.0 - 22.0) 20.0 (16.0-24.0) 0.348 Alkaline phosphatase (U/L) 76.0 (63.0 - 88.3) 71.0 (61.0-85.0) 0.218 γ-glutamyltransferase (U/L) 25.5 (21.8 - 38.0) 19.0 (14.0-25.0) 0 Blood urea nitrogen (mmol/L) 5.68 ± 1.71 5.60 ± 1.54 0.685 Serum creatinine (imol/L) 64.06 ± 13.71 67.50 ± 24.73 0.211 Thyroid-stimulating hormone (mIU/L) 1.66 (1.19 - 2.45) 1.57 (1.01-2.33) 0.194 Free triiodothyronine (pmol/L) 4.41 (4.13 - 4.70) 4.35(3.91-4.71) 0.226 Free thyroxine levels (pmol/L) 12.88 (12.15 - 13.44) 12.46 (11.74-13.68) 0.198 Data are presented as means ± SD or median (IQR) or percentages.
The subjects were divided according to the interquartile of thyroid function parameters (Figure 1). For TSH, quartile 1 (Q1): TSH ≤ 1.14 mIU/L; quartile 2 (Q2): TSH 1.14 - 1.63 mIU/L; quartile 3 (Q3): TSH 1.63 − 2.34 mIU/L; quartile 4 (Q4):TSH ≥ 2.34 mIU/L. Prevalence of NAFLD was significantly different among the four groups (p = 0.007). The prevalence of NAFLD was gradually elevated as TSH increased.

For FT3, Q1: FT3 ≤ 4.16 pmol/L; Q2: FT3 4.16 – 4.51 pmol/L; Q3: FT3 4.51 – 4.90 pmol/L; Q4: FT3 ≥ 4.90 pmol/L. Prevalence of NAFLD was significantly different among the four groups (p = 0.000). The prevalence of NAFLD was gradually elevated as FT3 increased.
For FT4, Q1: FT4 ≤ 11.80 pmol/L; Q2: FT4 11.80 – 12.74 pmol/L; Q3: FT4 12.74-13.70 pmol/L; Q4: FT4 ≥ 13.70 pmol/L. Prevalence of NAFLD was not significantly different among the four groups. There was no association between FT4 and prevalence of NAFLD.
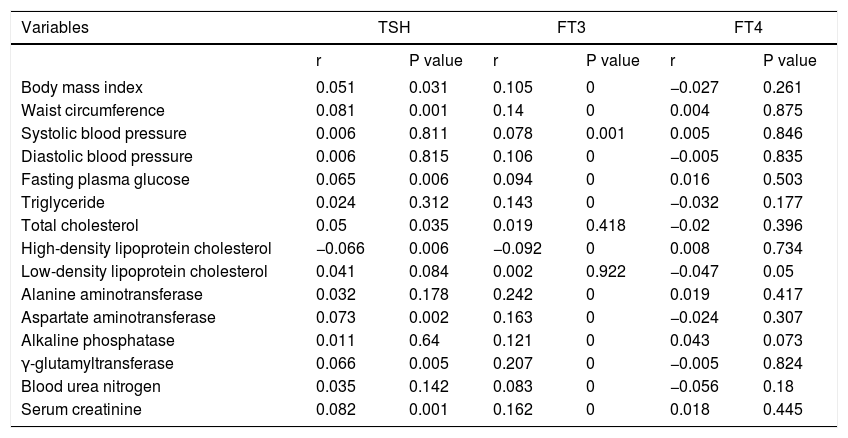
Association of thyroid function parameters with clinical and biochemical variablesTSH was positively correlated with BMI, WC, FPG, TC, AST, GGT and Cr, and negatively correlated with HDL-C. FT3 was positively correlated with BMI, WC, SBP, DBP, FPG, TG, ALT, AST, ALP, GGT, BUN and Cr, and negatively correlated with HDL-C. FT4 was not significantly correlated with clinical and biochemical variables (Table 5).
Association of thyroid function parameters with clinical and biochemical variables.
| Variables | TSH | FT3 | FT4 | |||
|---|---|---|---|---|---|---|
| r | P value | r | P value | r | P value | |
| Body mass index | 0.051 | 0.031 | 0.105 | 0 | −0.027 | 0.261 |
| Waist circumference | 0.081 | 0.001 | 0.14 | 0 | 0.004 | 0.875 |
| Systolic blood pressure | 0.006 | 0.811 | 0.078 | 0.001 | 0.005 | 0.846 |
| Diastolic blood pressure | 0.006 | 0.815 | 0.106 | 0 | −0.005 | 0.835 |
| Fasting plasma glucose | 0.065 | 0.006 | 0.094 | 0 | 0.016 | 0.503 |
| Triglyceride | 0.024 | 0.312 | 0.143 | 0 | −0.032 | 0.177 |
| Total cholesterol | 0.05 | 0.035 | 0.019 | 0.418 | −0.02 | 0.396 |
| High-density lipoprotein cholesterol | −0.066 | 0.006 | −0.092 | 0 | 0.008 | 0.734 |
| Low-density lipoprotein cholesterol | 0.041 | 0.084 | 0.002 | 0.922 | −0.047 | 0.05 |
| Alanine aminotransferase | 0.032 | 0.178 | 0.242 | 0 | 0.019 | 0.417 |
| Aspartate aminotransferase | 0.073 | 0.002 | 0.163 | 0 | −0.024 | 0.307 |
| Alkaline phosphatase | 0.011 | 0.64 | 0.121 | 0 | 0.043 | 0.073 |
| γ-glutamyltransferase | 0.066 | 0.005 | 0.207 | 0 | −0.005 | 0.824 |
| Blood urea nitrogen | 0.035 | 0.142 | 0.083 | 0 | −0.056 | 0.18 |
| Serum creatinine | 0.082 | 0.001 | 0.162 | 0 | 0.018 | 0.445 |
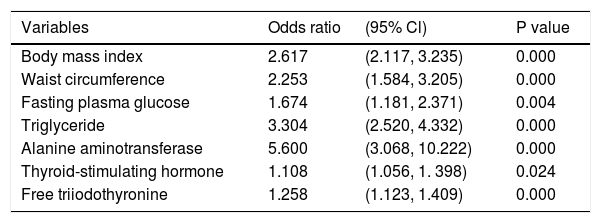
As BMI, WC, SBP, DBP, FPG, TG, TC, HDL-C, LDL-C, ALT, AST, ALP, GGT, BUN, Cr, TSH and FT3 were entered into a multivariate regression analysis, TSH (OR = 1.108, 95%CI = 1.056 - 1.398, P = 0.024) and FT3 (OR = 1.258, 95%CI = 1.123-1.409, P = 0.000) remained independent risk factors for NAFLD diagnosed by ultrasound (Table 6).
Multivariate logistic regression analysis regarding the risk of NAFLD diagnosed by ultrasound.
| Variables | Odds ratio | (95% Cl) | P value |
|---|---|---|---|
| Body mass index | 2.617 | (2.117, 3.235) | 0.000 |
| Waist circumference | 2.253 | (1.584, 3.205) | 0.000 |
| Fasting plasma glucose | 1.674 | (1.181, 2.371) | 0.004 |
| Triglyceride | 3.304 | (2.520, 4.332) | 0.000 |
| Alanine aminotransferase | 5.600 | (3.068, 10.222) | 0.000 |
| Thyroid-stimulating hormone | 1.108 | (1.056, 1. 398) | 0.024 |
| Free triiodothyronine | 1.258 | (1.123, 1.409) | 0.000 |
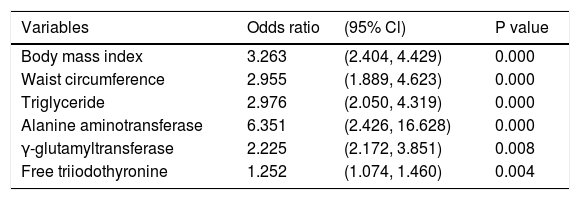
We also conducted a multivariate logistic regression analysis regarding the risk of NAFLD estimated according to the FLI. FT3 (OR = 1.252, 95%CI = 1.074 - 1.460, P = 0.004) was an independent risk factor for NAFLD estimated by FLI ≥ 60 (Table 7).
Multivariate logistic regression analysis regarding the risk of NAFLD estimated by FLI ≥ 60.
| Variables | Odds ratio | (95% Cl) | P value |
|---|---|---|---|
| Body mass index | 3.263 | (2.404, 4.429) | 0.000 |
| Waist circumference | 2.955 | (1.889, 4.623) | 0.000 |
| Triglyceride | 2.976 | (2.050, 4.319) | 0.000 |
| Alanine aminotransferase | 6.351 | (2.426, 16.628) | 0.000 |
| γ-glutamyltransferase | 2.225 | (2.172, 3.851) | 0.008 |
| Free triiodothyronine | 1.252 | (1.074, 1.460) | 0.004 |
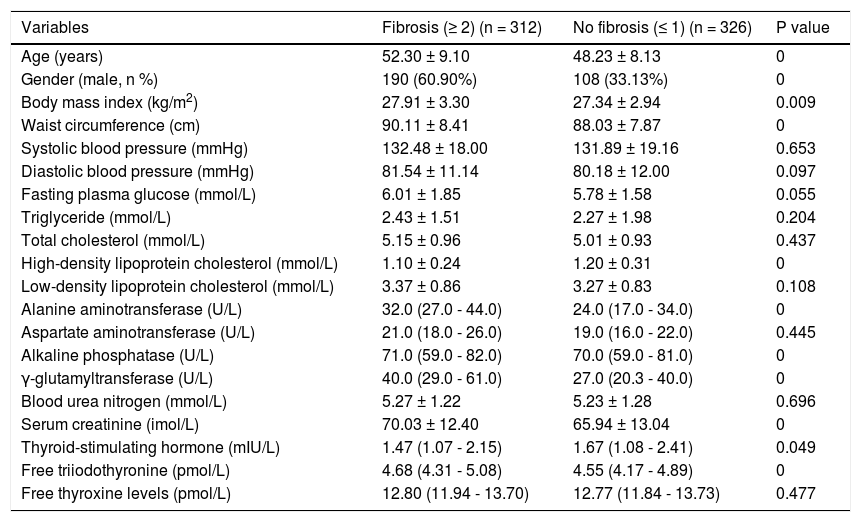
NAFLD subjects with fibrosis had significantly higher age, proportion of male, BMI, WC, ALT, ALP, GGT, Cr, and FT3 and significantly lower TSH and HDL-C (Table 8). However, the FT4 was not significantly different between NAFLD subjects with and without fibrosis.
Comparison between NAFLD subjects with and without fibrosis according to BARD score.
| Variables | Fibrosis (≥ 2) (n = 312) | No fibrosis (≤ 1) (n = 326) | P value |
|---|---|---|---|
| Age (years) | 52.30 ± 9.10 | 48.23 ± 8.13 | 0 |
| Gender (male, n %) | 190 (60.90%) | 108 (33.13%) | 0 |
| Body mass index (kg/m2) | 27.91 ± 3.30 | 27.34 ± 2.94 | 0.009 |
| Waist circumference (cm) | 90.11 ± 8.41 | 88.03 ± 7.87 | 0 |
| Systolic blood pressure (mmHg) | 132.48 ± 18.00 | 131.89 ± 19.16 | 0.653 |
| Diastolic blood pressure (mmHg) | 81.54 ± 11.14 | 80.18 ± 12.00 | 0.097 |
| Fasting plasma glucose (mmol/L) | 6.01 ± 1.85 | 5.78 ± 1.58 | 0.055 |
| Triglyceride (mmol/L) | 2.43 ± 1.51 | 2.27 ± 1.98 | 0.204 |
| Total cholesterol (mmol/L) | 5.15 ± 0.96 | 5.01 ± 0.93 | 0.437 |
| High-density lipoprotein cholesterol (mmol/L) | 1.10 ± 0.24 | 1.20 ± 0.31 | 0 |
| Low-density lipoprotein cholesterol (mmol/L) | 3.37 ± 0.86 | 3.27 ± 0.83 | 0.108 |
| Alanine aminotransferase (U/L) | 32.0 (27.0 - 44.0) | 24.0 (17.0 - 34.0) | 0 |
| Aspartate aminotransferase (U/L) | 21.0 (18.0 - 26.0) | 19.0 (16.0 - 22.0) | 0.445 |
| Alkaline phosphatase (U/L) | 71.0 (59.0 - 82.0) | 70.0 (59.0 - 81.0) | 0 |
| γ-glutamyltransferase (U/L) | 40.0 (29.0 - 61.0) | 27.0 (20.3 - 40.0) | 0 |
| Blood urea nitrogen (mmol/L) | 5.27 ± 1.22 | 5.23 ± 1.28 | 0.696 |
| Serum creatinine (imol/L) | 70.03 ± 12.40 | 65.94 ± 13.04 | 0 |
| Thyroid-stimulating hormone (mIU/L) | 1.47 (1.07 - 2.15) | 1.67 (1.08 - 2.41) | 0.049 |
| Free triiodothyronine (pmol/L) | 4.68 (4.31 - 5.08) | 4.55 (4.17 - 4.89) | 0 |
| Free thyroxine levels (pmol/L) | 12.80 (11.94 - 13.70) | 12.77 (11.84 - 13.73) | 0.477 |
Data are presented as means ± SD or median (IQR) or percentages.
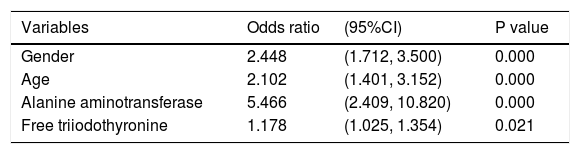
Multivariate analysis demonstrated that FT3 (OR = 1.178, 95%CI = 1.025 - 1.354, P = 0.021) was independent risk factor for fibrosis estimated by BARD score ≥ 2 in NAFLD subjects (Table 9).
Multivariate logistic regression analysis regarding the risk of fibrosis estimated by BARD score ≥ 2 in NAFLD subjects.
| Variables | Odds ratio | (95%CI) | P value |
|---|---|---|---|
| Gender | 2.448 | (1.712, 3.500) | 0.000 |
| Age | 2.102 | (1.401, 3.152) | 0.000 |
| Alanine aminotransferase | 5.466 | (2.409, 10.820) | 0.000 |
| Free triiodothyronine | 1.178 | (1.025, 1.354) | 0.021 |
Recent studies have explored the usefulness of serum thyroid function levels for the assessment of severity of different liver diseases.12,13 Our present work is a large Chinese population-based cross-sectional study exploring the association of thyroid function parameters with risk of NAFLD in euthyroid subjects. We found the following:
- •
Regardless of age, the risk of NAFLD estimated by either ultrasound or FLI was positively associated with TSH and FT3 levels.
- •
This association remained after adjusting well-known risk factors for NAFLD.
- •
This association remained in middle-age subjects, but not in elderly subjects.
- •
There was an obvious correlation of TSH and FT3 levels with well-known risk factors for NAFLD, but no association of FT4 level with risk of NAFLD was observed; and
- •
The risk of fibrosis estimated by BARD score was positively associated with FT3 level in NAFLD subjects.
Our study found that the prevalence of NAFLD was 35.98%, which seemed to be higher than the general prevalence in Asia (27.4%, 95% confidence interval: 23.3% -31.9%). This might be explained by the fact that all subjects who were included in our study and underwent a health check-up might have a better living condition with a higher risk of excessive nutrition, obesity, diabetes, abnormal lipids and metabolic syndrome.
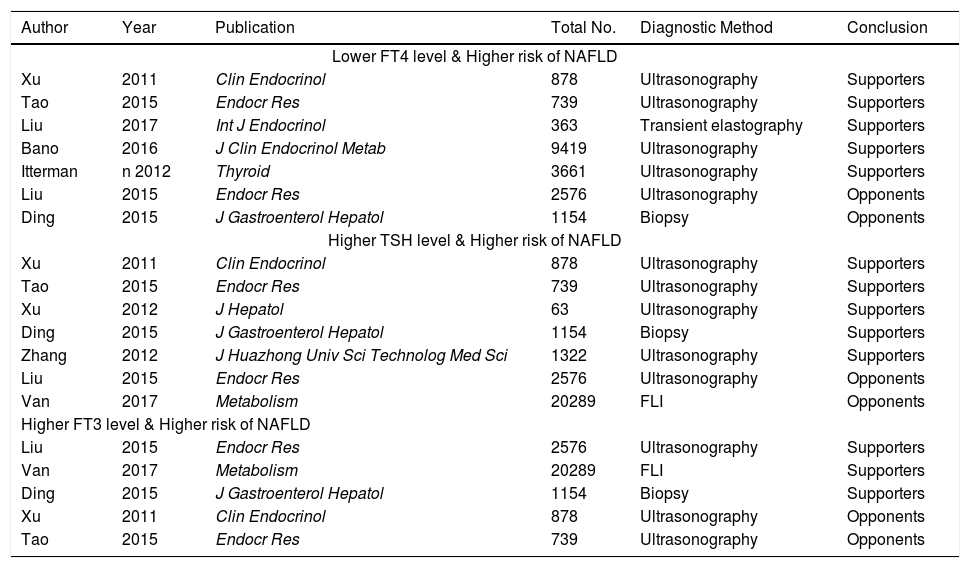
The current controversy regarding association between thyroid function parameters with risk of NAFLD is obvious among studies (Table 10). A majority of studies supported an inverse correlation between FT4 level and risk of NAFLD in individuals with euthyroidism or general population;4,6–7,14,15 by contrast, two studies did not find any significant association between them.8,16 Also, a majority of studies supported a positive correlation between THS level and risk of NAFLD in individuals with euthyroidism, hepatitis B virus patients, or general population;6,7,16–18 by contrast, two studies did not find any significant association between them.5,8 Three studies supported a positive correlation between FT3 level and risk of NAFLD in individuals with euthyroidism, hepatitis B virus patients, or general population;5,8,16 by contrast, two studies did not find any significant association between them.6,7 Such a discrepancy should be deeply analyzed. First, the regions where the studies were performed were different among studies. The studies by Bano,4 van den Berg,5 and Ittermann14 were performed in Europe (the first in Netherlands, and the latter in Germany). The remaining studies were performed in China. Therefore, the race of subjects might be different among studies. Second, the study design was different among studies. The study by Liu, et al. was a randomized controlled trial exploring the impact of levothyroxine (LT4) supplementation on the prevalence of NAFLD in patients with subclinical hy-pothyroidism.15 The study by Bano, et al. was a cohort study.4 By comparison, the remaining studies were cross-sectional studies. Third, the age of subjects was different among studies. In the study by Xu, et al.,6 all subjects were equal to or more than 65 years. In the study by Tao, et al.,7 the age was unrestricted. In the study by Liu, et al.,8 the age of subjects ranged from 35 to 60 years. Fourth, the characteristics of study population were different among studies. In the studies by Tao,7 Xu,6 van den Berg,5 and Zhang,18 euthyroid subjects were selected. In the studies by Bano4 and Ittermann,14 general population was enrolled. In the study by Ding,16 hepatitis B virus patients were enrolled. Therefore, it might be easy to understand the potential discrepancy in the findings among studies.
An overview of previous studies regarding thyroid function and risk of NAFLD.
| Author | Year | Publication | Total No. | Diagnostic Method | Conclusion |
|---|---|---|---|---|---|
| Lower FT4 level & Higher risk of NAFLD | |||||
| Xu | 2011 | Clin Endocrinol | 878 | Ultrasonography | Supporters |
| Tao | 2015 | Endocr Res | 739 | Ultrasonography | Supporters |
| Liu | 2017 | Int J Endocrinol | 363 | Transient elastography | Supporters |
| Bano | 2016 | J Clin Endocrinol Metab | 9419 | Ultrasonography | Supporters |
| Itterman | n 2012 | Thyroid | 3661 | Ultrasonography | Supporters |
| Liu | 2015 | Endocr Res | 2576 | Ultrasonography | Opponents |
| Ding | 2015 | J Gastroenterol Hepatol | 1154 | Biopsy | Opponents |
| Higher TSH level & Higher risk of NAFLD | |||||
| Xu | 2011 | Clin Endocrinol | 878 | Ultrasonography | Supporters |
| Tao | 2015 | Endocr Res | 739 | Ultrasonography | Supporters |
| Xu | 2012 | J Hepatol | 63 | Ultrasonography | Supporters |
| Ding | 2015 | J Gastroenterol Hepatol | 1154 | Biopsy | Supporters |
| Zhang | 2012 | J Huazhong Univ Sci Technolog Med Sci | 1322 | Ultrasonography | Supporters |
| Liu | 2015 | Endocr Res | 2576 | Ultrasonography | Opponents |
| Van | 2017 | Metabolism | 20289 | FLI | Opponents |
| Higher FT3 level & Higher risk of NAFLD | |||||
| Liu | 2015 | Endocr Res | 2576 | Ultrasonography | Supporters |
| Van | 2017 | Metabolism | 20289 | FLI | Supporters |
| Ding | 2015 | J Gastroenterol Hepatol | 1154 | Biopsy | Supporters |
| Xu | 2011 | Clin Endocrinol | 878 | Ultrasonography | Opponents |
| Tao | 2015 | Endocr Res | 739 | Ultrasonography | Opponents |
Compared with previous studies, our study had its own features. First, we had a relatively large sample size. Second, we selected euthyroid subjects regardless of age. Third, we conducted the subgroup analyses according to the age of subjects (middle-age and elderly subjects). Because most of subjects who underwent health check-up were older, we could not analyze the association in young subjects (< 30 years). Fourth, we conducted the multivariate analyses to further confirm the reliability of our findings. Fifth, we also conducted the correlation analyses to evaluate the association of thyroid function parameters with well-known risk factors for NAFLD. These analyses contributed to explaining the reasons why FT3 and TSH levels were significantly associated with risk of NAFLD.
Our study had two major limitations. First, we cannot evaluate a direct causal relationship between NAFLD and thyroid function. Further mechanism research is needed to clarify their exact association in prospective cohort studies. Second, liver biopsy is a golden standard for diagnosing NAFLD and grading the liver fibrosis, but is invasive. By comparison, we used the ultrasonography examination and FLI for non-invasive diagnosis of NAFLD and BARD score for non-invasive assessment of fibrosis. Additionally, liver biopsy might be impractical in such a large number of subjects who underwent health check-up examinations.
In conclusion, higher levels of serum FT3 and TSH were independently associated with risk of NAFLD in euthyroid subjects. However, this association might be further compromised as the age of subjects was increased. Additionally, higher level of serum FT3 was positively associated with the risk of fibrosis in NAFLD subjects. Large-scale, multi-ethnic, multi-regional, population-based, prospective studies should be undertaken in the future.
Conflict of InterestNone.
Financial SupportNone.
Authors’ Contributions- •
Yiting Liu, Wei Wang collected the data.
- •
Yiting Liu performed the statistical analyses.
- •
Yiting Liu, Wei Wang, Xiaosong Yu, Xingshun Qi wrote the paper.
- •
Yiting Liu, Xingshun Qi revised the paper.
- •
Xiaosong Yu supervised the work.
- •
Yiting Liu, Wei Wang, Xiaosong Yu, Xingshun Qi approved the final manuscript.


