


Hepatocellular liver injury is characterized by elevations in serum alanine (ALT) and aspartate (AST) aminotransferases while cholestasis is associated with elevated serum alkaline phosphatase (ALP) levels. When both sets of enzymes are elevated, distinguishing between the two patterns of liver disease can be difficult. The aim of this study was to document the predicted ranges of serum ALP values in patients with hepatocellular liver injury and ALT or AST values in patients with cholestasis.
Materials and methodsLiver enzyme levels were documented in adult patients with various types and degrees of hepatocellular (non-alcoholic fatty liver disease, hepatitis B and C, alcohol and autoimmune hepatitis) and cholestatic (primary biliary cholangitis and primary sclerosing cholangitis) disease.
ResultsIn 5167 hepatocellular disease patients with ALT (or AST) values that were normal, 1–5×, 5–10× or >10× elevated, median (95% CI) serum ALP levels were 0.64 (0.62–0.66), 0.72 (0.71–0.73), 0.80 (0.77–0.82) and 1.15 (1.0–1.22) fold elevated respectively. In 252 cholestatic patients with ALP values that were normal, 1–5× or >5× elevated, serum ALT (or AST) values were 1.13 (0.93–1.63), 2.47 (2.13–2.70) and 4.57 (3.27–5.63) fold elevated respectively. In 56 patients with concurrent diseases, ALP levels were beyond predicted values for their hepatitis in 38 (68%) and ALT (or AST) values beyond predicted values for their cholestatic disorder in 24 (43%).
ConclusionsThese data provide health care providers with predicted ranges of liver enzymes in patients with hepatocellular or cholestatic liver disease and may thereby help to identify patients with concurrent forms of liver disease.
Interpreting liver enzyme levels is an important component of the evaluation of patients with acute or chronic liver disease [1]. Typically, elevated serum alanine (ALT) and aspartate (AST) aminotransferase levels reflect the extent of hepatocellular injury while elevated serum alkaline phosphatase (ALP) and gamma-glutamyl transferase (GGT) levels, the extent of impaired bile flow or cholestasis [1]. However, the distinction between hepatocellular disease and cholestasis is not absolute in that the former patients often have elevated serum ALP and/or GGT levels and ALT and/or AST elevations are common in patients with cholestasis. These findings can result in uncertainty as to whether a patient has hepatocellular disease with a significant cholestatic component, cholestasis with a significant hepatocellular disease component or two distinct disorders (concurrent hepatocellular and cholestatic liver diseases).
Despite the clinical value of interpreting relative differences in serum ALT, AST, ALP and GGT levels there have been no reports to date, specifically describing the extent of ALP and GGT elevations in hepatocellular disease patients or ALT and AST elevations in cholestatic disease patients.
In the present study, we documented serum ALT, AST, ALP and GGT levels in a large cohort of adult liver disease patients and identified the range of ALP and GGT elevations in hepatocellular disease patients with various degrees of injury and ALT and AST levels in cholestatic patients with various degrees of cholestasis. To determine whether predicted ranges of liver enzyme abnormalities might help to identify patients with both forms of liver disease we also documented enzyme levels in patients with concurrent hepatocellular and cholestatic liver disease.
2Material and methodsThe data employed for this retrospective analysis were derived from the Philip and Ellie Kives Clinical Database, a computerized outpatient database maintained by the Liver Disease Program at the XXX XXX XXX (XXXC) in XXXXX, a tertiary care centre that serves the healthcare needs of 1.2 million individuals. The database contains demographic (but not race or ethnicity), laboratory, radiologic and histologic findings in adult patients referred to the XXX for assessment and management of acute and/or chronic liver disease. Diagnoses are entered into the database on the basis of clinical findings and test results that meet standard diagnostic criteria.
At initial visits, patients were asked to provide written, informed consent to allow their findings to be analyzed and described (anonymously) for research purposes. The consent procedure has been approved by the XXXX XX XXXX Conjoint Ethics Committee.
With the exception of alcohol-induced liver disease (ALD) where serum AST often exceed ALT values, each hepatocellular disease cohort was divided into those with normal, 1–5×, 5–10× and >10× the upper limit of normal (ULN) values for ALT [2]. In the case of ALD, AST values were employed. Due to the smaller numbers of cholestatic liver disease patients, these patients were divided into those with normal, 1–5× or >5× ULN ALP values.
Serum ALT levels were measured according to the International Federation of Clinical Chemistry and Laboratory Medicine Scientific Division, Committee on Reference Systems of Enzymes without pyridoxal phosphate (ALT; Roche Diagnostics, Indianapolis, IN) reagents on the Roche Cobas 6000 analyzer. Results were interpreted as a multiple of the sex-specific upper limit of normal (ULN) (ULN=30U/L for males and ULN=25U/L for females). Alkaline phosphatase was measured using the Cobas C system alkaline phosphatase according to International Federation of Clinical Chemistry and Laboratory Medicine Scientific Division, Committee on Reference Systems of Enzymes IFCC Generation 2 (ALP2; Roche Diagnostics, Indianapolis, IN) reagents on the Roche Cobas 6000 analyzer. The ULN was <105U/L for females ≥18 years of age and <130U/L for males ≥18 years of age. The results of the study are presented as fold elevations above the designated ULN.
For the purpose of this study, patients with two or more hepatocellular or cholestatic liver diseases were excluded unless otherwise indicated. Also, to eliminate the effects of liver disease treatments on serum liver enzyme levels, only laboratory results from the untreated patient's initial visit to the clinic were analyzed. The cohorts of patients included those with non-alcoholic fatty liver disease (NAFLD), hepatitis B and C viral infections, alcohol-induced liver disease (ALD), autoimmune hepatitis (AIH), primary biliary cholangitis (PBC) and primary sclerosing cholangitis (PSC). The diagnostic criteria for each disorder were as follows: NAFLD, histology or radiologic imaging in keeping with fatty infiltration of the liver and no history of excess alcohol intake, use of medications associated with fatty infiltration of the liver and negative testing for hepatitis C virus (HCV). In the majority of NAFLD cases where autoantibodies were present, a biopsy was obtained to rule out concurrent immune-mediated liver disease.; ALD, self-reported weekly alcohol intake in excess of 21 units per week in males and 14 units per week in females; HBV, positive serologic testing for hepatitis B surface antigen (HBsAg); HCV, positive testing for antibody to HCV and/or HCV core antigen or HCV-RNA; AIH, compatible histologic findings and/or positive serologic testing (titre ≥1:80) for anti-nuclear (ANA) and smooth muscle (SMA) antibodies; PBC, cholestatic liver enzyme abnormalities, compatible histology and/or positive serologic testing (titre ≥1:40) for mitochondrial (AMA) antibody and PSC, diagnostic radiologic imaging and/or histologic features in the absence of secondary causes of sclerosing cholangitis [3].
2.1Statistical analysesElevation of liver enzymes were represented as the median fold-increase with the 95% CI and assessed by Mann–Whitney U test and Wilcoxon Rank-Sum test for difference in medians.
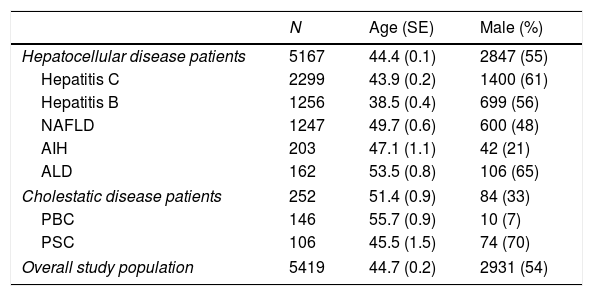
3ResultsLiver enzyme values were available from a total of 5419 diagnosed patients, 5167 with hepatocellular and 252 with cholestatic liver disorders. The number of subjects, mean (±SEM) age and gender distribution for each disease cohort are provided in Table 1. Overall, the mean age of study subjects was 44.7±0.2 years and 2931 (54%) were male.
Causes of liver disease and demographic features of the study population.
| N | Age (SE) | Male (%) | |
|---|---|---|---|
| Hepatocellular disease patients | 5167 | 44.4 (0.1) | 2847 (55) |
| Hepatitis C | 2299 | 43.9 (0.2) | 1400 (61) |
| Hepatitis B | 1256 | 38.5 (0.4) | 699 (56) |
| NAFLD | 1247 | 49.7 (0.6) | 600 (48) |
| AIH | 203 | 47.1 (1.1) | 42 (21) |
| ALD | 162 | 53.5 (0.8) | 106 (65) |
| Cholestatic disease patients | 252 | 51.4 (0.9) | 84 (33) |
| PBC | 146 | 55.7 (0.9) | 10 (7) |
| PSC | 106 | 45.5 (1.5) | 74 (70) |
| Overall study population | 5419 | 44.7 (0.2) | 2931 (54) |
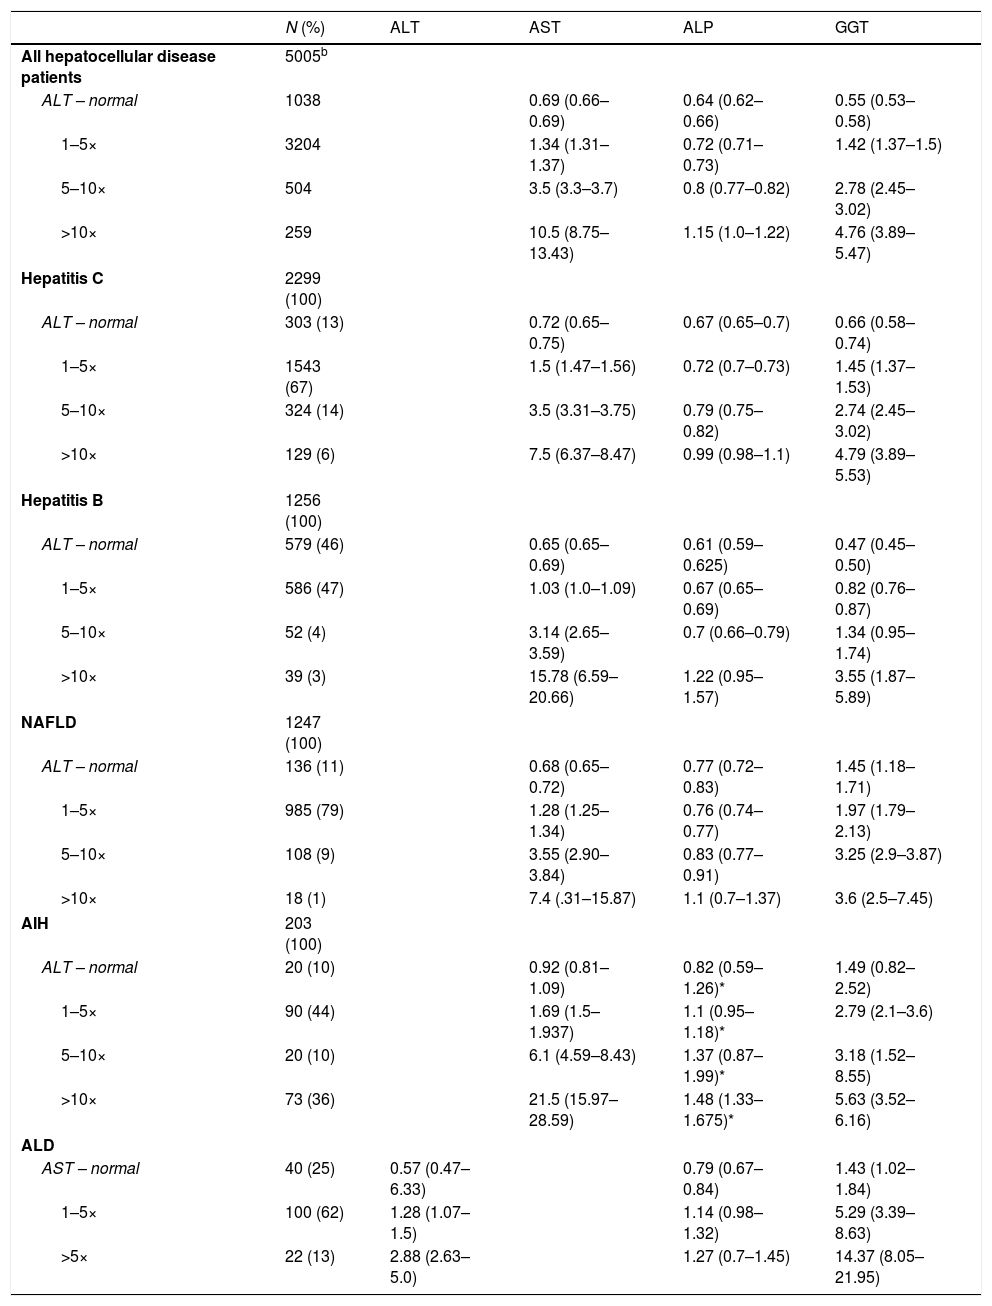
Table 2 provides the results of liver enzyme tests and associated severity of liver disease for patients with hepatocellular liver injury (hepatitis B and C, NAFLD, AIH and ALD). In the 5005 hepatocellular disease patients with ALT values within the normal range, 1–5×, 5–10× and >10× ULN, the corresponding median (95% CI) ALP values were 0.64 (0.62–0.66), 0.72 (0.71–0.73), 0.80 (0.77–0.82) and 1.15 (1.0–1.22) times the ULN. With the exception of AIH patients where ALP levels were consistently higher than predicted values for other causes of liver disease (p<0.01), ALP ranges were similar, regardless of the underlying cause of hepatocellular disease.
Liver enzyme abnormalities in patients with varying degrees of hepatocellular liver disease.a
| N (%) | ALT | AST | ALP | GGT | |
|---|---|---|---|---|---|
| All hepatocellular disease patients | 5005b | ||||
| ALT – normal | 1038 | 0.69 (0.66–0.69) | 0.64 (0.62–0.66) | 0.55 (0.53–0.58) | |
| 1–5× | 3204 | 1.34 (1.31–1.37) | 0.72 (0.71–0.73) | 1.42 (1.37–1.5) | |
| 5–10× | 504 | 3.5 (3.3–3.7) | 0.8 (0.77–0.82) | 2.78 (2.45–3.02) | |
| >10× | 259 | 10.5 (8.75–13.43) | 1.15 (1.0–1.22) | 4.76 (3.89–5.47) | |
| Hepatitis C | 2299 (100) | ||||
| ALT – normal | 303 (13) | 0.72 (0.65–0.75) | 0.67 (0.65–0.7) | 0.66 (0.58–0.74) | |
| 1–5× | 1543 (67) | 1.5 (1.47–1.56) | 0.72 (0.7–0.73) | 1.45 (1.37–1.53) | |
| 5–10× | 324 (14) | 3.5 (3.31–3.75) | 0.79 (0.75–0.82) | 2.74 (2.45–3.02) | |
| >10× | 129 (6) | 7.5 (6.37–8.47) | 0.99 (0.98–1.1) | 4.79 (3.89–5.53) | |
| Hepatitis B | 1256 (100) | ||||
| ALT – normal | 579 (46) | 0.65 (0.65–0.69) | 0.61 (0.59–0.625) | 0.47 (0.45–0.50) | |
| 1–5× | 586 (47) | 1.03 (1.0–1.09) | 0.67 (0.65–0.69) | 0.82 (0.76–0.87) | |
| 5–10× | 52 (4) | 3.14 (2.65–3.59) | 0.7 (0.66–0.79) | 1.34 (0.95–1.74) | |
| >10× | 39 (3) | 15.78 (6.59–20.66) | 1.22 (0.95–1.57) | 3.55 (1.87–5.89) | |
| NAFLD | 1247 (100) | ||||
| ALT – normal | 136 (11) | 0.68 (0.65–0.72) | 0.77 (0.72–0.83) | 1.45 (1.18–1.71) | |
| 1–5× | 985 (79) | 1.28 (1.25–1.34) | 0.76 (0.74–0.77) | 1.97 (1.79–2.13) | |
| 5–10× | 108 (9) | 3.55 (2.90–3.84) | 0.83 (0.77–0.91) | 3.25 (2.9–3.87) | |
| >10× | 18 (1) | 7.4 (.31–15.87) | 1.1 (0.7–1.37) | 3.6 (2.5–7.45) | |
| AIH | 203 (100) | ||||
| ALT – normal | 20 (10) | 0.92 (0.81–1.09) | 0.82 (0.59–1.26)* | 1.49 (0.82–2.52) | |
| 1–5× | 90 (44) | 1.69 (1.5–1.937) | 1.1 (0.95–1.18)* | 2.79 (2.1–3.6) | |
| 5–10× | 20 (10) | 6.1 (4.59–8.43) | 1.37 (0.87–1.99)* | 3.18 (1.52–8.55) | |
| >10× | 73 (36) | 21.5 (15.97–28.59) | 1.48 (1.33–1.675)* | 5.63 (3.52–6.16) | |
| ALD | |||||
| AST – normal | 40 (25) | 0.57 (0.47–6.33) | 0.79 (0.67–0.84) | 1.43 (1.02–1.84) | |
| 1–5× | 100 (62) | 1.28 (1.07–1.5) | 1.14 (0.98–1.32) | 5.29 (3.39–8.63) | |
| >5× | 22 (13) | 2.88 (2.63–5.0) | 1.27 (0.7–1.45) | 14.37 (8.05–21.95) | |
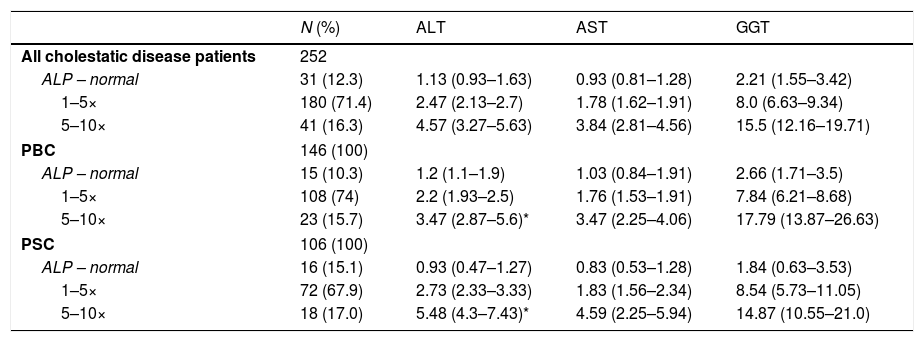
For the 252 patients diagnosed with cholestatic liver disease (PBC or PSC) and normal, 1–5× and >5× ULN values for ALP, the corresponding ALT values were 1.13 (0.93–1.63), 2.47 (2.13–2.7) and 4.57 (3.27–5.63) times the ULN respectively (Table 3). PSC patients with more severe disease (ALP>5× ULN) had significantly higher ALT values than PBC patients with the same degree of cholestasis [5.48 (4.3–7.43) versus 3.47 (2.87–5.6), p=0.025].
Liver enzyme abnormalities in patients with varying degrees of cholestatic liver disease.a
| N (%) | ALT | AST | GGT | |
|---|---|---|---|---|
| All cholestatic disease patients | 252 | |||
| ALP – normal | 31 (12.3) | 1.13 (0.93–1.63) | 0.93 (0.81–1.28) | 2.21 (1.55–3.42) |
| 1–5× | 180 (71.4) | 2.47 (2.13–2.7) | 1.78 (1.62–1.91) | 8.0 (6.63–9.34) |
| 5–10× | 41 (16.3) | 4.57 (3.27–5.63) | 3.84 (2.81–4.56) | 15.5 (12.16–19.71) |
| PBC | 146 (100) | |||
| ALP – normal | 15 (10.3) | 1.2 (1.1–1.9) | 1.03 (0.84–1.91) | 2.66 (1.71–3.5) |
| 1–5× | 108 (74) | 2.2 (1.93–2.5) | 1.76 (1.53–1.91) | 7.84 (6.21–8.68) |
| 5–10× | 23 (15.7) | 3.47 (2.87–5.6)* | 3.47 (2.25–4.06) | 17.79 (13.87–26.63) |
| PSC | 106 (100) | |||
| ALP – normal | 16 (15.1) | 0.93 (0.47–1.27) | 0.83 (0.53–1.28) | 1.84 (0.63–3.53) |
| 1–5× | 72 (67.9) | 2.73 (2.33–3.33) | 1.83 (1.56–2.34) | 8.54 (5.73–11.05) |
| 5–10× | 18 (17.0) | 5.48 (4.3–7.43)* | 4.59 (2.25–5.94) | 14.87 (10.55–21.0) |
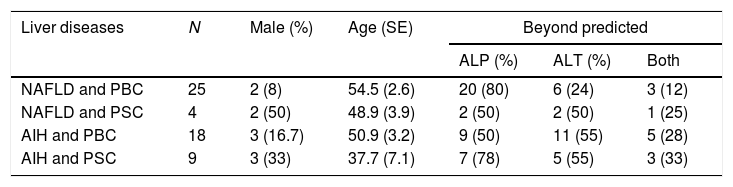
To determine whether predicted ranges of ALP in hepatocellular disease patients and ALT in cholestatic patients aid in identifying patients with both types of disorders, the results of liver enzyme testing in 56 patients with concurrent hepatocellular and cholestatic diseases were analyzed. The gender distribution and mean age in these patients are shown in Table 4. In this cohort the hepatocellular diseases were NAFLD (N=29) and autoimmune hepatitis (N=27), while the cholestatic diseases were PBC (N=43) and PSC (N=13). Overall, ALP levels were beyond the predicted ranges for severity of underlying hepatocellular disease in 38/56 (68%) and ALT for underlying severity of cholestatic disease in 24/56 (43%) of patients.
Demographic features, underlying liver disease and beyond predicted liver enzyme levels in those with both hepatocellular and cholestatic liver disorders.
| Liver diseases | N | Male (%) | Age (SE) | Beyond predicted | ||
|---|---|---|---|---|---|---|
| ALP (%) | ALT (%) | Both | ||||
| NAFLD and PBC | 25 | 2 (8) | 54.5 (2.6) | 20 (80) | 6 (24) | 3 (12) |
| NAFLD and PSC | 4 | 2 (50) | 48.9 (3.9) | 2 (50) | 2 (50) | 1 (25) |
| AIH and PBC | 18 | 3 (16.7) | 50.9 (3.2) | 9 (50) | 11 (55) | 5 (28) |
| AIH and PSC | 9 | 3 (33) | 37.7 (7.1) | 7 (78) | 5 (55) | 3 (33) |
The results of this study provide clinicians with predicted ranges for cholestatic liver enzymes in patients with common causes of hepatocellular disease and aminotransferase levels for patients with common causes of cholestasis. The results reveal that serum ALP levels are increased in proportion to the severity of hepatocellular liver injury and aminotransferases to the severity of cholestasis. In addition, the findings suggest the profile of elevated liver enzymes can help determine which patients have concurrent hepatocellular and cholestatic forms of liver disease.
The mechanism(s) whereby hepatocellular liver injury results in increased serum ALP levels remains to be determined. ALP is a phosphatase enzyme expressed in the apical membrane of hepatocytes and therefore, hepatocellular necrosis would be expected to result in the release of ALP into the systemic circulation and/or bile canaliculi [4,5]. However, certain conditions such as ischaemic hepatitis can be associated with marked elevations in serum aminotransferases yet normal or near normal ALP levels [6,7]. Thus, the explanation for why serum ALP levels are increased in some but not all patients with hepatocellular injury is unclear.
Also remaining to be determined is why serum aminotransferases are elevated in patients with common cholestatic liver diseases. Here, ‘collateral damage’ to hepatocytes located adjacent to inflamed portal tracts and the retention of toxic bile acids (resulting in increased hepatocyte reactive oxygen species, lipid peroxidation and necrosis) are likely to be relevant [8]. That ALT and AST values increased in proportion to the severity of the underlying cholestatic liver disease are in keeping with both explanations.
Although the data presented includes findings for AST and GGT values, the focus of the study was serum ALT and ALP determinations. The explanation for this relates to the nonspecificity of AST and GGT values and with the exception of ALD, the limited sensitivity of AST in documenting the extent of hepatocellular liver injury in common causes of hepatitis [1].
In terms of assisting diagnostic accuracy, it is important to note that aside from higher serum ALP levels being documented in AIH patients, the predicted changes in ALP levels were consistent amongst the various common causes of hepatocellular disease. Similarly, aside from elevated aminotransferase levels being more common in PSC patients with severe disease (ALP>5× ULN), elevated aminotransferases did not help distinguish between PBC and PSC.
Translating these findings into clinical practice one could advise that in the majority of patients with common causes of hepatocellular disease, concurrent cholestatic liver disease should be considered if the serum ALP level exceeds 1.5 ULN. Conversely, in patients with common cholestatic disorders, ALT (or AST) values greater than approximately 5× ULN should prompt consideration of a concomitant hepatocellular disorder. Clearly, prospective studies are required to support these general guidelines.
It was not surprising that elevated serum ALT and/or ALP levels (beyond those predicted by the severity of the underlying disorder) identified the majority but not all patients with concurrent hepatocellular and cholestatic liver disorders. Likely contributing to this finding was the probability the second co-existing disorder was in its early stages when patients first presented to the clinic and liver enzyme abnormalities were not yet fully manifest. Also to be considered are recent findings that PBC patients tend to have lower serum ALP levels when NAFLD is also present than patients with PBC alone [9]. None-the-less, either disproportionate increases in serum ALP and ALT levels were present in the majority of patients with concurrent hepatocellular and cholestatic liver diseases and therefore, could serve to alert physicians to the possibility that a second disorder existed in these patients.
There are a number of limitations to this study that warrant emphasis. First, this was a retrospective analysis and larger, prospective studies are required to confirm the findings. Second, not all causes of hepatocellular disease and cholestasis were analyzed. In particular, due to their limited numbers, those causes sometimes associated with mixed hepatocellular/cholestatic liver disease such as drug-induced liver injury (DILI) and granulomatous infiltration of the liver were not considered [1]. Third, isoenzyme determinations were not performed to determine whether ALT, AST, ALP and GGT elevations were derived from hepatobiliary disease or other sources. Fourth, in order to eliminate the impact of disease treatment, only one set of liver enzymes values was utilized (the patients initial laboratory findings) and therefore, transient elevations due to sample collection, storage or circadian rhythm could not be excluded [10]. Fifth, it could not be reliably ascertained whether patients were fasting when tested. This may be particularly relevant to Lewis-positive secretors of blood types B or O in that serum ALP levels can increase in these patients following meals [11,12]. Finally, liver histology was not available to support the use of serum enzyme levels as reflecting the severity or stage of liver disease. However, the intent of the study was to determine what the predicted serum levels of liver enzymes would be in patients with various types of liver disease and not necessarily the histologic severity or stage of disease.
5ConclusionsIn conclusion, the results of this study provide clinicians with predicted ranges of liver enzymes in patients with hepatocellular or cholestatic liver disease. In doing so, they may enhance a clinician's ability to identify patients with both forms of liver disease.AbbreviationsALT alanine aminotransferase aspartate aminotransferase alkaline phosphatase gamma-glutamyl transferase alcohol-induced liver disease upper limit of normal non-alcoholic fatty liver disease autoimmune hepatitis primary biliary cholangitis primary sclerosing cholangitis hepatitis C virus hepatitis B surface antigen anti-nuclear antibody smooth muscle antibody mitochondrial antibody drug-induced liver injury
Study concept and design – GYM; acquisition of data – DIF, MZ; analysis – DIF, JU, GYM; interpretation of data – DIF, GYM; drafting of the manuscript – DIF, GYM; statistical analysis – JU; obtained funding – GYM; technical support – DIF; study supervision – GYM.
Conflict of interestThe authors have no conflicts of interest to declare.
The authors wish to thank Ms R. Vizniak for her prompt and accurate typing of the manuscript.
This research did not receive any specific grant from funding agencies in the public, commercial, or not-for-profit sectors.


