


Background. Nutritional deficiencies may aggravate the course of chronic hepatitis C (CHC). Our aim has been to perform a comprehensive analysis of body composition and nutritional deficiencies in CHC patients in non-cirrhotic and compensated cirrhotic stages to correlate the detected deficiencies with the fibrosis stage.
Material and methods. Body multifrequency bioimpedance analysis (BIA) and a wide and simultaneous analytical profile were prospectively performed in 74 CHC patients (36 male) with known METAVIR fibrosis stage established with liver biopsy or transient elastography. Results were analyzed to identify deviations from the normal range and variations according to the fibrosis stage.
Results. Body fat compartment was greater in women. Body composition did not change among the 4 stages of liver fibrosis. Low levels (< 30 μg/L) of vitamin D were detected in 74.3% of patients irrespective of the fibrosis stage. Most analytical results remained into the normal range with the exceptions of thrombocytopenia and vitamin A deficiency, that were limited to the stage 4 of fibrosis, and low Zn and LDL-cholesterol values, that were frequently found in patients with advanced (F3 and F4) fibrosis stage.
Conclusion. Body composition and most biochemical parameters, including cyanocobalamin, folic acid and vitamin E, are well preserved in compensated patients with CHC, with the exception of generalized vitamin D insufficiency and of deficiencies of vitamin A and zinc that are restricted to the more advanced, although still compensated, stages of the disease.
Chronic hepatitis C (CHC) is a slowly progressive disease which severity ranges from a nearly normal liver function and structure to decompensated cirrhosis and hepatocellular carcinoma. The liver is a central organ for many metabolic and synthetic functions and stores essential nutrients. Hepatitis C virus (HCV)-induced liver damage may exert multiple deleterious effects on nutritional status and metabolic processes.
Hypercatabolism caused by chronic systemic inflammation and malabsorption induced by congestion of the intestinal wall secondary to portal hypertension are, among other factors, able to cause nutritional deficiencies and metabolic derangements in CHC, that are more severe in the cirrhotic stage,1 but are also present in a significant proportion of non-cirrhotic patients.2 Moreover, subtle nutritional deficits are not obvious at early stages of the disease.3 The aim of this study has been to perform a global and comprehensive evaluation of the nutritional deficiencies in patients with CHC in different stages of evolution, from the milder ones to compensated cirrhosis, including a wide spectrum of biochemical analysis and an objective measurement of body composition with electrical bioimpedance (BIA).
Material and MethodsThis is a prospective study including chronically HCV-infected outpatients attending to our Liver Unit from September 2013 to May 2014. Inclusion criteria were:
- •
Active chronic infection with HCV for more than 6 months.
- •
Known METAVIR stage of liver fibrosis4 disclosed by liver histology or transient elastography5 within the previous 12 months, and
- •
Written informed consent.
Exclusion criteria were:
- •
Coinfection with hepatitis B and/or human immunodeficiency viruses.
- •
Current drinking > 40 g/day of ethanol.
- •
Any anti-HCV therapy in the previous 12 months or vitamin and/or mineral supplements in the previous 6 months.
- •
Diabetes mellitus.
- •
Estimated glomerular filtrate < 60 mL/min/1.73 m2 and
- •
Decompensated cirrhosis (criteria of decompensation were current or past ascites, hepatic encephalopathy, bleeding varices, hepatocellular carcinoma and total serum bilirubin > 3.0 mg/dL. Ascites was excluded with ultrasonography).
All patients provided written informed consent according with the Declaration of Helsinki. The study was approved by the Ethics Committee of the Hospital Clínico San Carlos, Madrid, Spain.
For each patient, all the studies were performed in the same day. Height and body weight were measured to estimate the body mass index (weight in kg/height in m2). A venous blood sample was collected after overnight fast using a Vacutainer system (Becton Dickinson®, Franklin Lakes, USA). After 30 min, blood samples were centrifuged during 10 min in a refrigerated centrifuge and serum samples were stored at 4°C or at −80°C until analysis.
Routine haematological and biochemical analysis were performed by standard tests at our laboratory. More specifically, serum Zn and Cu were measured by atomic absortion, serum vitamin A and E measurements were performed using a kit from Chromsystems Diagnostics® (Munich, Germany) on a Shidmazu HPLC with UV detection at 325 and 295 nm. The calibration standard is traceable to NIST 968e reference material. Total 25(OH) vitamin D determination was performed by a competitive direct Immunoassay using chemoluminiscency on an Architect i1000 analyzer (Abbott Diagnostics, Wiesbaden, Germany). Retinol binding protein (RBP) was measured by immunonephelometry on a BN Prospec analyzer (Siemens Healthcare Diagnostics. Marburg. Germany).
Quantitative analysis of HCV-RNA was performed with the COBAS Ampliprep/COBAS Taqman HCV test (Roche Molecular Diagnostic, Madrid, Spain). The detection range was > 15.01 IU/m to < 6.907 IU/mL. Viral load was classified as low (< 400.000 IU/mL) or high (> 400.000 IU/mL), according to Witthöft, et al.6
HCV genotypes were determined by a reverse hybridization assay (VERSANT HCV Genotype 2.0 Assay (LiPA); Siemens Healthcare Diagnostics, Tarrytown, NYUSA). This is a line probe assay, for in vitro diagnostic use, which identifies hepatitis C Virus genotypes 1 to 6 and subtypes a and b of the genotype 1 in human serum or EDTA plasma samples, that uses sequence motifs from the core region in addition to the 5’UTR to improve the accuracy of the identification of 1a and 1b.
Body multifrequency BIA analysis was performed with a Bodystat Quadscan® (Sanro Instruments). Briefly, two pairs of electrodes were placed distally in the right hand and foot with the patient in supine, applying an intensity of 0.8 mAmp and progressively increasing frequencies of 5, 50, 100, and 200 KHz. Theoretically, lowest frequencies allow for estimation of extracellular water whereas the highest ones include the intracellular fat-free compartment. The crude data are then mathematically processed by specifically-designed software that quantifies the total, intra- and extracellular body water (TBW, IBW, and EBW, respectively), the proportion of fat mass (FM) and fat free mass (FFM), and the fat free dry mass (FFDM: the mineral and protein content of the body). Fat free mass index (FFMI) was estimated as the ratio: FFM (in kg)/height2. The phase angle (PA) was calculated from the crude electrical data resistance (R50) and reactance (Xc50) -arctn (Xc/ R) x (180°/π)−. Lower PA suggests cell death or decreased cell integrity, whereas higher PA suggests large quantities of intact cell membranes.7 The following were considered as low values: BMI < 18.5 kg/m2, FFMI < 15 and < 17 kg/m2 -in women and men respectively-; and high: FM > 25 and > 32% both in men and women.8,9 A phase angle value < 5.4o is considered under the normal limit.10
Fibrosis stage was established by liver biopsy in 30 cases and by transient elastography in the remaining 44 and was categorized in four categories, as transient elastography does not discriminate between F0 and F1.
Statistical analysisContinuous variables, expressed as median and interquartilic (IQ) range, were compared with the Student’ t test or the Mann-Whitney U test, each when adequate, depending on their Gaussian distribution. The Pearson/ Spearman correlation tests were used to express correlations between variables, depending whether these were or not normally distributed. Categorical variables, expressed as count and percentage, were compared with the χ2 or the Fisher exact tests, each when appropriate, and the effect of differences was established by calculating the odds ratio with the 95% confidence interval. Multiple comparisons were made with ANOVA or Kruskall-Wallis tests. A p value < 0.05 or a confidence interval not including the unit were considered significant. The statistical analysis was carried out with the SPSS software 22.0 (SPSS Inc. Chicago, Illinois, USA) and with EpiDat 3.1 software (Junta de Galicia, Spain) for specific tests.
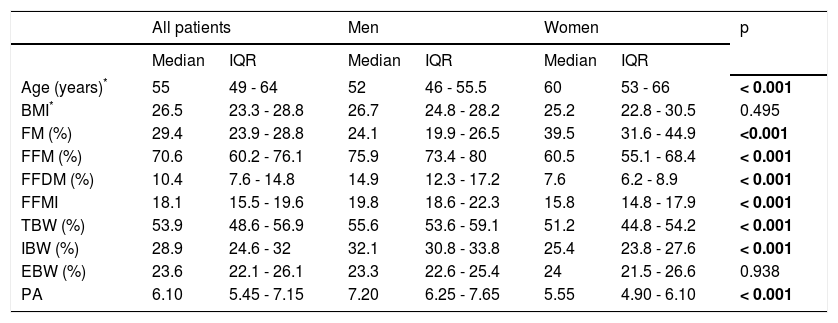
ResultsSeventy nine patients were selected for the study, but BIA failed in 5 as they were carriers of metallic prosthesis. The remaining 74 patients (36 male) were all of white European ancestry (73 Spaniards, 1 Ukrainian). Table 1 shows the results of BIA with intersex comparisons. Age is significantly correlated with body fat (p < 0.001). Women were significantly older, with more FM and less FFM and IBW than men.
Anthropometric characteristics of the studied population.
| All patients | Men | Women | p | ||||
|---|---|---|---|---|---|---|---|
| Median | IQR | Median | IQR | Median | IQR | ||
| Age (years)* | 55 | 49 - 64 | 52 | 46 - 55.5 | 60 | 53 - 66 | < 0.001 |
| BMI* | 26.5 | 23.3 - 28.8 | 26.7 | 24.8 - 28.2 | 25.2 | 22.8 - 30.5 | 0.495 |
| FM (%) | 29.4 | 23.9 - 28.8 | 24.1 | 19.9 - 26.5 | 39.5 | 31.6 - 44.9 | <0.001 |
| FFM (%) | 70.6 | 60.2 - 76.1 | 75.9 | 73.4 - 80 | 60.5 | 55.1 - 68.4 | < 0.001 |
| FFDM (%) | 10.4 | 7.6 - 14.8 | 14.9 | 12.3 - 17.2 | 7.6 | 6.2 - 8.9 | < 0.001 |
| FFMI | 18.1 | 15.5 - 19.6 | 19.8 | 18.6 - 22.3 | 15.8 | 14.8 - 17.9 | < 0.001 |
| TBW (%) | 53.9 | 48.6 - 56.9 | 55.6 | 53.6 - 59.1 | 51.2 | 44.8 - 54.2 | < 0.001 |
| IBW (%) | 28.9 | 24.6 - 32 | 32.1 | 30.8 - 33.8 | 25.4 | 23.8 - 27.6 | < 0.001 |
| EBW (%) | 23.6 | 22.1 - 26.1 | 23.3 | 22.6 - 25.4 | 24 | 21.5 - 26.6 | 0.938 |
| PA | 6.10 | 5.45 - 7.15 | 7.20 | 6.25 - 7.65 | 5.55 | 4.90 - 6.10 | < 0.001 |
BMI: body mass index. FM: fat mass. FFM: fat free mass. FFDM: fat free dry mass. FFMI: fat free mass index. TBW: total body water. IBW: intracellular body water. EBW: extracellular body water. PA: phase angle.
A BMI lower than 18.5 kg/m2 was detected in 1 patient (1.3%; F0-F1 stage).
Overweight (BMI > 25.0-29.9 kg/m2) and obesity (BMI > 30.0 kg/m2) were found in 40.5 and 17.6% respectively. Percentages of low FFMI and high FM were (men/ women) 2.9/28.9% and 38.9/73.7%. There were no statistical differences in these cut-off values by fibrosis stage, but the excess of FM was greater in women in F2-F4 stages (data not shown), and the only one man that had a low FFMI was classified in F4 stage.Two men (5.7%) and 14 women (36.8%), had phase angle values < 5.4o (p < 0.001); this difference was maintained across the four stages of fibrosis (data not shown).
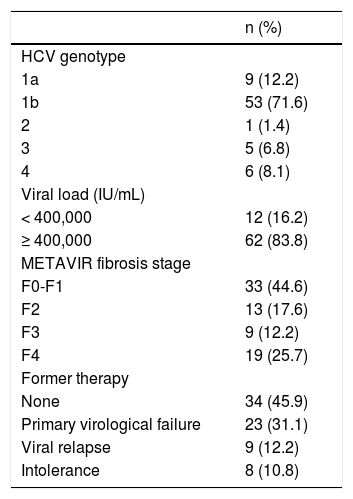
Hepatitis C virus-related parameters (viral genotype and viral load), result of previous therapies when administered, and METAVIR fibrosis stage are shown in table 2.
Epidemiological data of the HCV infection in the studied patients.
| n (%) | |
|---|---|
| HCV genotype | |
| 1a | 9 (12.2) |
| 1b | 53 (71.6) |
| 2 | 1 (1.4) |
| 3 | 5 (6.8) |
| 4 | 6 (8.1) |
| Viral load (IU/mL) | |
| < 400,000 | 12 (16.2) |
| ≥ 400,000 | 62 (83.8) |
| METAVIR fibrosis stage | |
| F0-F1 | 33 (44.6) |
| F2 | 13 (17.6) |
| F3 | 9 (12.2) |
| F4 | 19 (25.7) |
| Former therapy | |
| None | 34 (45.9) |
| Primary virological failure | 23 (31.1) |
| Viral relapse | 9 (12.2) |
| Intolerance | 8 (10.8) |
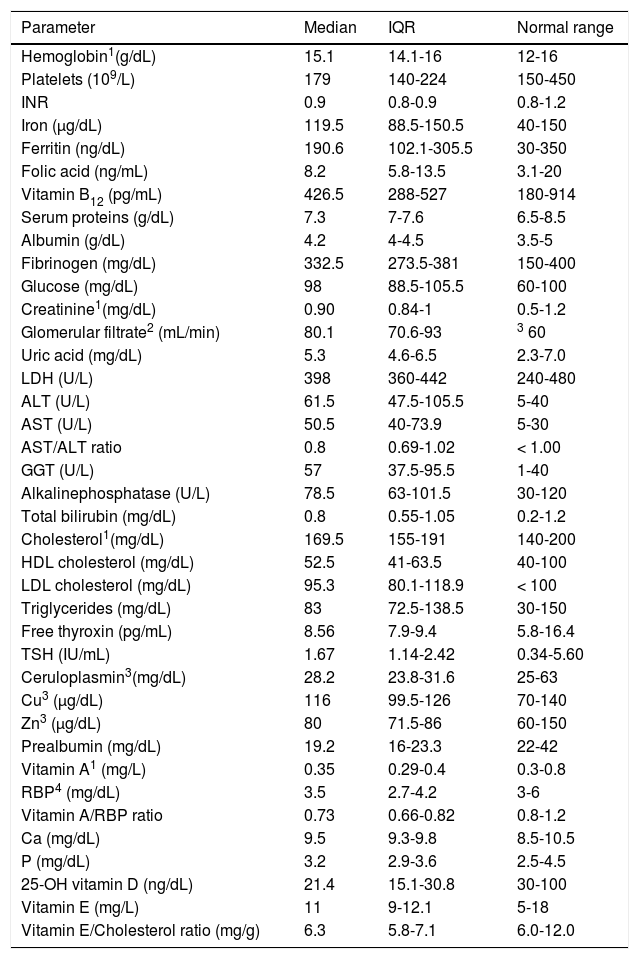
Table 3 summarizes all the haematological and biochemical results. The most significant deviations from the normal range were low platelet count (37.8% of cases) and low values for serum prealbumin (64.9%), vitamin A (70.3%), RBP4 (33.8%), vitamin A/RBP4 ratio (70.3%) and vitamin E/cholesterol ratio (33.8%). Serum vitamin D levels were normal (≥ 30 ng/dL) in 19 patients (25.7 %), whereas 26 patients (35.1 %) with values comprised between 20.0 and 29.9 ng/dL and 29 (39.2%) with values < 20 ng/dL were diagnosed of insufficiency and deficiency of vitamin D, respectively. On the contrary, a significant proportion of patients (more than 25% of cases for each variable) showed higher than normal values of blood glucose, aminotransferases (ALT, AST), gammaglutamyl transferase (GGT) and low density lipoprotein cholesterol (LDL cholesterol).
Haematological and biochemical parameters.
| Parameter | Median | IQR | Normal range |
|---|---|---|---|
| Hemoglobin1(g/dL) | 15.1 | 14.1-16 | 12-16 |
| Platelets (109/L) | 179 | 140-224 | 150-450 |
| INR | 0.9 | 0.8-0.9 | 0.8-1.2 |
| Iron (µg/dL) | 119.5 | 88.5-150.5 | 40-150 |
| Ferritin (ng/dL) | 190.6 | 102.1-305.5 | 30-350 |
| Folic acid (ng/mL) | 8.2 | 5.8-13.5 | 3.1-20 |
| Vitamin B12 (pg/mL) | 426.5 | 288-527 | 180-914 |
| Serum proteins (g/dL) | 7.3 | 7-7.6 | 6.5-8.5 |
| Albumin (g/dL) | 4.2 | 4-4.5 | 3.5-5 |
| Fibrinogen (mg/dL) | 332.5 | 273.5-381 | 150-400 |
| Glucose (mg/dL) | 98 | 88.5-105.5 | 60-100 |
| Creatinine1(mg/dL) | 0.90 | 0.84-1 | 0.5-1.2 |
| Glomerular filtrate2 (mL/min) | 80.1 | 70.6-93 | 3 60 |
| Uric acid (mg/dL) | 5.3 | 4.6-6.5 | 2.3-7.0 |
| LDH (U/L) | 398 | 360-442 | 240-480 |
| ALT (U/L) | 61.5 | 47.5-105.5 | 5-40 |
| AST (U/L) | 50.5 | 40-73.9 | 5-30 |
| AST/ALT ratio | 0.8 | 0.69-1.02 | < 1.00 |
| GGT (U/L) | 57 | 37.5-95.5 | 1-40 |
| Alkalinephosphatase (U/L) | 78.5 | 63-101.5 | 30-120 |
| Total bilirubin (mg/dL) | 0.8 | 0.55-1.05 | 0.2-1.2 |
| Cholesterol1(mg/dL) | 169.5 | 155-191 | 140-200 |
| HDL cholesterol (mg/dL) | 52.5 | 41-63.5 | 40-100 |
| LDL cholesterol (mg/dL) | 95.3 | 80.1-118.9 | < 100 |
| Triglycerides (mg/dL) | 83 | 72.5-138.5 | 30-150 |
| Free thyroxin (pg/mL) | 8.56 | 7.9-9.4 | 5.8-16.4 |
| TSH (IU/mL) | 1.67 | 1.14-2.42 | 0.34-5.60 |
| Ceruloplasmin3(mg/dL) | 28.2 | 23.8-31.6 | 25-63 |
| Cu3 (µg/dL) | 116 | 99.5-126 | 70-140 |
| Zn3 (µg/dL) | 80 | 71.5-86 | 60-150 |
| Prealbumin (mg/dL) | 19.2 | 16-23.3 | 22-42 |
| Vitamin A1 (mg/L) | 0.35 | 0.29-0.4 | 0.3-0.8 |
| RBP4 (mg/dL) | 3.5 | 2.7-4.2 | 3-6 |
| Vitamin A/RBP ratio | 0.73 | 0.66-0.82 | 0.8-1.2 |
| Ca (mg/dL) | 9.5 | 9.3-9.8 | 8.5-10.5 |
| P (mg/dL) | 3.2 | 2.9-3.6 | 2.5-4.5 |
| 25-OH vitamin D (ng/dL) | 21.4 | 15.1-30.8 | 30-100 |
| Vitamin E (mg/L) | 11 | 9-12.1 | 5-18 |
| Vitamin E/Cholesterol ratio (mg/g) | 6.3 | 5.8-7.1 | 6.0-12.0 |
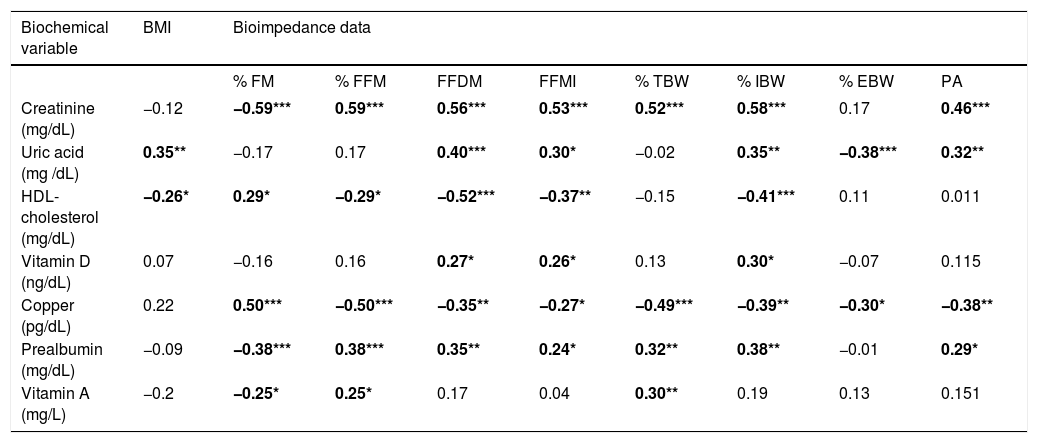
The study of correlations between results of BIA and laboratory data is summarized in table 4, that is restricted to the significant results (in bold).
| Biochemical variable | BMI | Bioimpedance data | |||||||
|---|---|---|---|---|---|---|---|---|---|
| % FM | % FFM | FFDM | FFMI | % TBW | % IBW | % EBW | PA | ||
| Creatinine (mg/dL) | −0.12 | −0.59*** | 0.59*** | 0.56*** | 0.53*** | 0.52*** | 0.58*** | 0.17 | 0.46*** |
| Uric acid (mg /dL) | 0.35** | −0.17 | 0.17 | 0.40*** | 0.30* | −0.02 | 0.35** | −0.38*** | 0.32** |
| HDL-cholesterol (mg/dL) | −0.26* | 0.29* | −0.29* | −0.52*** | −0.37** | −0.15 | −0.41*** | 0.11 | 0.011 |
| Vitamin D (ng/dL) | 0.07 | −0.16 | 0.16 | 0.27* | 0.26* | 0.13 | 0.30* | −0.07 | 0.115 |
| Copper (pg/dL) | 0.22 | 0.50*** | −0.50*** | −0.35** | −0.27* | −0.49*** | −0.39** | −0.30* | −0.38** |
| Prealbumin (mg/dL) | −0.09 | −0.38*** | 0.38*** | 0.35** | 0.24* | 0.32** | 0.38** | −0.01 | 0.29* |
| Vitamin A (mg/L) | −0.2 | −0.25* | 0.25* | 0.17 | 0.04 | 0.30** | 0.19 | 0.13 | 0.151 |
Results are shown as Spearman’s Rho coefficient Biochemical data not related with any of the bioimpedance data are not included in the table. Significant results are in bold: * p < 0.05; ** p < 0.01; *** p < 0.001. BMI: body mass index. FM: fat mass. FFM: fat free mass. FFDM: fat free dry mass. FFDI: fat free mass index. TBW: total body water. EBW: extracellular body water. ICW: intracellular body water. PA: phase angle.
A comparative analysis of all the epidemiological, hematological, biochemical, virological and BIA results was performed among these four fibrosis categories, and significant differences are shown in table 5.
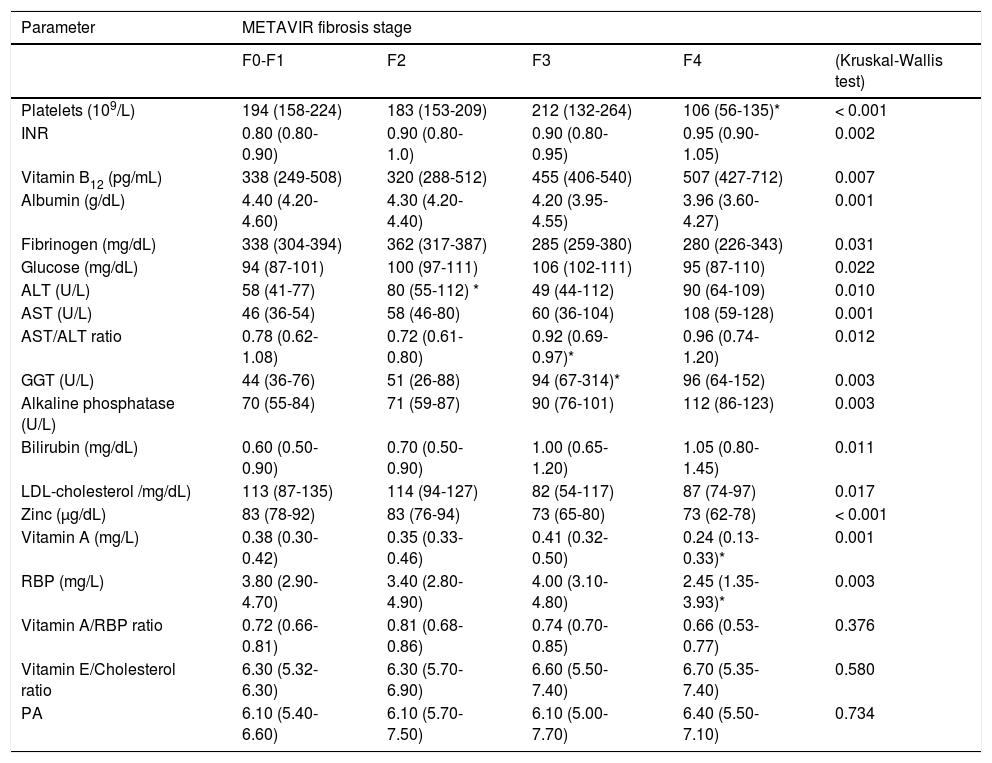
Relation of the fibrosis stage with the variables included in the study.
| Parameter | METAVIR fibrosis stage | ||||
|---|---|---|---|---|---|
| F0-F1 | F2 | F3 | F4 | (Kruskal-Wallis test) | |
| Platelets (109/L) | 194 (158-224) | 183 (153-209) | 212 (132-264) | 106 (56-135)* | < 0.001 |
| INR | 0.80 (0.80-0.90) | 0.90 (0.80-1.0) | 0.90 (0.80-0.95) | 0.95 (0.90-1.05) | 0.002 |
| Vitamin B12 (pg/mL) | 338 (249-508) | 320 (288-512) | 455 (406-540) | 507 (427-712) | 0.007 |
| Albumin (g/dL) | 4.40 (4.20-4.60) | 4.30 (4.20-4.40) | 4.20 (3.95-4.55) | 3.96 (3.60-4.27) | 0.001 |
| Fibrinogen (mg/dL) | 338 (304-394) | 362 (317-387) | 285 (259-380) | 280 (226-343) | 0.031 |
| Glucose (mg/dL) | 94 (87-101) | 100 (97-111) | 106 (102-111) | 95 (87-110) | 0.022 |
| ALT (U/L) | 58 (41-77) | 80 (55-112) * | 49 (44-112) | 90 (64-109) | 0.010 |
| AST (U/L) | 46 (36-54) | 58 (46-80) | 60 (36-104) | 108 (59-128) | 0.001 |
| AST/ALT ratio | 0.78 (0.62-1.08) | 0.72 (0.61-0.80) | 0.92 (0.69-0.97)* | 0.96 (0.74-1.20) | 0.012 |
| GGT (U/L) | 44 (36-76) | 51 (26-88) | 94 (67-314)* | 96 (64-152) | 0.003 |
| Alkaline phosphatase (U/L) | 70 (55-84) | 71 (59-87) | 90 (76-101) | 112 (86-123) | 0.003 |
| Bilirubin (mg/dL) | 0.60 (0.50-0.90) | 0.70 (0.50-0.90) | 1.00 (0.65-1.20) | 1.05 (0.80-1.45) | 0.011 |
| LDL-cholesterol /mg/dL) | 113 (87-135) | 114 (94-127) | 82 (54-117) | 87 (74-97) | 0.017 |
| Zinc (µg/dL) | 83 (78-92) | 83 (76-94) | 73 (65-80) | 73 (62-78) | < 0.001 |
| Vitamin A (mg/L) | 0.38 (0.30-0.42) | 0.35 (0.33-0.46) | 0.41 (0.32-0.50) | 0.24 (0.13-0.33)* | 0.001 |
| RBP (mg/L) | 3.80 (2.90-4.70) | 3.40 (2.80-4.90) | 4.00 (3.10-4.80) | 2.45 (1.35-3.93)* | 0.003 |
| Vitamin A/RBP ratio | 0.72 (0.66-0.81) | 0.81 (0.68-0.86) | 0.74 (0.70-0.85) | 0.66 (0.53-0.77) | 0.376 |
| Vitamin E/Cholesterol ratio | 6.30 (5.32-6.30) | 6.30 (5.70-6.90) | 6.60 (5.50-7.40) | 6.70 (5.35-7.40) | 0.580 |
| PA | 6.10 (5.40-6.60) | 6.10 (5.70-7.50) | 6.10 (5.00-7.70) | 6.40 (5.50-7.10) | 0.734 |
Data are shown as median (interquartilic range). All the results provided by BIA, anthropometry and haematology, biochemistry and virology laboratories were included in the analysis. Only significant or clinically relevant results are shown. The value of p in the last column reflects comparison among multiple groups. The asterisk (*) indicates that the signaled value is significantly different from the previous one. RBP: retinol binding protein. PA: phase angle.
Our results show that body composition defined by BIA does not change significantly throughout the four stages of liver fibrosis, from the normal or near normal stage (F0-F1)to the compensated cirrhosis stage (F4). No differences were found in none of the measured compartments (FM, FFM, FFDM, FFMI, IBW, and EBW) nor in PA through the whole spectrum of fibrosis, as determined with liver histology or transient elastography. Fat content was greater in women and correlated positively with age; therefore, this difference may be due in part to the older age of women in this series, but also to be a consequence of sexual dimorphism.
Data obtained by Kahraman, et al.11 in their study on a series of 37 CHC patients are hardly comparable to ours as these authors only discussed the changes induced in BIA results as a consequence of antiviral therapy. Oliveira, et al.,9 in a series of 125 CHC non-obese (BMI < 30 kg/m2) non-diabetic patients found that body fat was into their normal limits in 50% of their patients. These limits were taken from an old study and according to them also 50% of our patients should be considered as obese, although only 17.6% had a BMI > 30. The study of Oliveira, et al. does not provide information about the distribution of BIA-derived parameters according with the fibrosis stage.
Low FFMI has recently been proposed as diagnostic criteria for malnutrition.8 In our series low values were more frequent in women than in men, suggesting a better nutritional status in male sex. However, this parameter needs further validation before being included in the regular nutritional assessment. A BMI in the range of undernutrition (< 18.5 kg/m2) was only observed in a man with F0-1 fibrosis stage. Other tools to define the nutritional status were not employed, so the prevalence of malnutrition in our patients cannot be precisely defined.
Crude values of BIA have been used to assess the quality of body composition when the assumptions in the body compartments calculations are not met. PA has been related to the quantity and quality of cell membranes, and to the IBW/EBW distribution. In cirrhosis, values ≤ 5.4o have been associated with shorter survival time.12 The mean PA of our patients was 6.22o, clearly over that cut-off. However, 24.7% of them had a value ≤ 5.4o, without any statistical difference among the fibrosis stages (Table 5). This lack of difference by stage was also observed in a pilot study over 20 subjects with compensated mild or advanced fibrosis in CHC (7 and 7.1o in each group).13 Some researchers11,14 have described PA similar to ours in not treated patients while others have observed lower values.15 This discrepancy can be explained if the patients had different clinical status. In the last study the mean value of albumin was 2.8 g/dL, while in ours it was 4.3 g/dL, indicating a lower grade of liver synthesis derangement. Kahraman, et al.11 excluded the cases with low albumin levels. Fernandes, et al.14 compared several low-cost and highly reproducible methods to identify which one is the safest and more reliable in patients with cirrhosis. A total of 129 patients (70.5 Child class A, 43.4 HCV-induced) were included. There were marked discrepancies to establish the proportion of malnourished patients, being BIA in an intermediate position and the only method that shows statistical correlation with the Child-Pugh classification. In the study of Fernandes, et al., 34.1% of cirrhotic patients showed PA < 5.4o and were classified as malnourished; in our study only 3 patients in stage 4 of fibrosis (16.7%) were under this limit. This difference may be explained because all our patients were in Child class A.
From a functional point of view, HCV-induced liver damage may alter a great number of metabolic functions not directly related to the quantitative compartimental evaluation provided by BIA. Data shown in table 4 confirm the relation of serum levels of creatinine, prealbumin and uric acid with protein metabolism and protein body mass, whereas they suggest that body fat selectively stores copper.
In this study we have obtained a wide spectrum of analytical (mainly biochemical) data that offers a panoramic view of the nutritional status in the different stages of the disease. With minor exceptions, there are no significant changes in biochemical values between fibrosis stages 0-1 and 2. When fibrosis reaches the advanced stage F3, LDL cholesterol and zinc clearly decrease whereas GGT increases. It is necessary to reach the compensated cirrhotic stage (F4) to detect a decrease of platelet count and of vitamin A and retinol-binding protein levels and an increase of AST/ALT ratio. The remaining profiles shown in table 5, although reflecting significant changes, are of less clinical relevance because most of them remain into the normal range or their association with progressive liver damage is well known.
Zinc deficiency is common in advanced chronic liver disease.16–18 However, our results show that only in four of the sixty three cases in which this determination is available (6.3%) are the serum zinc levels slightly under the normal range; three of these patients were in stage F4 and one in F3. Data on serum copper in CHC are controversial;19-22 we have found normal levels in 58 of these 63 patients and slightly elevated in the remaining five. We have confirmed previous data22 indicating that serum copper is inversely correlated with GGT, possibly as a consequence of incipient cholestasis (rho = − 0.285, p = 0.025).
Several studies have shown that vitamin D deficiency is very common in patients with chronic hepatitis C virus infection,23–27 as confirms the present study. Vitamin D deficiency is associated with poor response to interferonbased therapy in patients with CHC28–30 and vitamin D supplementation may improve the rate of sustained viral response to interferon-based therapy,31,32 although in the era of direct antiviral agents the relevance of this influence must to be evaluated.
The effect of antioxidant therapy on aminotransferase levels in CHC, including vitamin E supplements, has been evaluated in several clinical studies summarized in a recent meta-analysis,33 but the study of serum levels of vitamin E in these patients has been neglected and the sample size of the original series included in the meta-analysis is very small. Bandara, et al.34 in a series of 247 CHC patients, reported that plasma vitamin E is well within the reference range and is not related to necroinflammatory grade or fibrosis stage in chronic hepatitis C. In this study, we have detected normal levels of Vitamin E in 97.2% of our patients, but the vitamin E-cholesterol ratio, that is considered as an indirect criteria of vitamin E inadequacy,35 was lower than normal in 33.8% of them, without differences according to the fibrosis stage. The clinical significance, if any, of this finding, should be evaluated in future studies.
Approximately 95% of serum vitamin A is transported by RBP (or RBP4), that is the final product of the RBP4 gene forming a circulating complex that is protected from renal filtration by the stabilizing effect of its union to transthyretin.36 Therefore, the serum level of vitamin A directly depends on the concentration of RBP4, that is synthesized mainly in the liver and at a lower level in adipose tissue.37 Retinol binding protein is accumulated as pro-RBP in the hepatocytes before its union to the incoming absorbed vitamin A and excretion to the sinusoidal blood. Plasma RBP4 levels positively correlate with retinol levels.38 Retinol status can influence circulating RBP4 levels and vice versa. Serum vitamin A levels have been used as a measure of vitamin deficiency in chronic hepatitis C by several groups that reported that they decline in parallel to increasing liver damage.39–41 In accordance with this, we have found low levels of vitamin A in 28.4% of our patients but the lower levels were nearly limited to patients in stage F4, in parallel with a simultaneous decline of serum RBP4, being both parameters strongly correlated (r2 = 0.783). Several authors have proposed as a better tool to evaluate true vitamin A deficiency the retinol-to-RBP4 ratio with a cut-point < 0.8 as indicative of retinol deficiency,42 a criterion that classifies 70.3% of our patients as vitamin A deficient but, again, mainly those in the F4 stage. RBP4 has been recently identified as an adipokine associated with the risk of type 2 diabetes mellitus37,43 and a relative excess of RBP4 in relation to retinol may reflect insulin resistance instead of retinol deficiency.38 Having all these factors present (retinol and RBP4 serum levels, retinol-to-RBP4 ratio and fibrosis stage) seems to be the most adequate way to establish if true retinol deficiency is present in CHC. In cirrhotic patients with low levels of vitamin A but with normal or near-normal values of vitamin A-to-RBP ratio, vitamin A supplementation may have deleterious consequences due to a toxic increase of liver vitamin A stores.
Our study has several limitations. Firstly, the sample size was not calculated, mainly because there were no previous studies on BIA in CHC covering the whole range of fibrosis stages; hence, we include all available patients. On the other side, the stage of fibrosis was established by two different methods (i.e. liver biopsy and transient elastography) not always coincidental.5 Finally, the lack of histoogical study in most cases impeded us to know the necroinflammatory grade and it is well known that some biochemical parameters included in the study may behave as acute phase reactants, positive, as ferritin and cerulolasmin, or negative, as serum levels of RBP4 and prealumin.44
ConclusionIn this group of patients with chronic hepatitis C covering a wide spectrum of fibrosis, from METAVIR F0-1 to compensated cirrhosis (METAVIR F4, Child-Pugh class A), we found that body composition, as evaluated by BIA, is well preserved and is not influenced by the fibrosis stage. Synthetic and metabolic functions of the liver are in general well preserved. We have found no significant alterations of serum trace elements (Zn and Cu). Vitamin D deficiency is very common in CHC, as previously reported. Lower than normal levels of vitamin A are frequently found in the most advanced stages of CHC, although their close relation with serum levels of retinol binding protein, that in turn are influenced by systemic low-grade inflammation and insulin resistance, makes it difficult to interpret this finding as the sole consequence of true vitamin A deficiency.
Abbreviations- •
BIA: bioimpedance analysis
- •
BMI: body mass index.
- •
CHC: chronic hepatitis C
- •
EBW: extracellular body water.
- •
FFDM: fat free dry mass.
- •
FFM: fat free mass.
- •
FFMI: fat free mass index
- •
FM: fat mass.
- •
HCV: hepatitis C virus.
- •
IBW: intracellular body water.
- •
PA: phase angle.
- •
RBP4: retinol binding protein 4.
- •
TBW: total body water.
- •
Planning and conducting the study: José M. Ladero, Beatriz Mateos-Muñoz.
- •
Drafting the manuscript: José M. Ladero, María P. Matía-Martín, Beatriz Mateos-Muñoz.
- •
Interpreting data: José M. Ladero, Beatriz Mateos-uñoz, María P. Matía-Martín.
- •
Performing BIA studies: Angélica Larrad-Sáinz.
- •
Performing Biochemical studies: María J. Torrejón, María C. Cárdenas.
- •
Performing virological studies: Avelina Suárez.
- •
Performing pathological studies: Luis Ortega-Medina.
- •
Performing ustrasonography and elastography: María J. Devesa-Medina.
- •
Collecting data: Beatriz Mateos-Muñoz, Enrique Reyíaz-Rubio, José M. Ladero.
None.
Potential Competing InterestNone.


