


Aims. To define the prevalence and clinical characteristics of glucose metabolism disorders (GMD) in patients with compensated liver cirrhosis (LC).
Material and methods. Fasting plasma glucose (FPG) levels were measured to 130 patients with clinically stable LC. Oral glucose tolerance tests (OGTT) and fasting plasma insulin determinations were performed to patients with normal FPG. Insulin resistance (IR) was calculated with HOMA2-IR index. GMD were classified according to FPG and OGTT tests results and to the chronologic relation between diagnosis of diabetes mellitus (DM) and LC as follows: type-2 DM (T2DM), hepatogenous diabetes (HD) and impaired glucose tolerance. Patients from all groups were compared.
Results. The prevalence of GMD were as follows: T2DM in 25 patients (19.2%, 95% CI 12.5-25.9), HD in 28 (21.5%, 95% CI 14.5-28.5) and IGT in 36 (38.5%, 95% CI 30.1-46.7). The total of patients with GMD was 79.2% (95% CI 72.3-86.1). In 41% of cases GMD were subclinical and 48.7% of patients had IR. Patients with T2DM had a higher number of variables with significant differences compared with the other groups (more marked compared to the patients without GMD). The only differences between the patients with T2DM and HD were hypercreatininemia: 1.14 ± 0.53 vs. 0.84 ± 0.22 mg/dL (p = 0.005) and family history of DM: 8 (32%) vs. 2 (7%) (p = 0.02).
Conclusion. Almost 80% of patients with compensated LC had GMD. Half of them were subclinical. The patients with T2DM had marked clinical differences compared to patients from the other groups, particularly renal impairment.
Overt diabetes mellitus (DM) is observed in 21 to 40% of patients with liver cirrhosis (LC).1 There are two ways in which DM is related to LC: firstly, type 2 diabetes mellitus (T2DM), which is often associated with metabolic syndrome, causes chronic liver disease (steatosis, steatohepatitis, and LC).2–4 Secondly, LC may cause impaired glucose tolerance (IGT) and DM.5,6 During the initial stages of LC these glucose metabolism disorders (GMD) may be sub-clinical as only can be detected by an oral glucose tolerance test (OGTT).7 As liver disease progresses, they become clinically evident.8,9
Diabetes mellitus secondary to LC is known as “hepatogenous diabetes” (HD).5,6 Although it has been accepted that the LC is a diabetogenic condition.10,11 HD is not recognized by the American Diabetes Association (ADA) and the World Health Organization (WHO).12,13 Cirrhosis caused by alcohol, HCV, and hemochromatosis are more frequently associated to HD than other etiologies.5 In short, T2DM and HD have different etiology, but they seem to have similar pathophysiologic mechanisms for liver function deterioration. They increase the risk of complications and death.14–17
In recent years, the incidence of obesity has increased alarmingly in the world, particularly in the Western countries.18 In Mexico, overweight and obesity, which are suffered by about 70% of the adult population, are a serious public health problem. The incidence of T2DM and metabolic syndrome has increased rapidly in our country.19 They have become the most common causes of cryptogenic cirrho-sis.20,21
Although the comorbid association between LC and DM is known long time ago, clinical distinction between T2DM and HD has not been clearly determined; additionally, subclinical GMD are not routinely searched and the clinical profiles of cirrhotic patients with different forms of GMD have not been defined. Based on the aforementioned, the aims of the present study were:
- •
To establish the prevalence of clinical and subclinical forms of GMD in a cohort of patients with well compensated LC of diverse etiology, and
- •
To determine the clinical and biochemical characteristics of patients with these different forms of GMD and to find whether there are significant differences among them.
Patients with LC, who came to our hospital from August 2007 to August 2010, were prospectively evaluated. A cohort of 130 patients was selected randomly. The patients were older than 18 years, with LC of diverse etiology. Diagnosis of cirrhosis was made by liver biopsy or a combination of clinical and laboratory data and imaging studies. Patients with clinical complications due to liver disease were eliminated: hepatocellular carcinoma, alcoholic hepatitis, active gastrointestinal bleeding, clinically or ultrasonographically detected ascites, clinically evident hepatic encephalopathy (according with West Haven criteria), hepatorenal syndrome, and severe infection. Patients under effective treatment of previously detected ascites, portal hypertension or hepatic encephalopathy were included. In order to avoid confounding results of plasma glucose tests patients with acute and chronic pancreatitis, pancreatic cancer and pancreatectomy, endocrinopathies (such as Cushing syndrome, acromegaly, glucagonoma, and pheochromocytoma) and those with chronic ingestion of corticosteroids were excluded.
The study was approved by The Research and Ethics Committee of School of Medicine of the Autonomous University of Nuevo Leon in Monterrey.
All patients were tested for fasting plasma glucose (FPG) levels twice on different days separated by at least 8 days. Treatment (hypoglycemic drugs or insulin) of previously diagnosed DM was discontinued the day of testing. According to ADA criteria, the following definitions were considered:12
- •
DM: plasma glucose levels > 125 mg/dL.
- •
IGT: plasma glucose levels > 100 and < 125 mg/dL, and
- •
Normal FPG = plasma glucose levels < 100 mg/dL.
Fasting plasma insulin (FPI) levels were measured and an oral glucose tolerance test (OGTT) was performed to patients with normal FPG in the laboratory of Endocrinology Department. The OGTT was performed as follows according to the WHO criteria:13 patients fasted for at least 12 h, and baseline blood glucose was measured; then, they were given an oral glucose load (75 g), and after that plasma glucose was measured every half hour during a period of 2-h. The results were interpreted as follows:
- •
Normal glucose tolerance (NGT) if 2-h PG was < 140 mg/dL.
- •
IGT if 2-h PG was > 140 mg/dL, but < 200 mg/dL, and
- •
DM if 2-h PG was > 200 mg/dL.
FPI was measured by electrochemiluminescence (normal values = 2.6-24.9 μUI/mL). HOMA2-IR index (homeostasis model assessment) was calculated using the HOMA2-IR calculator program (http://www.dtu.ox.ac.uk/homacalculator/index.php). A value > 2 was arbitrarily established for defining IR.22
Clinical forms of GMDIn order to study prevalence of clinical forms of GMD and to define clinical characteristics of them, four groups of patients were formed based on the following criteria:
- •
The results of FPG and OGTT, and
- •
The chronological relationship between the diagnosis of DM or IGT and the diagnosis of cirrhosis:
- ○
Group 1-T2DM:
- a)
FPG or OGTT diagnosing DM.
- b)
DM detected before the diagnosis of cirrhosis.
- c)
Absence of other cause of diabetes or hyperglycemia.
- a)
- ○
Group 2-HD:
- a)
FPG or OGTT diagnosing DM.
- b)
DM detected at the same time or after the diagnosis of cirrhosis.
- c)
Absence of other causes of diabetes or hyperglycemia.
- a)
- ○
Group 3-IGT:
- a)
FPG or OGTT diagnosing IGT.
- b)
IGT detected at the same time or after the diagnosis of cirrhosis.
- c)
Absence of other causes of IGT.
- a)
- ○
Group 4-NGT: with normal FPG and OGTT.
- ○
In a database especially designed for the study were recorded: demographic characteristics (gender, age, and family history of DM), and laboratory blood tests (hemoglobin, leukocytes, platelets, BUN, creatinine, albumin, bilirubin, AST, γ-GT, alkaline phosphatase, cholesterol, tri-glycerides, and INR).
The body mass index (BMI) was calculated, and was interpreted as follows: normal if < 25, overweight if > 25 and < 30, and obesity if > 30.18
The etiology of cirrhosis was determined as follows: Alcohol-related cirrhosis was determined when daily alcohol consumption was of > 80 g in men and > 40 g in women for at least 10 years with negative viral, metabolic and autoimmune markers. Diagnosis of hepatitis C virus and B virus related cirrhosis was determined with specific viral markers (HBsAg or anti-HCV). Autoimmune liver disease was diagnosed with specific autoimmune markers (anti-nuclear antibodies, anti-smooth muscle antibodies or liver-kidney anti-microsomal antibodies), meanwhile cryptogenic cirrhosis was established in the absence of any of the causes above described.23
Liver function was estimated by Child-Pugh classification and MELD (Model for End-Stage Liver Disease).24,25
Statistical analysisMeans and standard deviations were used to express parametric variables; relative proportions, medians, and interquartile ranges were used to express nonparametric variables. The prevalence of the GMD was expressed by relative proportions using 95% confidence intervals (95% CI).
The means of the variables of the study groups were compared using analysis of variance (ANOVA). The variables, in which significant differences were detected by this method, were compared among clinical groups using parametric (Student’s t test) and nonparametric tests (chi square test, Fisher exact test, and median test) according to the type of variables. A two-tailed p-value < 0.05 was considered significant. All statistical analyses were done using the statistical package SPSS v17.0 (Chicago, Illinois, USA).
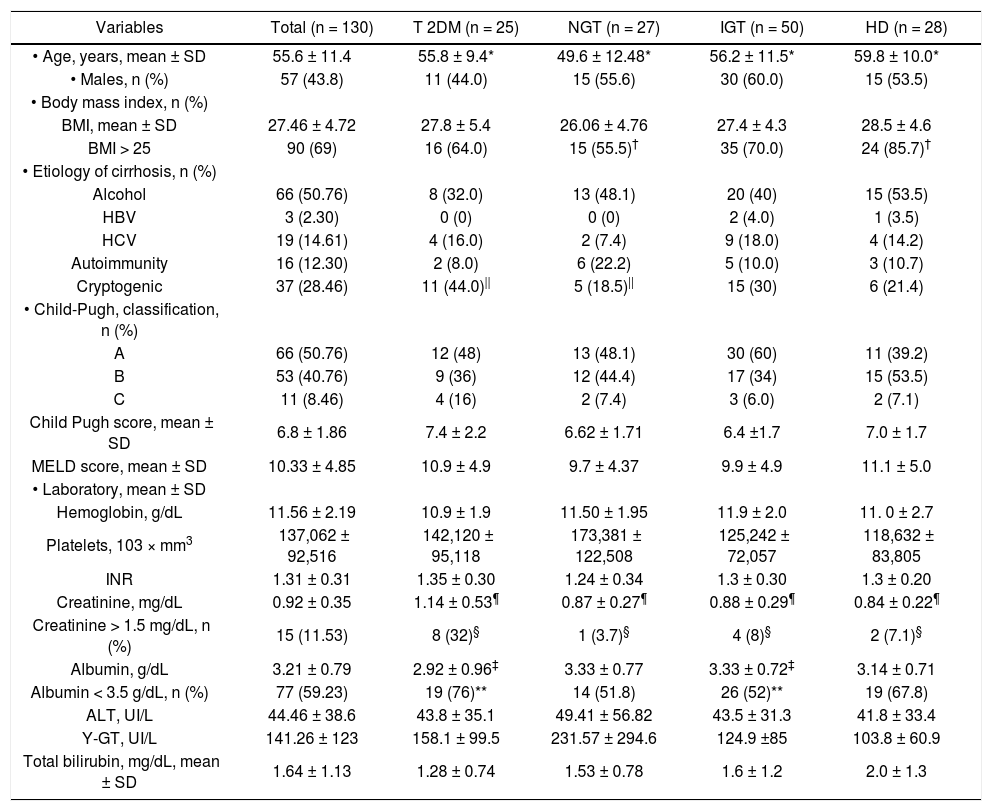
ResultsPatient populationIn total, 130 patients were included. The clinical and biochemical characteristics are shown in tables 1 and 2. The mean age was 55.6 ± 11.4 years. Family history of DM (at least one first-line family member affected) was identified in 16 patients (12.3%), 22 (36%) had hypertriglyceridemia (serum triglycerides > 150 mg/dL), and 18 (13.8%) had arterial hypertension. Seventeen of the 43 (32%) patients with diabetes were treated with insulin and 16 (30%) with oral hypoglycemic drugs. The most patients (69%) were overweight or obese, and the etiology of cirrhosis was predominantly alcoholic and cryptogenic (50.7 and 28.4%, respectively). The diagnosis of cirrhosis was made by liver biopsy in 42 (32.3%) patients. Half of the patients belonged to Child-Pugh Group A (50.7%) and had a mean MELD score of 10.3 ± 4.8. The most significant abnormalities found in laboratory tests were: hypercreatininemia (serum creatinine > 1.2 mg/dL) in 15 (11.5%) patients and hypoalbuminemia (serum albumin < 3.5 mg/dL) in 77 (59.2%) patients.
Clinical and biochemical characteristics of 130 cirrhotic patients with glucose metabolism disorders (GMD).
| Variables | Total (n = 130) | T 2DM (n = 25) | NGT (n = 27) | IGT (n = 50) | HD (n = 28) |
|---|---|---|---|---|---|
| • Age, years, mean ± SD | 55.6 ± 11.4 | 55.8 ± 9.4* | 49.6 ± 12.48* | 56.2 ± 11.5* | 59.8 ± 10.0* |
| • Males, n (%) | 57 (43.8) | 11 (44.0) | 15 (55.6) | 30 (60.0) | 15 (53.5) |
| • Body mass index, n (%) | |||||
| BMI, mean ± SD | 27.46 ± 4.72 | 27.8 ± 5.4 | 26.06 ± 4.76 | 27.4 ± 4.3 | 28.5 ± 4.6 |
| BMI > 25 | 90 (69) | 16 (64.0) | 15 (55.5)† | 35 (70.0) | 24 (85.7)† |
| • Etiology of cirrhosis, n (%) | |||||
| Alcohol | 66 (50.76) | 8 (32.0) | 13 (48.1) | 20 (40) | 15 (53.5) |
| HBV | 3 (2.30) | 0 (0) | 0 (0) | 2 (4.0) | 1 (3.5) |
| HCV | 19 (14.61) | 4 (16.0) | 2 (7.4) | 9 (18.0) | 4 (14.2) |
| Autoimmunity | 16 (12.30) | 2 (8.0) | 6 (22.2) | 5 (10.0) | 3 (10.7) |
| Cryptogenic | 37 (28.46) | 11 (44.0)|| | 5 (18.5)|| | 15 (30) | 6 (21.4) |
| • Child-Pugh, classification, n (%) | |||||
| A | 66 (50.76) | 12 (48) | 13 (48.1) | 30 (60) | 11 (39.2) |
| B | 53 (40.76) | 9 (36) | 12 (44.4) | 17 (34) | 15 (53.5) |
| C | 11 (8.46) | 4 (16) | 2 (7.4) | 3 (6.0) | 2 (7.1) |
| Child Pugh score, mean ± SD | 6.8 ± 1.86 | 7.4 ± 2.2 | 6.62 ± 1.71 | 6.4 ±1.7 | 7.0 ± 1.7 |
| MELD score, mean ± SD | 10.33 ± 4.85 | 10.9 ± 4.9 | 9.7 ± 4.37 | 9.9 ± 4.9 | 11.1 ± 5.0 |
| • Laboratory, mean ± SD | |||||
| Hemoglobin, g/dL | 11.56 ± 2.19 | 10.9 ± 1.9 | 11.50 ± 1.95 | 11.9 ± 2.0 | 11. 0 ± 2.7 |
| Platelets, 103 × mm3 | 137,062 ± 92,516 | 142,120 ± 95,118 | 173,381 ± 122,508 | 125,242 ± 72,057 | 118,632 ± 83,805 |
| INR | 1.31 ± 0.31 | 1.35 ± 0.30 | 1.24 ± 0.34 | 1.3 ± 0.30 | 1.3 ± 0.20 |
| Creatinine, mg/dL | 0.92 ± 0.35 | 1.14 ± 0.53¶ | 0.87 ± 0.27¶ | 0.88 ± 0.29¶ | 0.84 ± 0.22¶ |
| Creatinine > 1.5 mg/dL, n (%) | 15 (11.53) | 8 (32)§ | 1 (3.7)§ | 4 (8)§ | 2 (7.1)§ |
| Albumin, g/dL | 3.21 ± 0.79 | 2.92 ± 0.96‡ | 3.33 ± 0.77 | 3.33 ± 0.72‡ | 3.14 ± 0.71 |
| Albumin < 3.5 g/dL, n (%) | 77 (59.23) | 19 (76)** | 14 (51.8) | 26 (52)** | 19 (67.8) |
| ALT, UI/L | 44.46 ± 38.6 | 43.8 ± 35.1 | 49.41 ± 56.82 | 43.5 ± 31.3 | 41.8 ± 33.4 |
| Y-GT, UI/L | 141.26 ± 123 | 158.1 ± 99.5 | 231.57 ± 294.6 | 124.9 ±85 | 103.8 ± 60.9 |
| Total bilirubin, mg/dL, mean ± SD | 1.64 ± 1.13 | 1.28 ± 0.74 | 1.53 ± 0.78 | 1.6 ± 1.2 | 2.0 ± 1.3 |
NGT: normal glucose tolerance. IGT: impaired glucose tolerance. HD: hepatogenous diabetes. BMI: body mass index. HBV: hepatitis B virus. HCV: hepatitis C virus. MELD: model for end stage liver disease. INR: international normalized ratio. ALT: alanine aminotransferase. γ-GT: γ-glutamy-ltransferase. P values:
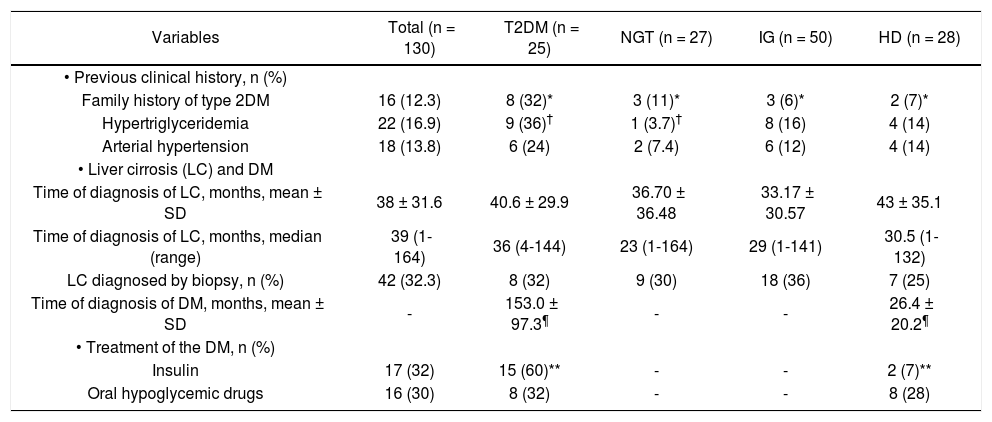
Clinical characteristics of 130 cirrhotic patients with glucose metabolism disorders.
| Variables | Total (n = 130) | T2DM (n = 25) | NGT (n = 27) | IG (n = 50) | HD (n = 28) |
|---|---|---|---|---|---|
| • Previous clinical history, n (%) | |||||
| Family history of type 2DM | 16 (12.3) | 8 (32)* | 3 (11)* | 3 (6)* | 2 (7)* |
| Hypertriglyceridemia | 22 (16.9) | 9 (36)† | 1 (3.7)† | 8 (16) | 4 (14) |
| Arterial hypertension | 18 (13.8) | 6 (24) | 2 (7.4) | 6 (12) | 4 (14) |
| • Liver cirrosis (LC) and DM | |||||
| Time of diagnosis of LC, months, mean ± SD | 38 ± 31.6 | 40.6 ± 29.9 | 36.70 ± 36.48 | 33.17 ± 30.57 | 43 ± 35.1 |
| Time of diagnosis of LC, months, median (range) | 39 (1-164) | 36 (4-144) | 23 (1-164) | 29 (1-141) | 30.5 (1-132) |
| LC diagnosed by biopsy, n (%) | 42 (32.3) | 8 (32) | 9 (30) | 18 (36) | 7 (25) |
| Time of diagnosis of DM, months, mean ± SD | - | 153.0 ± 97.3¶ | - | - | 26.4 ± 20.2¶ |
| • Treatment of the DM, n (%) | |||||
| Insulin | 17 (32) | 15 (60)** | - | - | 2 (7)** |
| Oral hypoglycemic drugs | 16 (30) | 8 (32) | - | - | 8 (28) |
NGT: normal glucose tolerance. HD: hepatogenous diabetes. IGT: impaired glucose tolerance. P values:
Based on FPG, 36 of the 130 patients had DM (27.6%), 14 (10.7%) had IGT and 80 (61.5%) patients had normal FPG (Figure 1).
. LC: liver cirrhosis. IGT: impaired glucose tolerance.")
After OGTT, 17 (13.4%) patients had DM, 36 (27.6%) had IGT, and 27 (20.7%) had NGT. Of the 36 patients with overt DM, 25 (19.2%) had T2DM and 11 (8.4%) had HD. In only 4 of the 11 latter patients, diagnosis of DM and LC was simultaneously established (Figure 1).
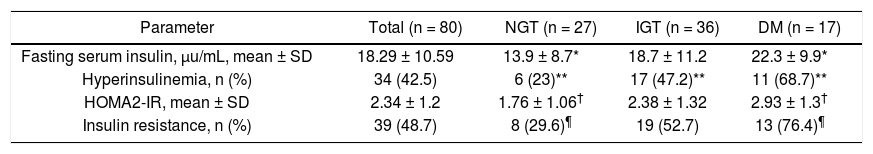
FPI and HOMA2-IR indexIn all patients mean FPI was 18.2 ± 10.5 U/mL, hyperinsulinemia was found in 42.5% of patients, mean HOMA2-IR index was 2.34 ± 1.2, and 48.7% had IR (Table 3). Significant differences between patients with NGT and those with HD were found as regards all parameters mentioned above.
Fasting plasma insulin, HOMA2-IR values and insulin resistance in 80 cirrhotic patients according to results of OGTT.
| Parameter | Total (n = 80) | NGT (n = 27) | IGT (n = 36) | DM (n = 17) |
|---|---|---|---|---|
| Fasting serum insulin, μu/mL, mean ± SD | 18.29 ± 10.59 | 13.9 ± 8.7* | 18.7 ± 11.2 | 22.3 ± 9.9* |
| Hyperinsulinemia, n (%) | 34 (42.5) | 6 (23)** | 17 (47.2)** | 11 (68.7)** |
| HOMA2-IR, mean ± SD | 2.34 ± 1.2 | 1.76 ± 1.06† | 2.38 ± 1.32 | 2.93 ± 1.3† |
| Insulin resistance, n (%) | 39 (48.7) | 8 (29.6)¶ | 19 (52.7) | 13 (76.4)¶ |
NGT: normal glucose tolerance. IGT: impaired glucose tolerance. DM: diabetes mellitus. OGTT: oral glucose tolerance test. HOMA: homeostatic model assessment. P values:
Prevalence of clinical forms of GMD was as follows:
- •
T2DM. 25 patients (19.2%, 95% CI 12.5-25.9).
- •
HD. 28 patients (21.5%, 95% CI 14.5-28.5) (11 overt and 17 subclinical).
- •
IGT. 50 patients (38.5%, 95% CI 30.1-46.7) (14 overt and 36 subclinical).
The total of patients with GMD was 79.2%, 95% CI 72.3-86.1 (41% subclinical) (Figure 2).
 of clinical forms of glucose metabolism disorders (GMD) in patients with liver cirrhosis. HD, hepatogenous diabetes. IGT: impaired glucose tolerance. IR: insulin resistance.")
The demographic, clinical, and biochemical characteristics of patients in all clinical groups are shown in tables 1 and 2. The patients with T2DM had statistically significant differences in 8 of the 26 variables studied in all groups. These patients had significant differences in 6 variables as compared to NGT group:
- •
Age (55.8 ± 4.9 vs. 49.9 ± 12.4 years, p = 0.05).
- •
Family history of DM (32 vs. 11%, p = 0.02).
- •
Hypertriglyceridemia (36 vs. 3.7%, p = 0.003).
- •
Cryptogenic etiology of LC (44 vs. 18.5%, p = 0.04).
- •
Serum creatinine (1.14 ± 0.53 vs. 0.87 ± 0.27 mg/dL, p = 0.04), and
- •
Hypercreatininemia (32 vs. 3.7%, p = 0.02).
T2DM patients also had significant differences in 5 variables as compared to patients with IGT:
- •
Family history of diabetes (32 vs. 6%, p = 0.02).
- •
Serum creatinine (1.14 ± 0.53 vs. 0.88 ± 0.29 mg/dL, p = 0.006).
- •
Hypercreatininemia (32 vs. 8%, p = 0.002).
- •
Serum albumin (2.92 ± 0.96 vs. 3.33 ± 0.72 g/dL, p = 0.04), and
- •
Hypoalbuminemia (76 vs. 52%, p = 0.04).
Finally, significant differences were observed in only 3 variables between patients with T2DM and HD:
- •
Serum creatinine (1.14 ± 0.53 vs. 0.84 ± 0.22 mg/dL, p = 0.005).
- •
Hypercreatininemia (32% vs. 7.1%, p = 0.02), and
- •
Family history of diabetes (32 vs. 7%, p = 0.02).
T2DM patients also had a significantly longer time of diagnosis (153 ± 97.3 vs. 26.2 ± 20.2 months, p = 0.00001) and a higher frequency of insulin therapy (60 vs. 7%, p = 0.00001) as compared to HD patients. Figure 3 shows six discrete variables that showed statistically significant differences between patients with T2DM and the other groups.

Some variables of the patients from T2DM group which were significantly different compared to patients from the other groups. *p < 0.05. HD: hepatogenous diabetes. IGT: impaired glucose tolerance. LC: liver cirrhosis. Cr: serum cratinine. Alb: serum albumin. FH: family history. TGL: serum triglycerides.
Very few significant differences were observed among patients with NGT, IGT and HD, except that the first-mentioned patients were significantly younger and had less abnormal BMI than those from the other groups. Finally, no differences were found between IGT and HD groups.
No statistically significant differences were found in relation Child Pugh or MELD scores between the groups.
DiscussionAlthough the comorbid association between LC and DM is known some time ago, most published studies do not make a clinical distinction between T2DM and HD; additionally, subclinical GMD are not routinely identified, so the magnitude of the problem is often underestimated.1,9,10,26 On the other hand, the clinical and biochemical features of cirrhotic patients with different types of GMD have not been studied. The clinical profiles of patients with GMD may be useful for prognosis and therapeutic assessments.
Our study is relevant because it prospectively defined the prevalence of T2DM, HD and IGT (overt and subclinical) in patients with cirrhosis of diverse etiology. As a result of this, almost 80% had some GMD. Moreover, if patients with NGT showing only IR were added, this figure would rise to 85%. This high prevalence contrasts with other studies reporting only overt DM in 25 to 30% of patients with LC.1,16,26
Our study also attempted for the first time to define the clinical profiles of patients with different forms of GMD. It must be remembered that the relationship between DM and LC is very complex due to multiple factors interacting in the etiology and pathophysiology in both entities either associated or isolated.10,27 As a proof of this, it has been observed that HCV core protein is able to induce insulin resistance, steatosis and diabetes mellitus, nevertheless obese patients with chronic HCV liver disease are more likely prone to develop IR and DM than non-obese patients.28,29 In addition asymptomatic liver cirrhosis due to diabetes may be difficult to detect in patients with T2DM and metabolic syndrome and in the other hand some T2DM patients with LC may have other causes of liver disease (HCV, alcohol, hemochromatosis, etc.). Therefore an accurate clinical differentiation between T2DM and HD in cirrhotic patients may be difficult.5,27
In the absence of a validated classification of patients with cirrhosis and diverse clinical forms of GMD, we thought that a simple and practical method to differentiate them was the division in T2DM, HD and IGT subclinical and overtly manifested. Nearly 60% of HD and 72% of IGT of our patients were subclinical. The importance of identification of subclinical GMD has been demonstrated in two stu-dies.6,7 Patients with subclinical IGT and HD had a 5-year survival rate significantly reduced than those with normal glucose tolerance.6,7
In our study we found that clinical profiles of most patients in whom DM was identified before the diagnosis of LC were different from the ones of patients with HD and IGT. They had a higher proportion of cryptogenic cirrhosis, renal impairment, hypoalbuminemia, family history of diabetes and hypertriglyceridemia (they had a profile of T2DM). The number of differences in these patients was higher compared to those without GMD and lower compared to those with HD and IGT. It was interesting to note that 30% of our patients with normal glucose tolerance had IR, which may suggest that these patients are at an early stage of the spectrum of the GMD.30
The hypercreatininemia observed in patients with T2DM may reflect renal impairment due to diabetic nephropathy.31 In a study published by our group, it was shown that cirrhotic patients with overt DM had higher 2-year mortality than those who did not have DM (69 vs. 48%, p < 0.05). High serum creatinine and Child-Pugh-C were independent predictors of death.17 Some other studies have shown that renal impairment increases mortality in cirrhotic patients.32
Moreover, most of our patients with IGT and HD had normal serum creatinine, which reflects no renal impairment. Some studies suggest that patients with hepatogenic GMD more frequently die from hepatic complications than from diabetes-associated complications.6 This fact may be related to the shorter duration of diabetic disease, also in relation to reduced life expectancy, as well as liver disease-induced abnormalities protecting the cardiovascular system from atherosclerosis.33
Although only clinically stable cirrhotic patients were included in our study, the 8.4% of them were on Child-Pugh C stage. Since patients with clinically or ultrasonographically manifested ascites and evident hepatic encephalopathy were excluded probably abnormalities of serum albumin, serum bilirubin and INR led these patients to reach this stage. Notwithstanding comparison of the number of Child-Pugh C patients among the different groups did not show statistical difference.
The mechanisms by which GMD worsens the clinical course of liver cirrhosis have not been clearly established. Firstly, DM by accelerating liver fibrosis and inflammation would give raise to severe liver failure. Secondly, DM may increase mortality by increasing the incidence of bacterial infections. In relation to the first mechanism, insulin resistance increases the adipokines production, such as leptin and TNF-α, which activates the inflammatory pathways that exacerbate liver damage.34 By contrast, adiponectin is a regulator of insulin sensitivity and tissue inflammation.35 The reduction in the adiponectin levels reflects peripheral and hepatic insulin resistance.36 There has been speculated that hypoadiponectinemia may play a role in the liver disease progression. 37–39 DM may also worsen immunosuppression of cirrhotic patients thus increasing the incidence of severe infections. In a recent study spontaneous bacterial peritonitis was significantly more frequent in patients with cryptogenic cirrhosis compared to other causes of cirrhosis.40 Cirrhotic patients with spontaneous bacterial peritonitis have a high in-hospital mortality rate due to sepsis, liver failure and hepatorenal syndrome.41
Our work has some drawbacks:
- •
Compensated patients were only studied, so we do not know if cirrhosis complications could significantly modify these clinical and biochemical profiles.
- •
T2DM patients with clinically evident cirrhosis were only included. We do not know if inclusion of underdiagnosed cases of cirrhosis could modify these results, and
- •
We did not evaluate the clinical outcome of patients with clinical forms of GMD (complications and mortality). Nevertheless we are currently evaluating the long term clinical outcomes of these patients in our hospital.
In summary, the classification of the clinical forms of GMD in T2DM, HD and IGT sublinical and overtly manifested better reflected the prevalence of these metabolic disorders. In addition it allowed the definition of clinical profiles of patients with different forms of GMD.
In the future, the clinical usefulness of the clinical profiles of GMD classification used in this study must be demonstrated particularly for the treatment, as well as for the assessment of prognosis of patients with liver cirrhosis.
AcknowledgmentsAuthors of the present manuscript want to thank to Guillermo Salazar Frayre for the English reviewing of the text.


