


Noninvasive liver assessment in type 2 diabetes (T2DM) in a primary care population identifies higher risk non-alcoholic fatty liver disease (NAFLD). We aimed to evaluate the association of T2DM with liver fibrosis and steatosis by transient elastography (TE).
Materials and MethodsThis is a retrospective study of a TE referral program where primary care physicians were able to order TE. Patients with alcohol abuse were excluded. TE and Controlled Attenuation Parameter (CAP) scores were obtained. Multivariable linear and logistic regression models were used to adjust for confounders.
Results28% had T2DM. The mean TE score in T2DM patients was 8.3 (±6) kilopascal (kPa) and 6.4 (±3.7) kPa in those without T2DM (p = 0.0001). Those with T2DM had a higher CAP (322 ± 51 dB/m vs. 296 ± 57 dB/m, p < 0.0001). In multivariable analysis, T2DM was associated with TE score (β: 1.9, 95% confidence interval [CI]: 0.74–3.1, p = 0.001) and CAP (β: 2.8, 95% CI: 9.3–36.2, p = 0.001). Patients with T2DM had higher-risk TE scores and more steatosis by CAP.
ConclusionT2DM is associated with liver fibrosis and steatosis by TE within a primary care population. A TE referral pathway may be utilized for T2DM patients who are at higher risk of NAFLD and its complications.
The incidence of nonalcoholic fatty liver disease (NAFLD) in the community is increasing, along with the growth of obesity, type 2 diabetes mellitus (T2DM) and other metabolic risk factors. NAFLD is projected to be the leading cause of liver transplantation and contributes to significant morbidity and mortality worldwide [1–5]. The presence of T2DM, in particular, portends an increased risk of NAFLD, nonalcoholic steatosis (NASH), advanced liver fibrosis and its related complications. While screening for NAFLD in the general population is controversial, there is growing consensus by international guidelines that patients with T2DM should be screened [6–8], as they are at heightened risk for the more severe form of NAFLD and its complications [9,10].
Type 2 diabetes is a known risk factor for NAFLD, NASH and advanced fibrosis. In a large meta-analysis from 22 countries, the pooled prevalence of T2DM in NAFLD and NASH patients was 23% and 44%, respectively, estimates that are larger than the general population [1]. T2DM is an independent predictor of advanced liver fibrosis [11,12]. In a European NAFLD registry, the presence of T2DM predicted advanced fibrosis with an odds ratio (OR) of 4.68 (95% confidence interval [CI]: 2.17–10.10, P < 0.001). Additionally, a study with serial liver biopsies showed the stage of fibrosis on index biopsy to be associated with T2DM (P < 0.001) [13]. In fact, 80% of patients who had fibrosis progression were diabetic, compared to only 25% of those who did not have fibrosis progression (P = 0.005). Another biopsy-proven NAFLD cohort demonstrated increased liver-related (adjusted hazard ratio [aHR]: 2.19, 95% CI: 1–4.81) and overall mortality (aHR: 2.09, 95% CI: 1.39–3.14) in those with diabetes [14]. Hence, targeting T2DM in the community where the burden of NAFLD is high, and where general practitioners serve as the frontline, is critical.
NAFLD, NASH and related fibrosis are the rule rather than the exception in patients with T2DM. Reports estimate the presence of NAFLD and advanced fibrosis in outpatient T2DM cohorts to be significant [15,16]. Given the high prevalence of T2DM in the community, the screening of NAFLD would ideally take place in the primary care setting. In fact, the American Diabetes Association (ADA) guideline recommends evaluating for NAFLD at the time of diagnosis of T2DM or prediabetes and annually thereafter, and for patients who have abnormal liver enzymes or steatosis on imaging, they recommend evaluating for nonalcoholic steatohepatitis (NASH) and liver fibrosis, along with a referral to a specialist [6]. Other international guidelines, including AASLD and EASL, recommend noninvasive assessment of fibrosis in patients who are deemed high risk for NAFLD, including those with T2DM [7,8].
Fibrosis assessment in patients with NAFLD is crucial to prognosticate liver-related risk, as those with advanced fibrosis and cirrhosis can develop HCC and portal hypertension, increasing morbidity and mortality. Liver biopsy remains the gold standard for the diagnosis of NAFLD and fibrosis, but it is costly and involves risk [17]. However, several reliable noninvasive methods of fibrosis assessment have reduced the need for liver biopsy and provide a simple strategy for general practitioners to evaluate liver fibrosis. The advent of transient elastography (TE) has revolutionized the evaluation of liver fibrosis [18]. In fact, TE scores accurately predict liver-related outcomes including advanced fibrosis, cirrhosis, portal hypertension and its sequelae [19–21]. At the moment, TE is ordered and managed only by specialty hepatologists. However, improving accessibility of TE to general practitioners can facilitate early detection of high-risk NAFLD in the community and institute timely referral and treatment [22,23].
The need for a simple diagnostic pathway for general practitioners to assess liver fibrosis in high-risk patients (i.e. T2DM) is imperative. Abnormal liver enzymes are historically unreliable [12,24–26], but remain the primary tool used to dictate specialist referral. This leads to unnecessary referrals with specialists seeing patient’s with mild disease and advanced disease going unnoticed in the community. Noninvasive measures, however, can reliably replace or be used in conjunction with liver enzyme tests. Several studies in the United Kingdom (UK) demonstrate that the targeted use of noninvasive testing pathways in the community helps risk-stratify patient’s liver disease by fibrosis level, reduces unnecessary specialist referrals, and is cost-effective [27–29]. Improving accessibility of TE to general practitioners through a network referral system can help triage mild disease from more severe NAFLD that would warrant hepatology referral. We created an open access TE referral program for patients from the community within our hospital network. In this study, we evaluated the association of T2DM in our primary care referral network with TE findings using this primary care based open access database.
2Materials and methods2.1Study populationThis is a retrospective cohort study of patients from an open access TE program created at Beth Israel Deaconess Medical Center (BIDMC) starting August 2017. Primary care physicians (PCPs) within BIDMC and its network ordered liver stiffness measurement by TE. PCPs were educated on the appropriate indications for TE referral through a series of expert lectures, emails and handouts. The referral indications included patients who were deemed high-risk for NAFLD with features of T2DM, obesity, metabolic syndrome, or a family history of cryptogenic cirrhosis. Other indications included abnormal liver enzymes, steatosis or other abnormalities on liver imaging. We collected data from 510 patients who had a TE from August 2017 to August 2019. Patients were identified as having T2DM based on their problem list or presence of oral hypoglycemic or insulin in their medication list. We excluded patients with a history of viral hepatitis, alcohol-related liver disease or alcohol abuse, which was defined as an excess of 14 beverages per week for males and 7 beverages per week for females (N = 73 patients) leaving us with a total sample size of 437 patients. The remaining cohort of patients did not have other liver diseases, biliary obstruction or hepatic malignancies, as those patients were referred to the appropriate specialist (i.e. hepatology) and not included into this PCP-based TE referral pathway.
2.2Vibration-controlled transient elastographyAll patients in this study received liver stiffness measurement by TE (FibroScan, Echosens, Paris, France). It was ensured that all included TE exams fulfilled the following criteria: fasting state, >10 valid measurements, and an interquartile range-to-median ratio (IQR/median) <30%. All measurements were started using the M probe, and transitioned to the XL probe only if the initial measurement was inappropriate. All patients also had controlled-attenuation parameter (CAP) measured during the TE exam to evaluate for steatosis. A CAP score cut-off of ≥ 248 dB/m was used to identify steatosis, while a CAP score ≥ 280 dB/m suggested severe steatosis. A trained medical assistant performed the TE. The findings were then evaluated by a hepatologist, who provided referral recommendations to the primary care physician.
2.3CovariatesInformation on patient demographics and referral patterns was collected, in addition to multiple clinical characteristics related to the patient’s liver disease and TE score findings. This includes social history, anthropometric measures, laboratory values, and imaging findings. Patient comorbidities, including the presence of coronary artery disease, hyperlipidemia, and obstructive sleep apnea, were recorded after evaluating their problem list. Data on heart failure or drugs causing steatosis were not collected.
2.4Statistical analysisThe primary aim of this study was to evaluate the association of T2DM with TE score to inform whether patients with T2DM in our primary care referral population should be targeted for selective TE referral pathways. The primary outcome of TE score was evaluated both as a continuous variable, as well as binary categorical variables with different cut-offs of 7 and 10 kPa. A two-sided Student T-test was used to evaluate the association between the T2DM and continuous TE score given a normal distribution, while a Pearson chi-square test was used to evaluate T2DM with the binary TE scores. A secondary aim of the study was to evaluate the association of T2DM with the CAP score, which was measured as a continuous variable and as separate dichotomous variables with cut-offs of 248 dB/m for steatosis and 280 dB/m for severe steatosis. Two-sided T-test and Pearson chi-square test were used to evaluate continuous and categorical CAP scores, respectively, in the two samples. Continuous variables were expressed as means with standard deviations. Categorical variables were expressed as proportions with percentages (%) and odds ratios (OR) with 95% confidence intervals (CI). Stepwise multivariate linear and logistic regression was used to identify predictors of the outcomes and control for confounding. Independent predictors were added to the multivariate model for the adjusted analysis. A P-value below the set alpha level of 0.05 was considered statistically significant. Stata/IC 15.1 software was used for all statistical analysis.
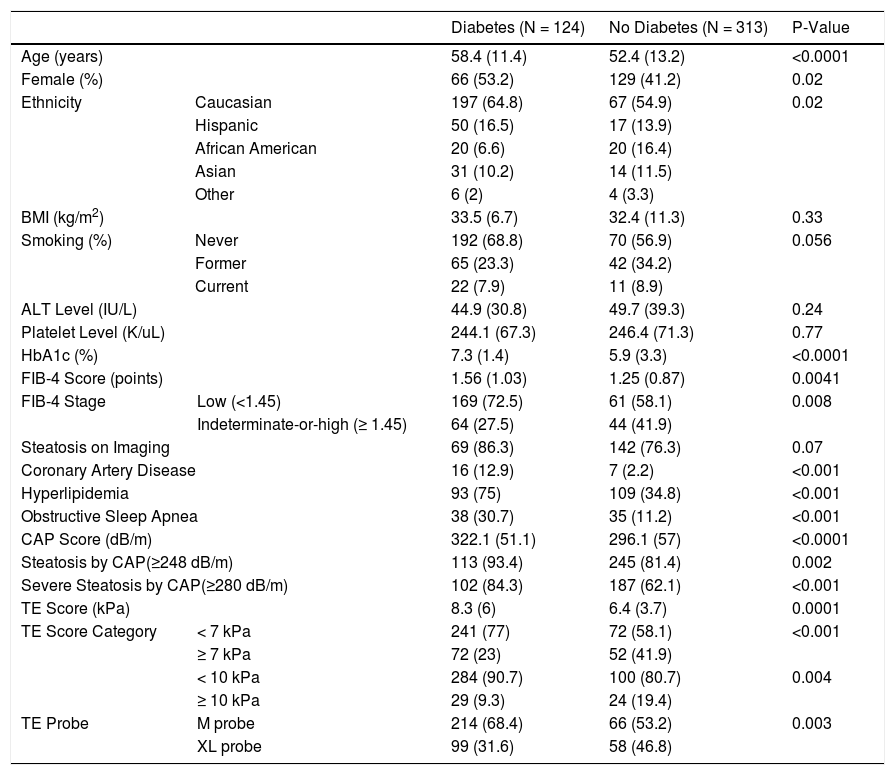
3Results3.1Baseline demographicsTable 1 demonstrates the baseline characteristics of the study population. There were a total of 124 patients with diabetes and 313 patients without diabetes. Diabetic patients were older (58 ± 11 vs 52 ± 13), more likely to be female (53% vs 41%) and had a higher hemoglobin A1c (HbA1c) level (7.3 ± 1.4 vs 5.9 ± 3.3) compared to those without diabetes. The predominant ethnicity in both groups was Caucasian consisting of 56% and 65% in the diabetic and non-diabetic groups, respectively. Body mass index (BMI), smoking status, alanine aminotransferase (ALT) and platelet levels were not different between the two groups. However, the FIB-4 index score was significantly higher in those with diabetes compared to their counterparts (1.56 ± 1.03 vs 1.25 ± 0.87). This difference persisted when FIB-4 score was dichotomized into a binary score with a cut-off of 1.45 (P = 0.008). Additionally, those with diabetes had a higher percentage of coronary artery disease (13% vs. 2%), hyperlipidemia (75% vs 35%), and obstructive sleep apnea (31% vs. 11%).
Baseline Characteristics of Study Population.
| Diabetes (N = 124) | No Diabetes (N = 313) | P-Value | |||
|---|---|---|---|---|---|
| Age (years) | 58.4 (11.4) | 52.4 (13.2) | <0.0001 | ||
| Female (%) | 66 (53.2) | 129 (41.2) | 0.02 | ||
| Ethnicity | Caucasian | 197 (64.8) | 67 (54.9) | 0.02 | |
| Hispanic | 50 (16.5) | 17 (13.9) | |||
| African American | 20 (6.6) | 20 (16.4) | |||
| Asian | 31 (10.2) | 14 (11.5) | |||
| Other | 6 (2) | 4 (3.3) | |||
| BMI (kg/m2) | 33.5 (6.7) | 32.4 (11.3) | 0.33 | ||
| Smoking (%) | Never | 192 (68.8) | 70 (56.9) | 0.056 | |
| Former | 65 (23.3) | 42 (34.2) | |||
| Current | 22 (7.9) | 11 (8.9) | |||
| ALT Level (IU/L) | 44.9 (30.8) | 49.7 (39.3) | 0.24 | ||
| Platelet Level (K/uL) | 244.1 (67.3) | 246.4 (71.3) | 0.77 | ||
| HbA1c (%) | 7.3 (1.4) | 5.9 (3.3) | <0.0001 | ||
| FIB-4 Score (points) | 1.56 (1.03) | 1.25 (0.87) | 0.0041 | ||
| FIB-4 Stage | Low (<1.45) | 169 (72.5) | 61 (58.1) | 0.008 | |
| Indeterminate-or-high (≥ 1.45) | 64 (27.5) | 44 (41.9) | |||
| Steatosis on Imaging | 69 (86.3) | 142 (76.3) | 0.07 | ||
| Coronary Artery Disease | 16 (12.9) | 7 (2.2) | <0.001 | ||
| Hyperlipidemia | 93 (75) | 109 (34.8) | <0.001 | ||
| Obstructive Sleep Apnea | 38 (30.7) | 35 (11.2) | <0.001 | ||
| CAP Score (dB/m) | 322.1 (51.1) | 296.1 (57) | <0.0001 | ||
| Steatosis by CAP(≥248 dB/m) | 113 (93.4) | 245 (81.4) | 0.002 | ||
| Severe Steatosis by CAP(≥280 dB/m) | 102 (84.3) | 187 (62.1) | <0.001 | ||
| TE Score (kPa) | 8.3 (6) | 6.4 (3.7) | 0.0001 | ||
| TE Score Category | < 7 kPa | 241 (77) | 72 (58.1) | <0.001 | |
| ≥ 7 kPa | 72 (23) | 52 (41.9) | |||
| < 10 kPa | 284 (90.7) | 100 (80.7) | 0.004 | ||
| ≥ 10 kPa | 29 (9.3) | 24 (19.4) | |||
| TE Probe | M probe | 214 (68.4) | 66 (53.2) | 0.003 | |
| XL probe | 99 (31.6) | 58 (46.8) | |||
BMI: body mass index, ALT: alanine aminotransferase, HbA1c: hemoglobin A1c, CAP: controlled attenuation parameter, TE: transient elastography.
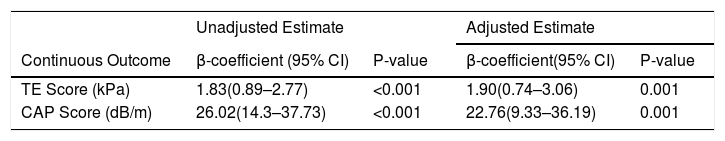
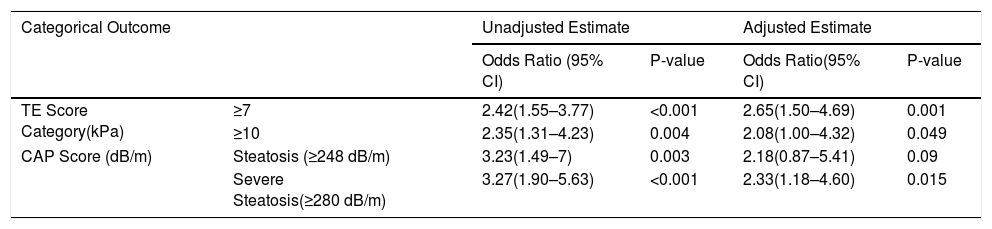
The presence of T2DM was significantly associated with the TE score. First and foremost, when kept as a continuous measure, patients with T2DM had a significantly higher TE score compared to those without diabetes (8.3 kPa ± 6 vs 6.4 kPa ± 3.7, P-value = 0.0001). An unadjusted analysis demonstrated a beta-coefficient of 1.83 (95% CI: 0.89–2.77, P < 0.001) as shown in Table 2. Once adjusted for independent predictors, including age, BMI, ALT, HbA1c, and steatosis on imaging, the difference remained statistically significant (beta-coefficient: 1.90, 95% CI: 0.74–3.06, P-value = 0.001). The TE score was then categorized into two separate cut-offs as shown in Table 3. When using a lower cut-off, the unadjusted OR for diabetics having a TE score ≥7 kPa was 2.42 (95% CI: 1.55–3.77, P < 0.001). After multivariate adjustment, the OR increased to 2.65 (95% CI: 1.50–4.69, P = 0.001). When using a higher TE score cut-off of 10 kPa, the unadjusted and adjusted OR were 2.35 (95% CI: 1.31–4.23, P = 0.004) and 2.08 (95% CI: 1–4.32, P = 0.049), respectively.
Transient Elastography Findings as Continuous Measures.
| Unadjusted Estimate | Adjusted Estimate | |||
|---|---|---|---|---|
| Continuous Outcome | β-coefficient (95% CI) | P-value | β-coefficient(95% CI) | P-value |
| TE Score (kPa) | 1.83(0.89–2.77) | <0.001 | 1.90(0.74–3.06) | 0.001 |
| CAP Score (dB/m) | 26.02(14.3–37.73) | <0.001 | 22.76(9.33–36.19) | 0.001 |
Independent predictors that were adjusted for in the multivariate linear regression model were age, BMI, ALT level, HbA1c. Steatosis on imaging was kept in the TE outcome model, but not used for CAP score.
CI: confidence interval, TE: transient elastography, CAP: controlled attenuation parameter.
Transient Elastography Findings as Categorical Measures.
| Categorical Outcome | Unadjusted Estimate | Adjusted Estimate | |||
|---|---|---|---|---|---|
| Odds Ratio (95% CI) | P-value | Odds Ratio(95% CI) | P-value | ||
| TE Score Category(kPa) | ≥7 | 2.42(1.55–3.77) | <0.001 | 2.65(1.50–4.69) | 0.001 |
| ≥10 | 2.35(1.31–4.23) | 0.004 | 2.08(1.00–4.32) | 0.049 | |
| CAP Score (dB/m) | Steatosis (≥248 dB/m) | 3.23(1.49–7) | 0.003 | 2.18(0.87–5.41) | 0.09 |
| Severe Steatosis(≥280 dB/m) | 3.27(1.90–5.63) | <0.001 | 2.33(1.18–4.60) | 0.015 | |
Independent predictors that were adjusted for in the multivariate linear regression model were age, BMI, ALT level, HbA1c. Steatosis on imaging was kept in the TE outcome model, but not used for CAP score.
CI: confidence interval, TE: transient elastography, CAP: controlled attenuation parameter.
The presence of T2DM was also associated with CAP score, an important measure of steatosis (Table 2 and 3). The mean CAP score was significantly higher in those with T2DM compared to those without T2DM (322 ± 51 vs 296 ± 57, P < 0.0001). In an unadjusted analysis, the beta-coefficient was 26 (95% CI: 14.3–37.73, P < 0.001), and remained statistically significant after multivariate adjustment for age, BMI, ALT and HbA1c levels (beta-coefficient: 22.8, 95% CI: 9.33–36.2, P = 0.001). CAP score was then evaluated at two separate cut-offs with a score of ≥248 dB/m and ≥280 dB/m signifying the presence of steatosis and severe steatosis, respectively. When using the lower cut-off for steatosis, the unadjusted odds ratio was 3.23 (95% CI: 1.49–7, P-value = 0.003). After adjusting for independent predictors, the OR was 2.18 (95% CI: 0.87–5.41, P = 0.09). When using the higher cut-off for severe steatosis, the unadjusted (OR: 3.27, 95% CI: 1.9–5.63, P < 0.001) and adjusted estimates (OR: 2.33, 95% CI: 1.18–4.60, P = 0.015) remained significant.
4DiscussionThe presence of T2DM impacts liver-related outcomes. Patients with T2DM are more likely to have NAFLD, advanced fibrosis, and have an increased risk of mortality compared to those without diabetes [1,11–14]. Screening for NAFLD remains controversial. However, there is growing consensus from international societies including ADA, AASLD, and EASL, to noninvasively screen diabetics for liver fibrosis regardless of pre-existing NAFLD [6–8]. As seen in UK cohorts, noninvasive screening pathways can facilitate appropriate referral, reduce healthcare costs, and also implement early intervention [27–29]. The reproducibility of such results in United States (US) based cohorts is warranted, as treatments such as weight loss from lifestyle intervention or bariatric surgery, as well as certain pharmacologic therapies on the horizon, can alter the course of the disease if instituted early on [22,30,31]. As the burden of NAFLD continues to grow worldwide, screening patients with T2DM is crucial. However, the optimal method of noninvasive screening in the primary care population is not known.
TE is a validated tool increasingly used in clinical practice to prognosticate patients with liver disease, but its accessibility to general practitioners is limited. Improving its access to physicians treating patients at risk for NAFLD, such as those with T2DM, is imperative to prevent under diagnosis and inappropriate referral that places burden on the healthcare system. Improving access of TE to general practitioners, who serve on the frontline, can aid in the detection of NAFLD and advanced fibrosis. In this study, general practitioners had direct access to obtaining TE for their patients who were deemed to have high-risk of liver disease. We evaluate the association of liver fibrosis and steatosis by TE with the presence of T2DM in this primary care referral population.
TE scores accurately predict fibrosis and liver-related outcomes. However, studies on its use in patients at-risk of NAFLD within US-based primary care populations are limited. In our study, we demonstrate significantly higher TE and CAP scores in patients with T2DM in our primary care population compared to those without diabetes. The statistical difference persists when categorizing the TE and CAP scores into distinct, clinically relevant cut-offs. The findings demonstrate that diabetics are at 2.7 times the odds of having moderate-to-severe fibrosis (≥7 kPa, P = 0.001) and at 2.1 times the odds of having advanced fibrosis or cirrhosis (≥10 kPa, P = 0.049). Using CAP score, diabetics also demonstrated increased odds of having any steatosis (≥248 dB/M, OR: 2.18, P = NS) or severe steatosis (≥ 280 dB/m, OR: 2.33, P = 0.015). Not surprisingly, as shown in Fig. 1, the proportion of diabetics progressively increases as the fibrosis level worsens based on TE score and FIB-4, an alternate noninvasive measure of fibrosis. Interestingly, the ALT level in both groups were similar, despite those with T2DM having increased amounts of steatosis and fibrosis. These results exhibit similar trends seen in previous reports and can help guide general practitioners to determine further surveillance, treatment and referral strategies.
.")
Access to TE is limited only to specialty hepatologists at the moment. However, our study justifies the need for enhanced access of TE to general practitioners in order to prognosticate liver-related risk by improving detection of steatosis, advanced liver fibrosis and cirrhosis in those with T2DM. We show an increased risk of steatosis and advanced fibrosis by TE in patients with T2DM even without having a previous diagnosis of NAFLD, justifying screening for all diabetics [6]. Fig. 2 illustrates a proposed pathway that general practitioners could use to determine the need for specialist referral based on TE score, without having to rely on misleading liver enzyme tests or costly imaging techniques. Enhanced TE access can potentially mitigate the under diagnosis of NAFLD in the community while also reducing unnecessary referrals to specialists and improving healthcare resource utilization.

There are additional strengths and limitations in our study. First off, our reports of fibrosis and steatosis are consistent with previous studies in T2DM patients confirming its significant presence within primary care populations [15,16]. The strong association of TE findings with the presence of T2DM has strong management implications that can potentially change clinical practice. The generalizability of our results to other US-based primary care cohort populations serves as an additional strength of our study. However, although we did account for independent predictors to minimize confounding, the observational and retrospective nature of the study makes it prone to unmeasured confounders that may ultimately influence the results. Additionally, the possibility of referral bias in our cohort indicates the need to replicate these results in a generalized primary care cohort with a simple and accessible method of fibrosis measurement, which remains to be validated. Lastly, a propensity score matched study design would enhance the results of this study but requires a significantly larger sample size. Hence, longitudinal prospective studies validating these results and evaluating this algorithm within primary care clinics in the US are warranted.AbbreviationsNAFLD non-alcoholic liver disease type 2 diabetes mellitus non-alcoholic steatohepatitis odds ratio confidence interval hazards ratio American Diabetes Association American Association for the Study of Liver Disease European Association for the Study of the Liver hepatocellular carcinoma transient elastography United Kingdom Beth Israel Deaconess Medical Center primary care physicians controlled-attenuation parameter kilopascals hemoglobin A1c body-mass index alanine aminotransferase fibrosis-4 index not significant
HDT is supported by 5T32DK007760-20. There are no other funding sources required for the production of this manuscript. There are no financial disclosures. There are no conflicts of interest. The corresponding author of this article is below 35 years of age (date of birth: June 11th, 1986).
HDT, MPC and ML helped with idea creation. HDT, JS, DO, JS, DG, and RI helped with data acquisition. HDT performed statistical analysis and manuscript writing. MPC and ML performed critical revision.
This project was approved by the international review board. This project has not been submitted or published in any other journal.


