


Background and aim. Trophoblast cell surface antigen 2 (TROP2) or tumor-associated calcium signal transducer 2 (TACSTD2) is a 36-kDa type I transmembrane glycoprotein and exerts dual functions as an oncogene and tumor suppressor in cancer cells. In this study, we investigated the expression and functions of TROP2 in liver fluke-associated cholangiocarcinoma (CCA).
Material and methods. TROP2 expression in 85 CCA tissues was detected by using immunohistochemistry. The methylation status of TROP2 promoter was studied in 15 matched pairs of normal and CCA formalin fixed paraffin embedded (FFPE) tissues using the bisulfite genomic sequencing (BGS) method. The functions of TROP2 on cancer cell behavior were investigated using siRNA in CCA cell lines. Proliferation, migration and invasion assays were performed. A PCR array was used to evaluate the impact of TROP2 knockdown on the gene expression profiles.
Results. TROP2 was highly expressed in all normal bile duct epithelia, but significantly down-regulated in CCA cells. Sixty percent of CCA revealed promoter hypermethylation compared to the corresponding adjacent normal tissues. TROP2 knockdown significantly enhanced the proliferation and migration in CCA cell lines, and altered the expressions of MARCK, EMP1and FILIP1L.
Conclusion. We provide new evidence that TROP2 is epigenetically down-regulated and operates as a negative regulator of cell proliferation and migration in liver fluke-associated CCA.
The trophoblast cell surface antigen 2 (TROP2) or tumor associated calcium signal transducer 2 (TACSTD2) gene encodes a type 1 transmembrane protein with a single spanning region and a phosphatidylinositol 4,5-bisphosphate (PIP2) binding sequence, involved in calcium signaling. TROP2 is highly expressed in various cancers and associated with increased malignant behavior.1-4 Others have reported that TROP2 is widely distributed in numerous normal human tissues and is epigenetic silenced in glioma, prostate and lung cancers.5–9 TROP2 may potentially have different roles in different types of cancers.7,10
Cholangiocarcinoma (CCA) is a bile duct cancer that arises from the bile duct epithelium. This lethal cancer remains a very serious health problem in the Northeast of Thailand where the incidence is the highest reported in the world.11 Liver fluke (Opisthorchis viverrini) infection is a major risk factor for CCA in this endemic area.12 Most patients presenting with CCA in this region already have metastasic disease, leading to a high mortality rate.13 Overexpression of TROP2 is correlated with poor prognosis in Chinese patients with hilar CCA.14 However, it is not known yet how TROP2 expression is regulated and if it plays a pathological role in liver fluke-associated CCA in the Thai population.
In this study, we assess the expression and the epigenetic regulation of TROP2 in Thai CCAs. We also investigate the functional roles of TROP2 in the proliferation and migration abilities of CCA cells.
Material and MethodsCCA patient samplesCCA tissues were obtained from patients who admitted at Srinagarind hospital, Faculty of Medicine, Khon Kaen University, Khon Kaen, Thailand for surgical treatment. The protocol of sample collection and study were approved by the Ethic Committee for Human Research, Khon Kaen University (HE521209). The paraffin embedded tissues were obtained from the Liver Fluke and Cholangiocarcinoma Research Center, Faculty of Medicine, Khon Kaen University.
Cell lines and culture conditionCCA cell lines (KKU-M213, KKU-M214) were grown in HAM’s F-12 medium supplemented with 10% fetal bovine serum (FBS), 100 unit/mL of penicillin G and 100 µg/ mL streptomycin (Invitrogen) and incubated in 5% CO2 incubator at 37 °C.
Knockdown of TROP2 expression by siRNAThe TROP2 target sequence used for knockdown was 5’GCGCACGCTCATCTATTA CCT 3’. Cells were transfected with 50 µM of TROP2 specific siRNA (Dharmacon, CO, USA) or scrambled siRNA (Ambion, CA, USA) as a control using Lipofectamine 2000 (Invitrogen, CA, USA) according to the manufacturer’s instructions. After 24-72 h transfection, the cells were subjected for further analysis.
Immunohistochemistry (IHC)Formalin-fixed 4-µm paraffin-embedded sections were performed according to the standard protocol. Goat anti-TROP2 (AF650, R&D Systems, CA, USA) at a dilution of 1: 30 and the universal immuno-peroxidase polymer, anti-Goat-Histofine (Nichirei Biosciences, Tokyo, Japan) were used to detect TROP2. TROP2 expression was evaluated as immunostaining index which was frequency x intensity scores. The proportion score described the estimated fraction of positive stained tumor cells (0: none; 1: < 10%; 2: 10-50%; 3: 51-80%; 4: > 80%). The intensity score represented the estimated staining intensity (0, negative staining; 1, weak; 2, moderate; 3, strong). The IHC index ranged from 0 to 12.
ImmunocytochemistryCells well grown on a 24 well tissue culture plate, then immunostained using primary antibodies specific to TROP2 or EMP1 (Abnova, Taipei, Taiwan). The Immunoperoxidase Polymer, anti-goat (Histofine, NICHIREI Bioscience) or anti-mouse (Dako) was used as the secondary antibody.
Real-time PCRTotal RNA was isolated from CCA cell lines using TRIzol reagent (Invitrogen) according to the manufacturer’s instructions. Five micrograms of total RNA was reverse transcribed to cDNA using RTG You-Prime RXN Beads (GE Healthcare, Buckingham, UK) according to the manufacturer’s protocol. TROP2 expression was examined on an ABI PRISM 7500 Real- time PCR System (Applied Biosystem, CA, USA) using SYBR Green PCR Master Mix (Roche). All data will be analyzed using 7500 system SDS software (Applied Biosystem) and β2 Microglobulin (β2M) was used as a housekeeping gene.
PCR arrayIn-house PCR array of 176 CCA associated genes was used to compare the global gene expression profile between scrambled control and TROP2 knockdown of KKU-M213 cells. The detail of this array and data analysis was performed as described elsewhere.15 Amplification was carried out on a Light cycler® 480 II (Roche, Basel, Switzerland) using SYBR Green Master Mix. The data were analyzed by the comparative Ct (2-ΔΔCt) method and quantitated relative to the Glyceraldehyde 3-phosphate dehydrogenase (GAPDH) as internal control gene.
DNA extraction and bisulfite modificationGenomic DNA was extracted from cell lines according to the protocol described previously.16 For formalin-fixed paraffin embedded (FFPE) tissue from 15 matched pairs of CCA and normal, five serial sections (5 thick) from each sample were stained with hematoxylin and examined microscopically. Regions consisting of tumor cells and normal bile duct were collected and processed using QIAamp® DNA FFPE tissue kit (Qiagen, Venlo, Netherlands) according to the manufacturer’s protocol. DNA concentration and its purity were determined by Nano-Vue™ spectrophotometer (GE healthcare). The bisulfite conversion was carried out with 1 µg of genomic DNA using EZ DNA Methylation-Gold™ Kit (Zymo research, CA, USA) following the manufacturer’s instructions.
Bisulfite genomic sequencing (BGS)MethPrimer program (http://www.urogene.org/meth-primer) was used to predict promoter CpG islands and to design primers for BGS. The forward and reverse primer sequences were 5’- GGAGTAGTTTTTTTGTTTTGATTTTAT-3’ and 5’- CCACTAATATTTAAATAACACAT CCC-3’, respectively. These primers amplified 103-bp PCR product contained 8 CpGs located within the CpG islands of the TROP2 promoter ranging from -269 to -167 bp relative to the ATG start codon. Amplified PCR products were purified and ligated with pGEM®-T Easy Vector Systems (Promega, WI, USA) in accordance with the manufacturer’s instruction. Six randomly selected colonies were subjected to sequencing using MegaBACETM 1000 and Dye Terminator cycle Sequencing Kit (GE healthcare). The degree of methylation was expressed as the percentage of all methylated CpG sites from all clones.
Cell proliferation assayThe number of proliferating cells was determined after 24-72 h after transfection by the addition of the MTT reagent17 following the manufacturer’s protocol (Invitrogen).
Migration and invasion assayMigration and invasion abilities were determined using 8 pore size Transwell® insert (Corning, NY, USA). Briefly, 48 h-transfected cells (12,000 cells) in serum-free medium (SFM) were seeded into the upper chamber and complete medium was applied at the lower compartment of the chamber. After incubation at 37 °C for 18 h, cells in the upper surface of the filter were scraped off using a cotton swab. Migrated cells at the underside of the filter were fixed with 30% methanol and stained with 0.1% crystal violet in 25% methanol. The number of migrated cells was counted under a microscope. Mean values of nine fields (100x magnifications) were calculated. Assays were performed in triplicate and three independent experiments. For invasion assay, cell suspension in SFM was seeded into the upper chamber of Matrigel-coated insert (40 µg). Complete medium was applied in the lower compartment of the chamber. Following incubation at 37 oC for 20 h, the number of invaded cells was analyzed as stated for the migration assay.
Protein extraction and western blottingCells were lysed in RIPA buffer containing protease and phosphatase inhibitor cocktails (Roche). The protein lysate was measured the concentration using Lowry’s method. Fifteen microgram of protein were subjected to 10% SDS-PAGE and transferred onto PVDF membrane which was probed with mouse anti EMP1 antibody (Abnova). Horse radish peroxidase (HRP)-conjugated goat anti mouse antibody (Sigma-Aldrich, MO, USA) was further incubated. The immunoreactive bands were detected using ECLTM Western blotting analysis system and captured by ImageQuant 4000 LAS mini (GE healthcare). β-actin signal was detected by mouse anti- β-actin antibody (Sigma-Aldrich) and used as the internal control. The band intensity was quantitated by ImageQuant TL software (GE healthcare).
Statistical analysisThe data are presented as a mean ± SD. Associations between TROP2 expression in tissues and clinicopathological variables were assessed with the χ2 (chi square) test. Survival rates were calculated using the Kaplan-Meier with the log-rank test. Correlation analysis of TROP2 mRNA expression with DNA methylation status was estimated by Spearman’s rank correlation method. P value < 0.05 was considered as statistically significant. SPSS software version 16.0 (Chicago, IL) was used to perform the statistical analysis.
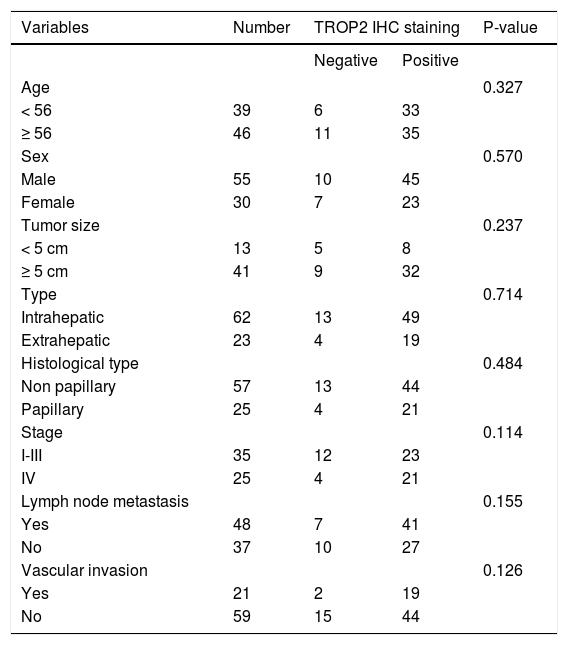
ResultsDecreased expression of TROP2 in liver fluke-associated CCA tissuesWe first investigated the expression of TROP2 in 85 CCA tissues using IHC. Representative IHC staining is shown in figures 1A-1D. Normal bile ducts showed strong membrane positive staining of TROP2, but a decreased expression in precancerous lesions (Figures 1A and 1B). Different levels of TROP2 expression were observed in CCA cells (Figures 1C and 1D). IHC index of TROP2 expression was highest in the normal bile ducts and significantly decreased in precancerous lesions, primary and metastatic CCA tissues (Figure 1E). These results indicated that TROP2 expression was significantly suppressed in CCA compared to those of normal bile ducts. However, neither clinicopathological findings (Table 1) nor overall survival time correlated with TROP2 expression (Figure 1F).

Immunohistochemistry staining of TROP2 in CCA tissues. TROP2 differentially expressed in bile duct epithelia with different stages. Representative figures are 200x original magnification. A. Normal bile ducts. B. Precancerous lesion. C. CCA tissue with low TROP2 expression. D. CCA tissue with high TROP2 expression. E. Semi-quantitative analysis of TROP2 expression in bile duct epithelia was determined using IHC index as mentioned in Material and methods. * P-value < 0.05. F. Patients were divided into negative and positive staining of TROP2 and survival rates were analyzed using Kaplan-Meier method with the log-rank test.
Clinicopathological variables and TROP2 expression in CCA tissues.
| Variables | Number | TROP2 IHC staining | P-value | |
|---|---|---|---|---|
| Negative | Positive | |||
| Age | 0.327 | |||
| < 56 | 39 | 6 | 33 | |
| ≥ 56 | 46 | 11 | 35 | |
| Sex | 0.570 | |||
| Male | 55 | 10 | 45 | |
| Female | 30 | 7 | 23 | |
| Tumor size | 0.237 | |||
| < 5 cm | 13 | 5 | 8 | |
| ≥ 5 cm | 41 | 9 | 32 | |
| Type | 0.714 | |||
| Intrahepatic | 62 | 13 | 49 | |
| Extrahepatic | 23 | 4 | 19 | |
| Histological type | 0.484 | |||
| Non papillary | 57 | 13 | 44 | |
| Papillary | 25 | 4 | 21 | |
| Stage | 0.114 | |||
| I-III | 35 | 12 | 23 | |
| IV | 25 | 4 | 21 | |
| Lymph node metastasis | 0.155 | |||
| Yes | 48 | 7 | 41 | |
| No | 37 | 10 | 27 | |
| Vascular invasion | 0.126 | |||
| Yes | 21 | 2 | 19 | |
| No | 59 | 15 | 44 | |
We next investigated whether decreased TROP2 expression in CCA tissues was regulated by hypermethylation. Bisulfite genomic sequencing (BGS) was used to analyze the methylation status of TROP2 gene in the region −269 to −167 bp relatively to ATG start codon that contained 8 CpG sites as shown in figure 2A. BGS was performed in 15 pairs of FFPE samples from CCA tissues and the corresponding normal bile duct. The results demonstrated that 60% (9/15) of cases had hypermethylation of TROP2 gene in CCA tissues when compared to the corresponding normal bile duct tissues (Figure 2B).
 and start codon (ATG). F1 and R1 primers were used for BGS. B. The methylation status in 15 matched pairs FFPE tissues calculated as the percent methylation of the average overall methylation for all 8 CpG sites. C. An inverse correlation with methylation status and TROP2 mRNA expression in 4 tested CCA cell lines (Spearman’s rank correlation test; δ = −0.9487).")
Methylation in the CpG island on TROP2 promoter. A. Schematic diagram of putative CpG island on TROP2 promoter identified by Meth-Primer software. The location of the putative CpG island is displayed in the blue shaded area including transcriptional start site (TSS) and start codon (ATG). F1 and R1 primers were used for BGS. B. The methylation status in 15 matched pairs FFPE tissues calculated as the percent methylation of the average overall methylation for all 8 CpG sites. C. An inverse correlation with methylation status and TROP2 mRNA expression in 4 tested CCA cell lines (Spearman’s rank correlation test; δ = −0.9487).
We additionally investigated the mRNA and protein levels of TROP2 in 6 human CCA cell lines (KKU-M055, KKU-100, KKU-M139, KKU- M156, KKU-M213 and KKU-M214) using real-time PCR and immunocytochemistry, respectively. As shown in figure 3A, TROP2 mRNA expression levels were lowest in KKU-M055 and KKU-100 and highest in KKU-M213 and KKU-M214. Immunocytochemistry results showed the corresponding TROP2 protein level. These 4 selected CCA cell lines were tested for the methylation status of TROP2 promoter. CCA cell lines (KKU-M055 and KKU-100) with low TROP2 expression had 100 and 92% overall methylation, respectively. In contrast, high TROP2 expressing CCA cell lines (KKU-M213 and KKU-M214) had unmethylated in the eight CpG sites examined. The TROP2 mRNA expression showed an inverse correlation with methylation status of TROP2 promoter in these 4 CCA cell lines (Spearman’s rank correlation method; δ = −0.9487) as shown in figure 2C. Taken together, down-regulation of TROP2 expression in CCA was controlled by hypermethylation of TROP2 promoter.
 was quantitated in 6 CCA cell lines by real-time PCR (top panel) and protein level of TROP2 was detected by immunocytochiemistry staining (low panel). B. TROP2 suppression by siRNA in KKU-M213 and KKU-M214 CCA cell lines. Real-time PCR of TROP2 mRNA after siTROP2 transfection for 24, 48 and 72 h (top panel) and immunocytochemistry staining of TROP2 protein at 48 h siRNA post-transfection (low panel).")
TROP2 expression in CCA cell lines. A. mRNA level of TROP2 (2-ACt) was quantitated in 6 CCA cell lines by real-time PCR (top panel) and protein level of TROP2 was detected by immunocytochiemistry staining (low panel). B. TROP2 suppression by siRNA in KKU-M213 and KKU-M214 CCA cell lines. Real-time PCR of TROP2 mRNA after siTROP2 transfection for 24, 48 and 72 h (top panel) and immunocytochemistry staining of TROP2 protein at 48 h siRNA post-transfection (low panel).
We next questioned whether suppression of TROP2 had significant role in progression of CCA. Expressions of TROP2 in high TROP2 expressing cells were transiently depleted using siRNA. TROP2 mRNA and proteins expressions were reduced 50-80% in both CCA cell lines during 72 h post-transfection (Figure 3B). Silencing of TROP2 significantly stimulated cell proliferation of CCA compared to the control (Figure 4A). These results suggested an associated function of TROP2 to cell proliferation. The potential roles of TROP2 in tumor progression namely migration and invasion were also evaluated. Knockdown of TROP2 expression significantly enhanced migration of both CCA cell lines as shown in figure 4B but had no obvious effect on cell invasion (Figure 4C).
. All results are representative of three separate experiments. A. siTROP2 promotes CCA cell proliferation. The number of cells was determined by MTT assay. Average of optical density of triplicated wells of each time points (24, 48 and 72 h) were normalized to the starting time point. B. TROP2 silencing accelerates the migration in CCA cells. Number of migrated cells were counted 9 fields per insert. Data are averaged values from triplicated inserts and represent one of three independent experiments. Representatve figures of migrated cells on Transwell® inserts are shown on the lower panel. C. The invasion ability after TROP2 knockdown is not significantly altered in CCA. Data is similarly shown as stated for the migration assay.")
TROP2 knockdown enhances proliferation and migration but not invasion in CCA cell lines (KKU-M213 and KKU-M214). All results are representative of three separate experiments. A. siTROP2 promotes CCA cell proliferation. The number of cells was determined by MTT assay. Average of optical density of triplicated wells of each time points (24, 48 and 72 h) were normalized to the starting time point. B. TROP2 silencing accelerates the migration in CCA cells. Number of migrated cells were counted 9 fields per insert. Data are averaged values from triplicated inserts and represent one of three independent experiments. Representatve figures of migrated cells on Transwell® inserts are shown on the lower panel. C. The invasion ability after TROP2 knockdown is not significantly altered in CCA. Data is similarly shown as stated for the migration assay.
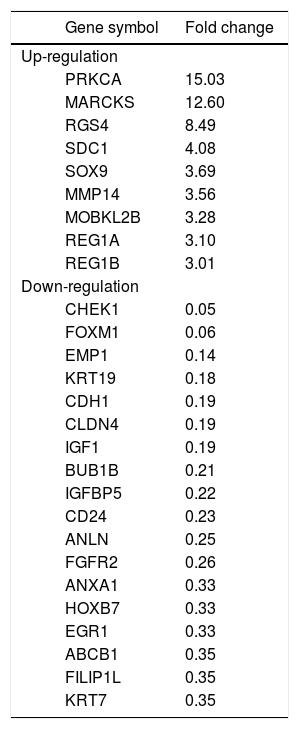
To identify clues as to the molecular mechanisms underlying TROP2’s actions, we used an in-house PCR array containing 176 CCA associated genes to identify expression changes due to TROP2 suppression in the KKU-M213 cell line. Expression of genes with more than a 2.5 fold increase or 0.5 fold decrease were considered significant differences. Twenty-seven genes related to cell proliferation and migration were differentially expressed by TROP2 suppression. Among these, 9 genes were up-regulated and 18 genes were down-regulated as shown in table 2. Three candidate genes MARCKS, EMP1 and FILIP1L were selected for further verification by Real-time PCR in KKU-M213. The expression changes of these genes measured by real-time PCR corresponded to the original PCR array results (Figure 5A). Furthermore, EMP1, a down-regulated gene was confirmed by immunocytochemistry staining in KKU-M213 and KKU-M214 cells (Figure 5B).
Differential expression profile of TROP2 knockdown vs. control scrambled transfected KKU-M213 CCA cell line.
| Gene symbol | Fold change | |
|---|---|---|
| Up-regulation | ||
| PRKCA | 15.03 | |
| MARCKS | 12.60 | |
| RGS4 | 8.49 | |
| SDC1 | 4.08 | |
| SOX9 | 3.69 | |
| MMP14 | 3.56 | |
| MOBKL2B | 3.28 | |
| REG1A | 3.10 | |
| REG1B | 3.01 | |
| Down-regulation | ||
| CHEK1 | 0.05 | |
| FOXM1 | 0.06 | |
| EMP1 | 0.14 | |
| KRT19 | 0.18 | |
| CDH1 | 0.19 | |
| CLDN4 | 0.19 | |
| IGF1 | 0.19 | |
| BUB1B | 0.21 | |
| IGFBP5 | 0.22 | |
| CD24 | 0.23 | |
| ANLN | 0.25 | |
| FGFR2 | 0.26 | |
| ANXA1 | 0.33 | |
| HOXB7 | 0.33 | |
| EGR1 | 0.33 | |
| ABCB1 | 0.35 | |
| FILIP1L | 0.35 | |
| KRT7 | 0.35 | |

Molecular alteration of TROP2 suppression in CCA cells. A. Three candidate genes; MARCKS, EMP1 and FILIP1L selected from PCR array were verified by real-time PCR. B. Immunocytochemistry staining shows decreasing EMP1 protein expression in siTROP2 transfected CCA cells. C. TROP2 knockdown activates ERK signaling pathway. Western blot analysis shows increasing of phosphorylated ERK in TROP2 silencing cells. ß-actin was used as interna standard. The numbers represent the quantitative analysis of pERK/ERK after normalized with β-actin.
As the extracellular signal-regulated kinase (ERK) pathway plays a role in TROP2 related proliferation and migration of cancers,7,18 we asked if TROP2 action in CCA might be mediated via ERK signaling. The effects of TROP2 knockdown on phosphorylation level of ERK in KKU-M213 and KKU-M214 cell lines were determined using western blotting. We found that silencing of TROP2 expression increased ERK phosphorylation in both cell lines (Figure 5C).
DiscussionTROP2 has been proposed to be involved in cancer progression as an oncogene10 or a tumor suppressor gene.7 Our investigations sought to clarify the functional role of TROP2 in CCA. IHC analysis of TROP2 in CCA tissues demonstrated that TROP2 was greatly expressed in normal biliary cells. On contrary, TROP2 expression significantly decreased in precancerous lesion, primary and metastatic CCA. Our data are different from hilar CCA reported in Chinese patients 14 in which TROP2 was increased in hilar CCA where the important risk factors are biliary tract stone disease, cirrhosis and chronic hepatitis B virus infection.19,20 The distinction may be explained by the different etiology which might influence the biological and molecular features of CCA.21–23
Decreased expression of TROP2 in CCA tissues was epigenetically controlled by hypermethylation of the TROP2 promoter. Our finding is consistent with the observations reported in glioma, prostate and lung cancers.5–7 An inverse correlation of TROP2 expression and the degree of hypermethylation was demonstrated in CCA cell lines. These data suggested that TROP2 expression was regulated at least in part through DNA hypermethylation.
Transient depletion of TROP2 expression using siRNA in CCA cell lines significantly diminish the proliferation and migration, but did not affect the invasiveness of CCA cells. Our observation is in agreement with Lin, et al., who reported that silencing of TROP2 by shRNA promoted in vitro cell proliferation and in vivo xenograft tumor growth of lung cancer.7 These evidences raise the potential roles of TROP2 in cell proliferation and migration of CCA. We then explored the differential expression profile of the downstream effectors contributing to TROP2 mediated proliferation and migration by using the in-house PCR array. Up-regulation of MARCKS and down-regulation of EMP1 and FILIP1L were found in TROP2 depleted cells.
Myristoylated alanine-rich C kinase substrate (MARCKS), a protein kinase C (PKC) substrate has been suggested to be implicated in cell adhesion and motility. An increase of MARCKS expression in hepatocellular carcinoma and CCA has been reported.24,25 Suppression of MARCKS by siRNA reduced cell motility in CCA cell lines was clearly shown.26 Increasing of MARCKS expression in TROP2 silencing CCA cell indicates that TROP2 may mediate cell migration via regulation of MARCKS expression.
Epithelial membrane protein 1 (EMP1) was first described in 1995 and also named as different designations (TMP, PAP, CL-20 and B4B).27 It is a member of the PMP22 family with four transmembrane domains.28 Down-regulated EMP1 expression was correlated with clinical stage and lymph node metastasis of oral squamous cell carcinoma (OSCC) patients and overexpression of EMP1 gene inhibited the proliferation of OSCC cell line.29,30 In the current study, down-regulation of EMP1 was shown in TROP2 silenced CCA cell lines in both mRNA and protein levels and may support the increasing proliferative rate and migratory ability observed in our study.
FILIP1L is a filamin A interacting protein 1-like protein with 4 coiled-coil and 2 N-terminal leucine zipper domains.31 It has been identified as a mediator of cellular proliferation and migration in both normal and tumor cells.32,33 Overexpression of FILIP1L resulted in inhibition of cell proliferation/migration and increased apoptosis.34 Similarly, we found FILIP1L down-regulation in TROP2 knockdown CCA cells with diminished proliferation and migration.
Furthermore, we observed increased phosphorylated ERK in the TROP2 knockdown of CCA cell lines. This data corresponded to the previous report showing that TROP2 silencing up-regulated ERK activity in lung cancer cell line.7 Our finding suggests that the ERK pathway is involved in TROP2-mediated proliferation and migration in CCA. Together, the alteration of gene expression found after TROP2 silencing indicates that TROP2 may interact with several key molecules that participate in proliferation and migration. Additional investigation of this molecular mechanism would be useful.
In summary, we prove here for the first time that TROP2 was hypermethylated and down-regulated in liver fluke-associated CCA. Suppression of TROP2 expression resulted in markedly enhanced cell proliferation and migration via up-regulation of MARCKS, reduction of EMP1 and FILIP1L, and activation of ERK signaling. These findings suggest a model for TROP2’s role in CCA progression (Figure 6). Our observations shed light on the functional roles of TROP2 in CCA and imply that TROP2 serves as a negative regulator in CCA progression.

Proposed schematic diagram of the effects of TROP2 down-regulation resulting in CCA progression. TROP2 is hypermethylated and down-regulated in CCA. Suppression of TROP2 expression results in up-regulation of MARCKS, reduction of EMP1 and FILIP1L, and activation of ERK signaling. These molecular changes may enhance cell proliferation and migration, and lead to the progression of CCA.
- •
BGS: bisulfite genomic sequencing.
- •
CCA: cholangiocarcinoma.
- •
Ct: threshold cycle.
- •
EMP1: epithelial membrane protein 1.
- •
FFPE: formalin fixed paraffin embedded.
- •
FILIP1L: filamin A interacting protein 1-like protein.
- •
GAPDH: glyceraldehyde 3-phosphate dehydrogenase.
- •
IHC: immunohistochemistry.
- •
MARCKS: myristoylated alanine-rich C kinase substrate.
- •
MTT: methylthiazolyldiphenyl-tetrazolium bromide.
- •
PCR: polymerase chain reaction.
- •
RIPA: radioimmunoprecipitation assay
- •
siRNA: small interfering RNA.
- •
TACSTD2: tumor-associated calcium signal transducer 2.
- •
TROP2: trophoblast cell surface antigen 2.
This work was co-supported by research grants from the Higher Education Research Promotion and NRU Project of Thailand, Office of the Higher Education Commission, through the SHeP-GMS, Khon Kaen University and the invitation research grant (I54224) from Faculty of Medicine, Khon Kaen University. NT was supported by a scholarship from the Liver Fluke and Cholangiocarcinoma Research Center, Faculty of Medicine, Khon Kaen University, Thailand. SW is supported by the TRF Senior Research Scholar Grant, Thailand Research Fund (RTA5780012).
AcknowledgmentsThe authors thank all the subjects who participated in this study. We are grateful to Dr. Banchob Sripa, Faculty of Medicine for providing CCA cell lines in this study.
Conflict of InterestThe authors declare that they have no conflict of interest.


