


Background. The liver possesses two distinct mechanisms for healing. Wound healing via hepatic stem cells recapitulates early development (hepatoblast proliferation), while liver regeneration resembles late embryonic growth (hepatocyte proliferation). Loss of control over both of these processes have been proposed as mechanisms that may contribute to poor outcomes in HCC.
Material and methods. We used microarray gene expression profiles to examine the involvement of hepatic stem cell and hepatocyte proliferation markers and regulators in HCV-induced cirrhosis and HCC. We compared 30 cirrhosis and 49 HCC samples to 12 disease-free control livers.
Results. Cirrhosis and HCC expressed markers of stem cell. Inhibitors of hepatocyte proliferation (HP) were highly expressed in cirrhosis. Loss of these HP inhibitors in HCC patients was associated poor prognosis (94 vs. 38% 2-year recurrence- free survival, p = 0.0003). Principal Components Analysis discriminated cirrhotic and HCC tissues, and HCC patients with poor (< 2 year) vs. good (> 2 year) recurrence-free survival. Loss of CDH1 expression correlated with up-regulation of hepatocyte proliferation promoters MET and YAP1. CDH1, MET, and YAP1 were independent predictors of recurrence-free survival by Cox regression when corrected for tumor stage (p < 0.0001).
Conclusion. HCV-cirrhosis is characterized by proliferation of liver stem cells and inhibition of hepatocyte proliferation. HCC tumors in which this pattern persists have superior outcomes to those which acquire a hepatocyte proliferation signature. Genes in this signature should be studied further for potential as tissue or serum biomarkers for patient risk stratification. CDH1 and MET are candidates for personalized therapies with targeted pharmaceutical agents.
Hepatocellular carcinoma (HCC) is the third leading cause of cancer death worldwide, and its incidence in the United States has more than doubled in the last twenty-five years.1 Due to late detection and lack of treatment options for late-stage disease, one-year survival rates are less than 50% and 5-year survival rates are less than 10% for late-stage disease.1 Because only one-third of newly diagnosed HCC patients are eligible for potential curative therapies,2 early diagnosis and treatment are essential to effective treatment. Patients being treated for chronic liver disease can be monitored for early detection of HCC using ultrasonography every 3-12 months, along with biomarker α-feto-protein (AFP).3 However, AFP alone has been shown to have poor sensitivity and specificity.4 Other non-invasive biomarkers for early detection have been eagerly sought, however specificity has been poor in prospective trials.5,6
In addition to early diagnosis, identification of prognostic sub-types of HCC based on the molecular profile of the patient’s tumor may allow for personalized treatment and/or selection of best candidates for scarce liver transplantation resources. Therapies that block important pathways are being developed, including m-TOR, c-MET, IGF, Hippo, and FGF signaling. Efforts towards incorporating molecular signatures for personalized therapy have been recently reviewed,7 but none have reached clinical practice as yet, due to lack of external validation.8–12
Because cancer is a disease of uncontrolled cell proliferation, we sought to understand the regulation of the proliferative processes in HCC as potential targets for new biomarkers. The liver is unique in that it has two distinct mechanisms for healing. Proliferation and differentiation of hepatic stem cells contributes to wound healing, and liver regeneration after large-scale loss of mass is accomplished by rapid proliferation of the normally quiescent hepatocytes. Chronic liver disease involves sustained wound healing processes that, over time, lead to the scarring that is characteristic of cirrhosis.13 Most liver tumors arise in the context of cirrhosis, and may therefore be a product of “healing gone wrong”. Previous work at our center has shown that HCV-induced cirrhotic tissues express markers of hepatic stem cell (oval cell) proliferation, and simultaneously inhibit hepatocyte proliferation.14 Inhibitors of hepatocyte proliferation appeared to be lost in some tumors, leading us to the hypothesis that poor prognosis might be predicted from the acquisition of a hepatocyte proliferation phenotype.
Three classes of genes regulate hepatocyte quiescence and proliferation: hepatocyte proliferation inhibitors (HPI), antagonists of these HPI, and hepatocyte proliferation promoters. Healthy livers have low expression of all of these genes except the HPI MST1, which is constitutively expressed to maintain hepatocyte quiescence.15 In the present study, we examined the proliferative features of normal, cirrhotic, and HCC liver tissues using an expression signature of hepatic stem cell markers, hepatocyte proliferation markers, and the regulators of hepatocyte proliferation. We found that a subset of tumors displayed a hepatocyte proliferation signature including HPI loss, gain of HPI antagonists, and gain of hepatocyte proliferation promoters, which was associated with two-year recurrence-free survival of less than 40% compared to over 90% survival in tumors without this signature.
Material and MethodsSince 1997, HCV patients diagnosed with cirrhosis and HCC have been evaluated and treated at the Hume-Lee Transplant Center at Virginia Commonwealth University Health System (VCUHS) according to an Institutional Review Board approved study protocol.16 Informed consent was obtained from all patients. If medically indicated, HCC patients had their tumors ablated and were evaluated for liver transplant according to the United Network for Organ Sharing criteria.16 Tissue samples were collected from biopsies and explanted livers according to protocols established by the Liver Tissue Cell Distribution System (Richmond, Virginia, funded by NIH Contract #N01-DK-7-0004/ HHSN267200700004C).17 HCC samples were also collected from the multi-center GR2HCC/A2ALL sub-study consortium. Control liver samples were obtained from explanted donor livers. Donor livers were shown to have normal function and were negative for HCV antibodies. Microarray experiments were performed using the Affymetrix HG-U133A2 GeneChip using protocols published previously.18 As a validation dataset, we also obtained an independent dataset of 75 normal, HCV-cirrhosis and HCC tissues from the Gene Expression Omnibus (NCBI GEO database accession GEO6764), which were analyzed using the Affymetrix HG-U133A-plus2 GeneChip.19
All chips in the study were examined with several quality control tests.17,20 Any chip that fell well outside the recommendations for any of the quality assessment tests was excluded from further analysis. Microarray data files were read into the R (version 2.13) programming environment using updated probe annotations from the BrainArray project (version 14.1.0, HGU133A2_Hs_REFSEQ), which have been shown to improve accuracy of probe-gene mapping over the standard Affymetrix annotation.21
Robust Multichip Average (RMA) pre-processing is broadly accepted as robust, easy to implement, and widely applicable. However, the assumptions of RMA may not be met in cancer samples, namely:
- 1.
Only a small proportion (1-5%) of genes are differentially expressed, and
- 2.
About the same number of genes are over-vs. under-expressed.
We pre-processed a test dataset of normal, cirrhotic, and HCC samples using RMA and carefully examined differential expression results. Comparison of group contrasts identified 25-45% genes that were called as differentially expressed at an FDR < 0.05, and two-thirds of those genes were over-expressed in tumors. This suggested to us that RMA may not be an appropriate method for this data. With this knowledge, we first performed background correction, then normalized the data using non-parametric, distribution-free regression on technical covariates of probes (GC content, melting temperature, and probe location) to estimate and correct for systematic bias.22
Fold-changes were calculated for each sample compared to the mean expression of the normal control group, and averaged for each patient group. Mean fold-change was compared using t-tests and corrected for multiple testing using FDR < 0.05. Joint significance of test results from the two datasets were combined using Fisher’s combined probability test. Cox Proportional Hazards was used to model the effect of proliferation-related genes on recurrence-free survival.
ResultsAfter quality assessment, the VCUHS dataset included 12 non-disease liver controls, 30 samples from HCV-induced cirrhosis, and 49 HCV-induced HCC samples. Twenty-nine (59%) samples were collected from early stage tumors (2 T1 and 27 T2), and 30 (61%) samples were taken after at least one ablation. Twenty-four patients ultimately received a transplant, while the remainder were contra-indicated or progressed while awaiting transplant. The Wurmbach dataset included 9 normal controls, 14 HCV-induced cirrhosis, and 35 HCV-induced HCC (9 T1, 9 T2, 7 T3, and 10 T4).
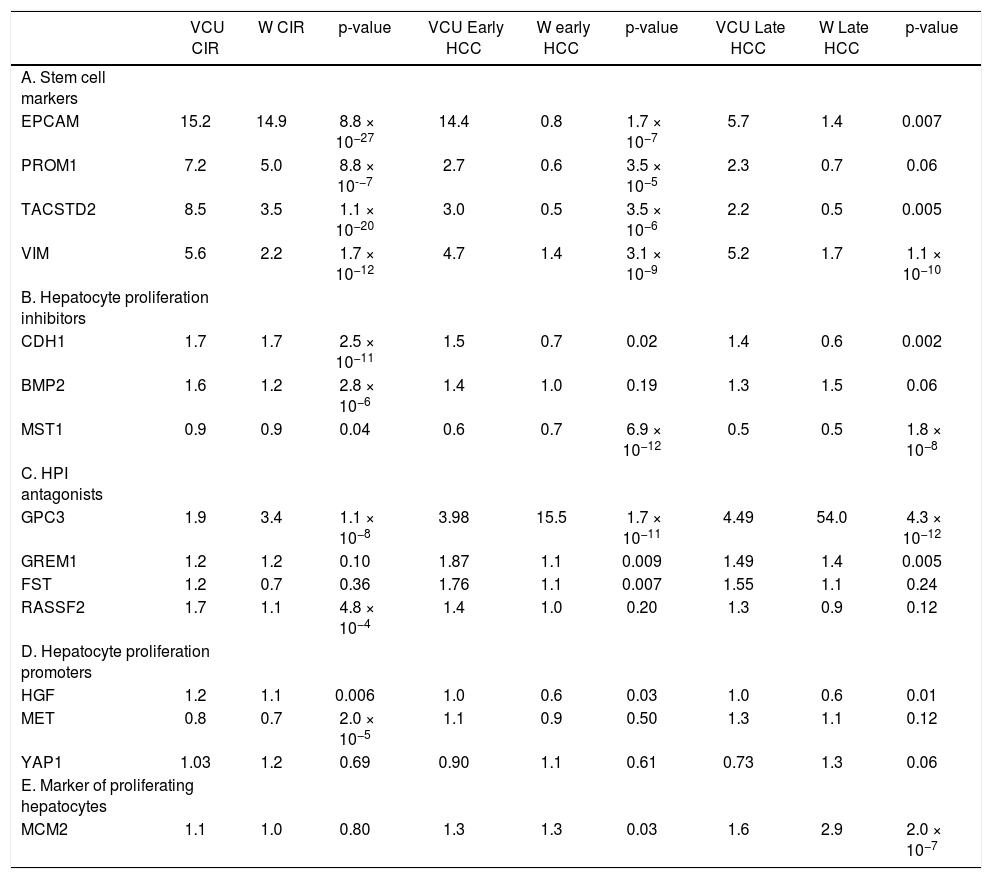
This study focused on 15 genes in a proposed gene signature that included cell surface markers along with regulators of hepatic stem cell and hepatocyte proliferation. Fold-changes compared to normal controls are shown in table 1.
Mean change in gene expression as measured by fold-change compared to normal controls for cirrhotic tissue of patients without HCC, early-stage HCC (Stage I-II), and late-stage HCC (Stage III-IV) in the VCU and Wurmbach (W) datasets. P-values were corrected for multiple testing and combined using Fisher’s combined probability test.
| VCU CIR | W CIR | p-value | VCU Early HCC | W early HCC | p-value | VCU Late HCC | W Late HCC | p-value | |
|---|---|---|---|---|---|---|---|---|---|
| A. Stem cell markers | |||||||||
| EPCAM | 15.2 | 14.9 | 8.8 × 10⁻²⁷ | 14.4 | 0.8 | 1.7 × 10⁻⁷ | 5.7 | 1.4 | 0.007 |
| PROM1 | 7.2 | 5.0 | 8.8 × 10-−7 | 2.7 | 0.6 | 3.5 × 10⁻⁵ | 2.3 | 0.7 | 0.06 |
| TACSTD2 | 8.5 | 3.5 | 1.1 × 10⁻²⁰ | 3.0 | 0.5 | 3.5 × 10⁻⁶ | 2.2 | 0.5 | 0.005 |
| VIM | 5.6 | 2.2 | 1.7 × 10⁻¹² | 4.7 | 1.4 | 3.1 × 10⁻⁹ | 5.2 | 1.7 | 1.1 × 10⁻¹⁰ |
| B. Hepatocyte proliferation inhibitors | |||||||||
| CDH1 | 1.7 | 1.7 | 2.5 × 10⁻¹¹ | 1.5 | 0.7 | 0.02 | 1.4 | 0.6 | 0.002 |
| BMP2 | 1.6 | 1.2 | 2.8 × 10⁻⁶ | 1.4 | 1.0 | 0.19 | 1.3 | 1.5 | 0.06 |
| MST1 | 0.9 | 0.9 | 0.04 | 0.6 | 0.7 | 6.9 × 10⁻¹² | 0.5 | 0.5 | 1.8 × 10⁻⁸ |
| C. HPI antagonists | |||||||||
| GPC3 | 1.9 | 3.4 | 1.1 × 10⁻⁸ | 3.98 | 15.5 | 1.7 × 10⁻¹¹ | 4.49 | 54.0 | 4.3 × 10⁻¹² |
| GREM1 | 1.2 | 1.2 | 0.10 | 1.87 | 1.1 | 0.009 | 1.49 | 1.4 | 0.005 |
| FST | 1.2 | 0.7 | 0.36 | 1.76 | 1.1 | 0.007 | 1.55 | 1.1 | 0.24 |
| RASSF2 | 1.7 | 1.1 | 4.8 × 10⁻⁴ | 1.4 | 1.0 | 0.20 | 1.3 | 0.9 | 0.12 |
| D. Hepatocyte proliferation promoters | |||||||||
| HGF | 1.2 | 1.1 | 0.006 | 1.0 | 0.6 | 0.03 | 1.0 | 0.6 | 0.01 |
| MET | 0.8 | 0.7 | 2.0 × 10⁻⁵ | 1.1 | 0.9 | 0.50 | 1.3 | 1.1 | 0.12 |
| YAP1 | 1.03 | 1.2 | 0.69 | 0.90 | 1.1 | 0.61 | 0.73 | 1.3 | 0.06 |
| E. Marker of proliferating hepatocytes | |||||||||
| MCM2 | 1.1 | 1.0 | 0.80 | 1.3 | 1.3 | 0.03 | 1.6 | 2.9 | 2.0 × 10⁻⁷ |
The presence of hepatic stem cell markers suggests active proliferation and migration of stem cells out of the canals of Hering in the bile ducts and into the liver parenchyma. Hepatic stem cell markers EPCAM, PROM1, VIM, and TACSTD2 were over-expressed in cirrhotic compared to normal tissues in both the VCUHS and Wurmbach samples. EPCAM was expressed 15-fold higher in both datasets, while up-regulation of PROM1, VIM, and TACSTD2 ranged from 2.2 to 8.5 times normal levels. In VCUHS tumor samples, expression of stem cell markers was lower than in cirrhotic tissues but still elevated compared to normal tissue. In the Wurmbach dataset, expression of all the stem cell markers was dramatically reduced to normal or below normal levels in tumor samples (Table 1A).
Expression of hepatocyte proliferation inhibitors and their antagonistsHepatocyte proliferation inhibitors (HPI) CDH1 and BMP2, normally expressed at low levels, were up-regulated in cirrhosis tissues. MST1, which is expressed at high levels in a healthy liver, remained highly expressed in cirrhosis in both datasets. In the VCUHS samples, both early and late-stage HCC had mean expression of CDH1 and BMP2 similar to that of normal tissue, and down-regulated MST1. Samples in the Wurmbach dataset followed the same pattern, with even greater down-regulation of CDH1 in late-stage tumors (Table 1B). Antagonists of hepatocyte proliferation inhibitors are required to overcome hepatocyte quiescence and allow liver regeneration. In the VCUHS data, BMP antagonist GPC3 is slightly up-regulated in cirrhosis, while all of the BMP antagonists (GPC3, GREM1, and FST) were over-expressed in HCC. GPC3 was strongly upregulated in tumors in the Wurmbach data (15-fold in early tumors and 54-fold in late tumors) while GREM1 and FST remained near normal levels. Average expression RASSF2, the MST1 antagonist, was not elevated compared to normal tissue in either dataset (Table 1C).
Expression of hepatocyte proliferation promoters and markersPromoters of hepatocyte proliferation include hepatocyte growth factor (HGF) secreted by activated hepatic stellate cells, HGF receptor MET expressed on hepatocytes, and YAP1. HGF is expressed at low levels in healthy livers and was not differentially expressed in the VCUHS samples. MET is down-regulated in cirrhosis but not tumors in both datasets, suggesting that hepatocytes are less responsive to HGF signaling in cirrhosis but may become responsive in tumors. Mean expression of YAP1 was not altered in cirrhosis or in tumors (Table 1D). MCM2, a marker of proliferating hepatocytes, was mildly over-expressed in early HCC and increased further in late HCC in both datasets (Table 1E).
Hepatocyte proliferation and recurrence-free survivalAlthough mean expression of several genes in the propose signature did not change between groups, variability was high in tumors. This suggested the presence of sub-groups with different expression patterns. Because we hypothesized that hepatocyte proliferation predicts poor outcome, we examined gene expression in the context of recurrence-free survival. Figure 1 shows a heat map of the expression (fold-change compared to mean expression of normal control samples) of hepatic stem cell and proliferation genes in the VCUHS data, ordered by the length of recurrence-free survival time. Expression of hepatic stem cell markers was highest in the tumors with the longest survival times. The patients with the best survival times (> 5 years) had the highest levels of the HPIs CDH1 and MST1, with expression decreasing with decreased survival time. Conversely, hepatocyte proliferation promoters MET and YAP1, and BMP inhibitor GPC3, had increased expression in the patients with the poorest survival times. GREM1 appeared to be associated with better survival, and closer examination revealed that it was only expressed in post-ablation samples and was mildly associated with better survival times in treated tumors. However, the small number of treated tumors prevented a more in-depth analysis.

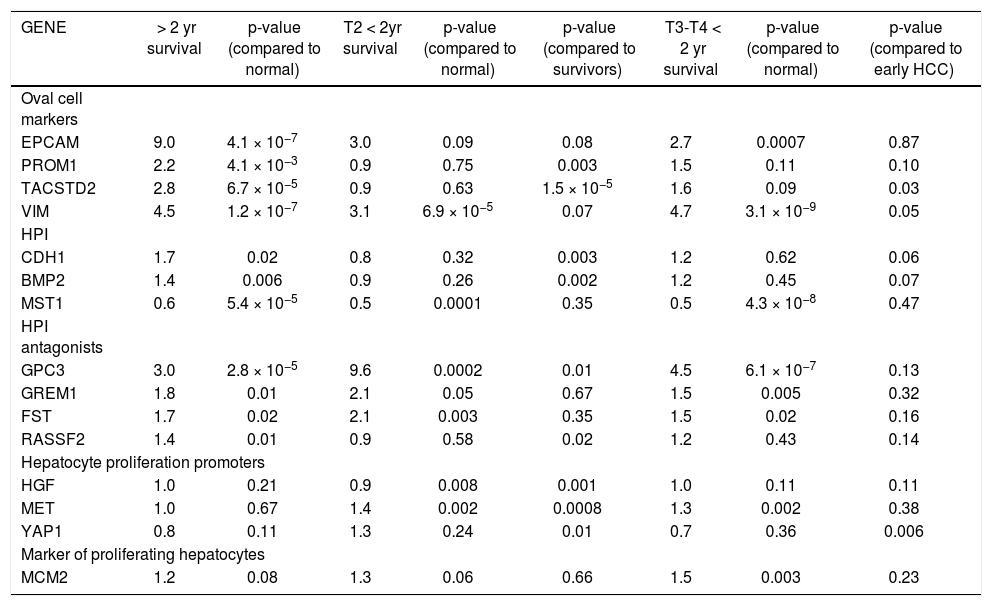
Median survival time was two years. Table 2 shows the mean fold-change of the proliferative genes (compared to normal controls) for the patients with > 2 year recurrence-free survival (RFS), early stage HCC with < 2 year survival, and late stage HCC with < 2 year survival. Fold-changes are compared to normal controls and between survival groups. Patients with > 2 year survival had significantly higher expression of hepatic stem cell markers than normal controls and patients with < 2 year survival. Expression of CDH1 and BMP2 was also significantly higher in the surviving group compared to normal controls (p = 0.0002 and 0.006, respectively) and early-stage tumors with < 2 years survival (p = 0.003, 0.002 respectively). MST1, which is constitutively active in healthy liver, was significantly down-regulated in all three groups compared to normal controls. HGF was not significantly changed in any group. MET was over-expressed in both early and late tumors with poor RFS (p = 0.002). The BMP inhibitors showed the highest expression in the early-stage tumors with poor survival. MCM2 was significantly over-expressed only in the late-stage tumors (p = 0.003). Principal Components Analysis (PCA) demonstrated that the proliferation-associated genes can largely discriminate between cirrhotic and HCC tissues, and between HCC patients with poor (< 2 year) vs. good (> 2 year) recurrence-free survival in both early and late stage tumors (Figure 2).
Mean change in gene expression as measured by fold-change compared to normal controls for patients with more th; two year recurrence-free survival, compared with stage T2 patients who had recurrence or death within two years of diagnosi and stage T3 and T4 patients with < 2 year recurrence/death.
| GENE | > 2 yr survival | p-value (compared to normal) | T2 < 2yr survival | p-value (compared to normal) | p-value (compared to survivors) | T3-T4 < 2 yr survival | p-value (compared to normal) | p-value (compared to early HCC) |
|---|---|---|---|---|---|---|---|---|
| Oval cell markers | ||||||||
| EPCAM | 9.0 | 4.1 × 10⁻⁷ | 3.0 | 0.09 | 0.08 | 2.7 | 0.0007 | 0.87 |
| PROM1 | 2.2 | 4.1 × 10⁻³ | 0.9 | 0.75 | 0.003 | 1.5 | 0.11 | 0.10 |
| TACSTD2 | 2.8 | 6.7 × 10⁻⁵ | 0.9 | 0.63 | 1.5 × 10⁻⁵ | 1.6 | 0.09 | 0.03 |
| VIM | 4.5 | 1.2 × 10⁻⁷ | 3.1 | 6.9 × 10⁻⁵ | 0.07 | 4.7 | 3.1 × 10⁻⁹ | 0.05 |
| HPI | ||||||||
| CDH1 | 1.7 | 0.02 | 0.8 | 0.32 | 0.003 | 1.2 | 0.62 | 0.06 |
| BMP2 | 1.4 | 0.006 | 0.9 | 0.26 | 0.002 | 1.2 | 0.45 | 0.07 |
| MST1 | 0.6 | 5.4 × 10⁻⁵ | 0.5 | 0.0001 | 0.35 | 0.5 | 4.3 × 10⁻⁸ | 0.47 |
| HPI antagonists | ||||||||
| GPC3 | 3.0 | 2.8 × 10⁻⁵ | 9.6 | 0.0002 | 0.01 | 4.5 | 6.1 × 10⁻⁷ | 0.13 |
| GREM1 | 1.8 | 0.01 | 2.1 | 0.05 | 0.67 | 1.5 | 0.005 | 0.32 |
| FST | 1.7 | 0.02 | 2.1 | 0.003 | 0.35 | 1.5 | 0.02 | 0.16 |
| RASSF2 | 1.4 | 0.01 | 0.9 | 0.58 | 0.02 | 1.2 | 0.43 | 0.14 |
| Hepatocyte proliferation promoters | ||||||||
| HGF | 1.0 | 0.21 | 0.9 | 0.008 | 0.001 | 1.0 | 0.11 | 0.11 |
| MET | 1.0 | 0.67 | 1.4 | 0.002 | 0.0008 | 1.3 | 0.002 | 0.38 |
| YAP1 | 0.8 | 0.11 | 1.3 | 0.24 | 0.01 | 0.7 | 0.36 | 0.006 |
| Marker of proliferating hepatocytes | ||||||||
| MCM2 | 1.2 | 0.08 | 1.3 | 0.06 | 0.66 | 1.5 | 0.003 | 0.23 |

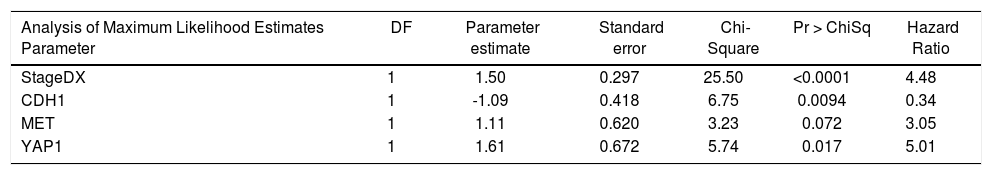
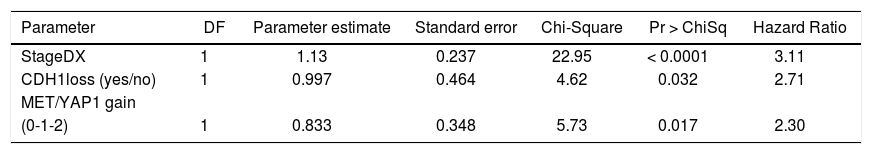
We then performed Cox proportional hazards regression on recurrence-free survival, correcting for tumor stage at diagnosis. Individually, EPCAM, HGF, MET, YAP1, CDH1, MST1, and GPC3 were associated with survival (p < 0.1). In the multivariate Cox model, CDH1 and YAP1 were independent predictors of survival (HR = 0.34 and 5.0, p = 0.009 and 0.02, respectively). MET was a weakly independent predictor (HR = 3.05, p = 0.07) (Table 3A). We were also interested in whether a simple gain/loss gene expression model would be predictive. We constructed index variables representing loss of CDH1, over-expression (FC < 1.25 compared to controls); MST1 or BMP2 loss (FC < 0.75 compared to controls); and a summary score HPI loss representing the number of hepatocyte proliferation inhibitors with loss of expression (0, 1, 2, or 3). Similarly, MET and YAP gains were defined as FC > 1.25 compared to normal controls and HPP gain as the number of hepatocyte proliferation promoters over-expressed (0, 1, or 2). Corrected for stage at diagnosis, significant predictors of time to recurrence/death were CDH1 loss (HR = 2.71, p = 0.03) and HPP gain (HR = 2.3, p = 0.02) (Table 3B). This suggests that loss of CDH1 over-expression, regardless of magnitude, predicts poor recurrence-free survival. MET and YAP1 gain were individually less common events but over-expression of either growth factor was an independent predictor of outcomes.
Cox proportional hazards modeling of expression levels of proliferation genes, corrected for stage at diagnosis. The final model was highly significant (p < 0.0001).
| Analysis of Maximum Likelihood Estimates Parameter | DF | Parameter estimate | Standard error | Chi-Square | Pr > ChiSq | Hazard Ratio |
|---|---|---|---|---|---|---|
| StageDX | 1 | 1.50 | 0.297 | 25.50 | <0.0001 | 4.48 |
| CDH1 | 1 | -1.09 | 0.418 | 6.75 | 0.0094 | 0.34 |
| MET | 1 | 1.11 | 0.620 | 3.23 | 0.072 | 3.05 |
| YAP1 | 1 | 1.61 | 0.672 | 5.74 | 0.017 | 5.01 |
Cox proportional hazards modeling of proliferation gene index variables, corrected for stage at diagnosis. The final model was highly significant (p < 0.0001).
| Parameter | DF | Parameter estimate | Standard error | Chi-Square | Pr > ChiSq | Hazard Ratio |
|---|---|---|---|---|---|---|
| StageDX | 1 | 1.13 | 0.237 | 22.95 | < 0.0001 | 3.11 |
| CDH1loss (yes/no) | 1 | 0.997 | 0.464 | 4.62 | 0.032 | 2.71 |
| MET/YAP1 gain | ||||||
| (0-1-2) | 1 | 0.833 | 0.348 | 5.73 | 0.017 | 2.30 |
In this study, we sought to understand which liver cell types were engaged in cirrhosis and in the development and progression of HCV-induced HCC, and how these processes are regulated. Hepatic stem cell proliferation can be assessed by measuring the expression of specific cell surface markers including EPCAM, PROM1, TACSTD2, and VIM. DNA replication licensing factor MCM2 expression is specific to replicating hepatocytes in the liver. Hepatocytes are normally quiescent in the healthy liver, but can be induced to proliferate (regenerate) under conditions of extreme toxicity or loss of mass. The dormant state is maintained by several inhibitors including BMP2 and E-Cadherin (CDH1). CDH1 and BMP2 are normally expressed at low levels in the healthy liver. CDH1 is both a cell cycle regulator required for G1 cell cycle arrest, and a cell-cell adhesion molecule in epithelial cells,23 and BMP2 negatively regulates proliferation near the central and portal veins.24 MST1 is normally expressed at high levels throughout the liver. MST1 maintains hepatocyte quiescence through inactivation of proliferation promoter yes-associated protein 1 (YAP1). MST1 and YAP1 are part of the Hippo pathway that regulates contact inhibition of growth.25 Hepatocyte Growth Factor (HGF) and its receptor c-Met (MET) are hepatocyte proliferation promoters that are activated after massive liver injury to initiate liver regeneration. Each of the HPI are regulated by antagonistic proteins. There are several BMP2 inhibitors, but the main ones expressed in the liver are GPC3, GREM1, and FST. Regulation of MST1 is less well understood but RASSF2 is a candidate.26 CDH1 is regulated by several signal transduction pathways including the Hippo pathway (MST1 and YAP1), SNAIL, ZEB, and TWIST families.27
There has been a long-standing debate whether HCC originates from proliferation and differentiation of hepatic stem cells or the de-differentiation of mature hepatocytes. Recently, Wang, et al.28 showed that the Hepatitis B virus X induces transformation of hepatic stem cells, supporting the prognostic subtype proposed by Lee, et al.29 and suggesting a stem cell origin for at least HBV-induced HCC. Machida, et al.30 also recently demonstrated that HCV-infected hepatic stem cells are oncogenic in vitro, and that this is mediated by YAP1 acting on the TLR4/ NANOG pathway. Conversely, Battaglia, et al.31suggest that HCV core protein expression in hepatocytes shifts the role of TGF-β from tumor suppression to epithelial-to-mesenchymal transition. Taken together, the evidence suggests that tumor origin may be either hepatocytes or stem cells, or both.
Our results demonstrated that hepatic stem cell proliferation is an active process in cirrhosis, while hepatocyte proliferation was universally suppressed via HPI. Micro-dissected tumor samples displayed markers of both stem cell and hepatocyte proliferation, and samples from patients with poor outcomes displayed a pattern of reduced hepatocyte proliferation inhibition and increased hepatocyte proliferation promoter and marker expression. Patients with the poorest survival times also had decreased levels of stem cell markers compared to cirrhotic tissue and tumors from patients with longer survival times. Hepatocyte proliferation inhibitors CDH1 and MST1, hepatocyte proliferation promoter MET, and BMP inhibitor GPC3 expression levels were independently associated with recurrence free survival. The Principal Components Analysis supports these results by graphically displaying the separation of patients into prognostic groups based on the expression of these genes. Unfortunately, patient outcomes were not available for the Wurmbach dataset acquired from GEO. However, the general pattern of stem cell proliferation and hepatocyte proliferation inhibition was present in the Wurmbach cirrhosis samples, as were loss of CDH1 and MST1 expression in HCC samples and the over-expression of MCM2 in advanced tumors. Promoters of hepatocyte proliferation were not over-expressed in this data, but GPC3 was highly over-expressed in tumors compared to VCUHS data. This may reflect the inclusion of more advanced and metastatic tumors. GPC3 expression was correlated to AFP expression, and the Wurmbach dataset had 90% AFP+ samples compared to only 25% AFP+ in the VCUHS data.
Other proposed signatures have included some of these same markers, but without biological context and often as small parts of large gene sets that are impractical for clinical use.32–35 Our results suggest that a simple signature of less than 10 genes may identify a prognostic sub-type of HCV-induced HCC that acquires a hepatocyte-proliferation phenotype and has poor survival compared to tumors that maintain hepatocyte quiescence. These preliminary findings suggest that patients presenting with strong expression of CDH1 and MST1 and low expression of MET and YAP1 at diagnosis may be good candidates for successful liver transplant regardless of whether they fit within or beyond the Milan classification.
This study was limited by the observational design. Tumors were collected from a broad range of patients, including incidental tumors found at explant, ablated and treatment-naïve tumors. Approximately half of the patients progressed to transplant, while others were contra-indicated for transplant or progressed/died while awaiting transplant. HPI loss was evident in about half of the early tumor samples and most of the advanced tumors. We could not determine whether HPI loss is an early event in carcinogenesis that determines tumor aggressiveness, or whether it was acquired as tumors progressed.
ConclusionWe have identified novel potential biomarkers stratifying risk for patients with HCV-induced HCC presenting for tumor ablation and transplant, and for surveillance of patients on the transplant waiting list. Future work includes prospective validation of the prognostic value of this gene signature on biopsy, with concurrent proteomic analysis of peripheral blood. CDH1 DNA methylation status in particular has demonstrated potential biomarker utility in other cancers.37,38 In addition, we found that the BMP inhibitor GREM1 was only expressed in ablated tumors, and that over-expression was associated with better recurrence-free survival. To our knowledge the effect of ablation on gene expression has not been studied. We are currently planning a prospective study comparing gene expression in paired pre-ablation biopsy and post-ablation biopsy or explant samples, in order to characterize the gene expression changes that accompany tumor ablation, identify markers of successful treatment or predictors of recurrence, and validate the prognostic value of GREM1. This study was also focused on patients with HCV-induced HCC, with or without concurrent diabetes and history of alcohol abuse. Recent work suggests that HCC arising from Non-Alcoholic SteatoHepatitis (NASH) and alcohol abuse have similar gene expression profiles, and our prospective study will attempt to broaden the applicability of the proliferation signature to NASH and alcohol etiologies.
Financial SupportThis work was supported by NIDDK grant 5R01DK069859-05.
Abbreviations- •
A2ALL: adult to adult living donor transplantation cohort study.
- •
AFP: alpha-fetoprotein.
- •
aHPI: antagonist of hepatocyte proliferation inhibitor.
- •
BMP2: bone morphogenic protein 2.
- •
CDH1: E-Cadherin.
- •
EPCAM: epithelial cell adhesion molecule.
- •
FDR: false discovery rate.
- •
FGF: fibroblast growth factor.
- •
GEO: Gene expression omnibus.
- •
GPC3: glypican 3.
- •
GR2HCC: Genes related to hepatocellular (HCC) progression in living donor (LD) and deceased donor (DD) liver transplant; sub-study of A2ALL.
- •
GREM1: gremlin 1.
- •
HCC: hepatocellular carcinoma.
- •
HCV: HCC-HCV induced HCC.
- •
HCV: hepatitis C virus.
- •
HGF: hepatocyte growth factor.
- •
HPI: hepatocyte proliferation inhibitor.
- •
HPP: hepatocyte proliferation promoter.
- •
IGF: insulin-like growth factor 1.
- •
KRT19: keratin 19.
- •
MCM2: minichromosome maintenance complex component 2.
- •
MET: met proto-oncogene (hepatocyte growth factor receptor).
- •
MST1: macrophage stimulating 1 (hepatocyte growth factor-like).
- •
m-TOR: mechanistic target of rapamycin (serine/ threonine kinase).
- •
NCBI: National Center for Biotechnology Information.
- •
PCA: principal components analysis.
- •
PROM1: prominin 1.
- •
RMA: robust multichip average normalization.
- •
TACSTD2: tumor-associated calcium signal transducer 2.
- •
VCUHS: Virginia Commonwealth University Health System.
- •
VIM: vimentin.
- •
YAP1: Yes-associated protein 1.


