


Background and aims. Secreted frizzled-related protein 5 (SFRP5) was recently described as a new adipokine protective for hepatic steatosis and other obesity-related complications in the mouse model. To date, SFRP5 expression in non-alcoholic fatty liver disease (NAFLD) has not been fully assessed in humans. We measured circulating SFRP5 levels and its expression in liver and adipose tissue, and evaluated its association with NAFLD in morbidly obese women.
Material and methods. Fifty-four morbidly obese women undergoing bariatric surgery were included in the study. Liver biopsies were used for histology and hepatic triglyceride content quantification. Circulating SFRP5 levels were measured through enzyme-linked immunoabsorbent assay, and SFRP5 expression was performed in hepatic and adipose tissue (subcutaneous and visceral).
Results. Although circulating SFRP5 levels showed a tendency to decrease with NAFLD progression, no significant differences were observed among non-alcoholic steatosis, steatohepatitis, and control subjects. Hepatic SFRP5 expression showed a negative correlation with hepatic triglyceride content (r = -0.349, P = 0.016 for mRNA and r = -0.291, P = 0.040 for SRFP5 protein) and ALT serum levels (r = -0.437, P = 0.001 for SRFP5 protein). In addition, hepatic SFRP5 protein levels were significantly lower in NASH than in control subjects (P = 0.006). Conclusion. This is the first study reporting an association of hepatic SFRP5 expression with NAFLD in humans.
Non-alcoholic fatty liver disease (NAFLD) has become one of the most common liver diseases in western countries, showing the highest prevalence in Hispanic populations.1–4 NAFLD ranges from simple steatosis to non-alcoholic steatohepatitis (NASH) characterized by fatty liver with inflammation and hepatocellular injury.5,6 Obesity is one of the major risk factors for NAFLD, present in up to 95% of morbidly obese patients.7,8 Adipose tissue dysfunction results in altered profiles of adipokine secretion contributing to NAFLD development.9,10 To date, adiponectin is the only adipokine recognized to have a protective effect on NAFLD, as demonstrated by several studies associating high levels of adiponectin with a reduced risk of NAFLD in humans.11–14 Recent studies in mice suggest that Sfrp5 (secreted frizzled-related protein 5) is also a protective adipokine for glucose intolerance, hepatic steatosis and fibrosis.15,16 However, the role of Sfrp5 in humans is not clear. Although serum SFRP5 levels have been found to be higher in lean and non-type 2 diabetes subjects than in obese and type 2 diabetes patients;17,18 other studies have reported opposite results.19,20 Moreover, Catalán, et al.21 recently found no differences in SFRP5 serum concentrations in NAFLD patients and controls.
Although in mouse model Sfrp5 is expressed at substantially higher in white adipose tissue (WAT) than in others tissues,15 in humans this protein is not actively secreted by WAT and its expression is higher in liver than in adipose tissue; however, its role in human NAFLD is not fully understood.21,22
The aim of the present study was to characterize serum, hepatic and adipose tissue expression of SFRP5 mRNA and protein, and to explore its association with NAFLD in morbidly obese women.
Material and MethodsSubjectsThe present cross-sectional study included 54 morbidly obese Mexican women aged 21-60 years. All participants underwent bariatric surgery at the Hospital General Dr. Rubén Leñero in Mexico City. During surgery, wedge biopsies from the free border of the left liver lobe and adipose tissue biopsies (visceral and subcutaneous) were obtained from all patients. Subjects with positive serology tests for hepatitis B surface antigen (HBsAg) and hepatitis C antibody (anti-HCV) (Ortho Clinical Diagnostic Johnson-Johnson, UK), or with alcohol consumption > 20 g/day were not included in the study. All participants provided informed consent. The study protocol conformed to the 1975 Declaration of Helsinki ethical guidelines, and the Ethics Committee of the Instituto Nacional de Medicina Genómica (INMEGEN) approved the research.
Anthropometric and biochemical parametersBody mass index (BMI) was defined as weight in kilograms divided by the square of height in meters (kg/m2). Blood samples were taken after a 10-h overnight fast for biochemical measurements. Blood glucose, insulin, triglycerides, total and HDL cholesterol (HDL-C) were measured as previously described,23 and insulin sensitivity was calculated using the homeostatic model assessment for insulin resistance (HOMA-IR) index.24 Serum concentrations of aspartate aminotransferase (AST), alanine aminotransferase (ALT) and gamma glutamyl transpeptidase (GGT) were measured with commercially available standardized methods (Beckman Coulter, Fullerton, CA, USA). Serum adiponectin and leptin levels were determined using commercially available enzymatic kits (EMD Millipore, St. Charles, MO, USA). Serum SFRP5 levels were measured in duplicate in 47 out of 54 subjects, using commercial enzyme-linked immunoabsorbent assay (ELISA) kits (MyBioSource, San Diego, California, USA). Serum samples were not available from 7 subjects. Type 2 diabetes (T2D) was defined as either self-reported use of hypoglycemic agents or fasting plasma glucose levels ≥ 126 mg/dL.25 Under these criteria, 23 patients had T2D (13 receiving hypoglycemiant treatment: 8 with metformin monotherapy and 5 with metformin/glibenclamide combination).
Liver histologyLiver biopsy specimens were fixed in 10% formaldehyde, embedded in paraffin, stained with hematoxylin-eosin and Masson’s trichrome, and evaluated by an experienced pathologist. Histological characteristics were determined according to the Kleiner scoring system.26 Steatosis was scored in a scale 0-3, grade of inflammation 0-3, and hepatocellular ballooning 0-2. These histopathological features were used to estimate NAFLD activity score (NAS). All participants were classified as controls (subjects without steatosis), individuals with hepatic steatosis (NAS ranging from 1 to 2), individuals with nondefining NASH (NAS ranging from 3 to 4), and individuals with NAS ≥ 5 were considered as NASH. Fibrosis was staged in grade 0-4.
Gene expression analysisTotal RNA was extracted from visceral and subcutaneous adipose tissue using the RNeasy Lipid Tissue Mini kit (Qiagen, Germantown, Maryland, USA), and from hepatic tissue using Trizol reagent (Invitrogen, Life Technologies, Carlsbad, CA, USA). 500 ng of total RNA were used for cDNA synthesis using TaqMan Reverse Transcription Reagent (Applied Biosystems, Foster City, CA, USA). Expression of SFRP5 and the housekeeping genes (ACTB β-actin and GAPDH glyceraldehyde-3-phosphate dehydrogenase) were determined by quantitative PCR using the LightCycler TaqMan Master Real time PCR kit in a Light Cycler 480 II thermal cycler (Roche, Rotkreuz, Switzerland). TaqMan Gene expression assay Hs00169366_m1 (Applied Biosystems) was used to quantify SFRP5 mRNA levels. For housekeeping genes, pre-validated assays using LNA Taqman probes from the Universal ProbeLibrary (Roche) and specific primers were used. ACTB (NM_001101) mRNA expression was measured as reference using primers CCAACCGCGAGAAGATGA (forward) and CCAGAGGCGTACAGGGATAG (reverse), and probe #64 (Cat. No. 04688635001); GAPDH (NM_002046) mRNA expression was measured as reference using primers AGCCACATCGCTCAGACAC (forward) and GCCCAATACGACCAAATCC (reverse), and probe #60. Relative mRNA levels were calculated with LightCycler Relative Quantification Analysis software.
Protein expression analysisLiver and adipose tissue biopsies (70 mg) were homogenized in cold RIPA buffer supplemented with protease inhibitors (Roche). Total protein concentration was quantified using the DC protein Assay (Bio-Rad, Richmond, CA, USA). Protein extracts (50 μg) were separated by SDS-PAGE on 10% gels and transferred to polyvinylidine fluoride membranes (GE Healthcare/Amersham Biosciences, Piscataway, NJ, USA). Membranes were incubated overnight with goat anti-SFRP5’ or mouse anti-a-tubulin primary antibodies (Santa Cruz Biotechnology, Santa Cruz, CA, USA). α-tubulin was used as constitutive protein. Immunoreactive proteins were visualized by enhanced chemiluminescence (ECL, Millipore, Billerica, MA, USA), and blots were quantified using ImageJ software (http://rsb.info.nih.gov/ij/). All samples were analyzed in duplicate and results are presented as SFRP5/a-tubulin ratio.
Hepatic triglyceride contentLiver tissue (50 mg) was homogenized in saline solution (0.9%) and total lipids were extracted with the Folch method.27 Briefly, total lipids were extracted in chloroform/methanol (2:1 vol/vol). The organic phase was dried under nitrogen stream, lipids were re-suspended in isopropanol and 10% Triton X-100. Triglyceride concentrations were determined by spectrophotometry (Beckman DU 640, Beckman Instruments, Fullerton, CA), using commercial colorimetric assay kits (Diagnostic systems, Holzheim Germany) and normalized to total protein concentration.
ImmunohistochemistryFormalin-fixed liver samples from a non-NASH individual were processed; 3-µm thick paraffin sections were used for SFRP5 immunohistochemistry. Briefly, deparaffinized liver sections were treated by antigen retrieval with 20X ImmunoDNA Retriever Citrate, and then blocked with ImmunoDetector Peroxidase Blocker (Bios SB, Santa Barbara CA, USA). Protein was identified by two different anti-SFRP5 antibodies (mouse monoclonal and goat polyclonal, Santa Cruz Biotechnology). Liver samples were then treated with the corresponding probe (mouse or goat) followed by Mouse- or Goat-On-Rodent HRP-Polymer (Biocare Medical, Concord, CA, USA) and DAB chromogen. Samples were counterstained with hematoxylin.
Nuclear and cytoplasm SFRP5 quantificationNuclear and cytoplasm proteins were isolated from hepatic tissue (100 mg) using a protein isolation kit (ProteoJET Cytoplasmic and Nuclear Protein Extraction kit, Fermentas, Canada). Protein concentrations were determined using the DC protein Assay. SFRP5 immunoblots were performed in nuclear and cytoplasm proteins (20 µg) in SDS-PAGE on 10% gels as previously described.
Statistical analysisSFRP5 mRNA and protein levels, serum insulin, triglyceride, AST, ALT, and GGT levels, HOMA-IR and hepatic triglyceride content were log-transformed to achieve normal distribution. Statistical differences among study groups were calculated using ANOVA or Kruskal-Wallis test for numeric variables, depending on variables’ distribution. Chi square test was used for nominal categorical variables. Correlations were obtained by Spearman’s test. Moreover, multivariate linear regression models were fit to construct a predictive model for NAFLD activity score. The main effects of age, BMI, triglycerides, total cholesterol, HDL-C, adiponectin, leptin, insulin levels, HOMA-IR, AST, ALT and hepatic SFRP5 protein content were included, and a stepwise backward elimination procedure was used to exclude predictors from the model. P values < 0.05 were considered significant. Analyses were conducted with the SPSS v.14 program (SPSS, Chicago, USA).
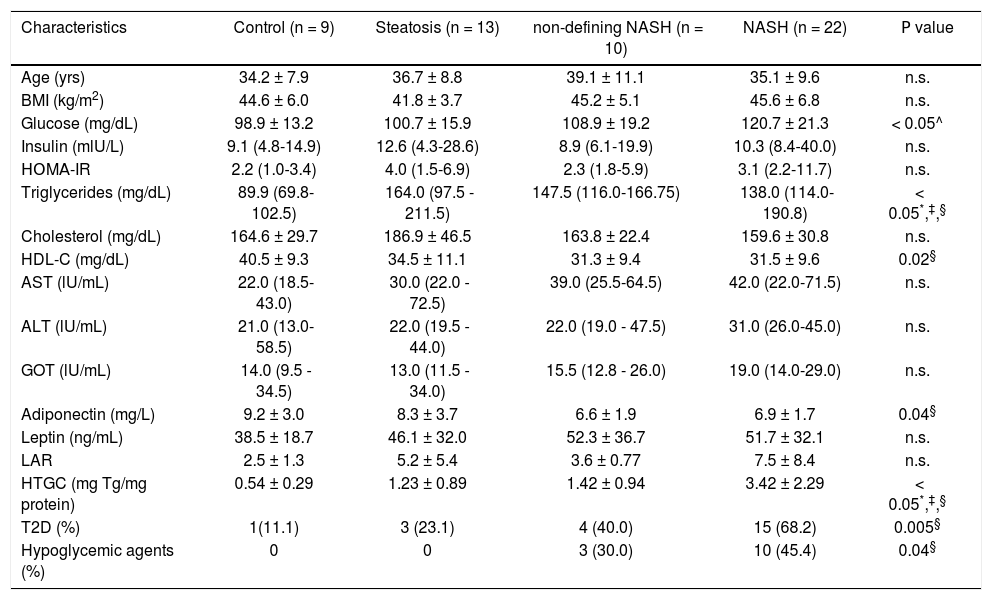
ResultsThe study included fifty-four consecutive morbidly obese female patients, 9 subjects without steatosis (17.7%), 13 subjects with steatosis (24.1%), 10 subjects with non-defining NASH (17.5%), and 22 subjects with NASH (40.7%). Comparison of clinical and biochemical characteristics among groups are shown in table 1. Of note, triglyceride serum levels were significantly lower in controls as compared to all NAFLD groups, and HDL-C serum levels were higher in controls, although the difference was statistically significant only when compared to the NASH group. Moreover, the NASH group showed lower serum adiponectin levels as compared to the control group (P = 0.04, adjusted for T2D and hypoglycemic treatment). As expected, hepatic triglyceride content (HTGC) clearly increased according to the level of liver damage. Accordingly, the frequency of individuals with T2D subjects also increased with NAFLD progression; however, only the difference between the control and NASH groups was statistically significant.
Anthropometric and biochemical parameters of the study participants.
| Characteristics | Control (n = 9) | Steatosis (n = 13) | non-defining NASH (n = 10) | NASH (n = 22) | Ρ value |
|---|---|---|---|---|---|
| Age (yrs) | 34.2 ± 7.9 | 36.7 ± 8.8 | 39.1 ± 11.1 | 35.1 ± 9.6 | n.s. |
| BMI (kg/m2) | 44.6 ± 6.0 | 41.8 ± 3.7 | 45.2 ± 5.1 | 45.6 ± 6.8 | n.s. |
| Glucose (mg/dL) | 98.9 ± 13.2 | 100.7 ± 15.9 | 108.9 ± 19.2 | 120.7 ± 21.3 | < 0.05^ |
| Insulin (mlU/L) | 9.1 (4.8-14.9) | 12.6 (4.3-28.6) | 8.9 (6.1-19.9) | 10.3 (8.4-40.0) | n.s. |
| ΗΟMΑ-IR | 2.2 (1.0-3.4) | 4.0 (1.5-6.9) | 2.3 (1.8-5.9) | 3.1 (2.2-11.7) | n.s. |
| Triglycerides (mg/dL) | 89.9 (69.8-102.5) | 164.0 (97.5 - 211.5) | 147.5 (116.0-166.75) | 138.0 (114.0-190.8) | < 0.05*,‡,§ |
| Cholesterol (mg/dL) | 164.6 ± 29.7 | 186.9 ± 46.5 | 163.8 ± 22.4 | 159.6 ± 30.8 | n.s. |
| HDL-C (mg/dL) | 40.5 ± 9.3 | 34.5 ± 11.1 | 31.3 ± 9.4 | 31.5 ± 9.6 | 0.02§ |
| AST (lU/mL) | 22.0 (18.5-43.0) | 30.0 (22.0 - 72.5) | 39.0 (25.5-64.5) | 42.0 (22.0-71.5) | n.s. |
| ALT (lU/mL) | 21.0 (13.0-58.5) | 22.0 (19.5 - 44.0) | 22.0 (19.0 - 47.5) | 31.0 (26.0-45.0) | n.s. |
| GOT (lU/mL) | 14.0 (9.5 - 34.5) | 13.0 (11.5 - 34.0) | 15.5 (12.8 - 26.0) | 19.0 (14.0-29.0) | n.s. |
| Adiponectin (mg/L) | 9.2 ± 3.0 | 8.3 ± 3.7 | 6.6 ± 1.9 | 6.9 ± 1.7 | 0.04§ |
| Leptin (ng/mL) | 38.5 ± 18.7 | 46.1 ± 32.0 | 52.3 ± 36.7 | 51.7 ± 32.1 | n.s. |
| LAR | 2.5 ± 1.3 | 5.2 ± 5.4 | 3.6 ± 0.77 | 7.5 ± 8.4 | n.s. |
| HTGC (mg Tg/mg protein) | 0.54 ± 0.29 | 1.23 ± 0.89 | 1.42 ± 0.94 | 3.42 ± 2.29 | < 0.05*,‡,§ |
| T2D (%) | 1(11.1) | 3 (23.1) | 4 (40.0) | 15 (68.2) | 0.005§ |
| Hypoglycemic agents (%) | 0 | 0 | 3 (30.0) | 10 (45.4) | 0.04§ |
Data are expressed as mean ± standard deviation or median (interquartile range). BMI: body mass index. HOMA-IR: homeostatic model assessment for insulin resistance. HDL-C: high-density lipoprotein cholesterol. AST: aspartate transaminase. ALT: alanine transaminase. GGT: gamma glutamyl transpeptidase. LAR: leptin-adiponectin ratio. HTGC: hepatic triglyceride content. T2D: type 2 diabetes. Hypoglycemic agents: metformin and glibenclamide.
Serum SFRP5 levels decreased with NAFLD progression, although the differences were not significant among groups (P > 0.05) (Figure 1). In addition, SFRP5 levels were not significantly different between individuals with stage 0 (n = 39) and stage 1 (n = 6) fibrosis (44.8 ± 2.1 vs. 40.6 ± 2.6 ng/mL, P = 0.4), but were lower in both patients with stage 2 fibrosis (35.8 ± 5.9 ng/mL).
, steatosis (n = 11), non-defining NASH (n = 10) and NASH (n = 19) subjects. Serum SFRP5 levels were measured in 47 individuals. Data are expressed as mean ± SEM.")
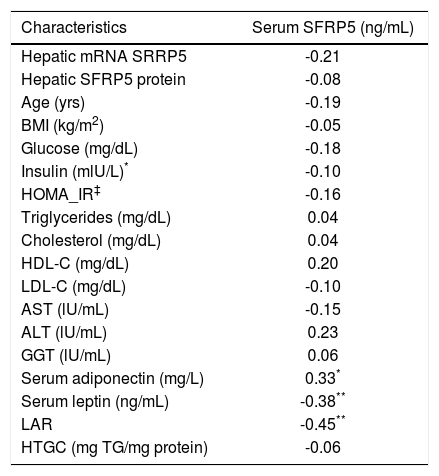
Because hypoglycemic agents may alter SFRP5 circulating levels,17 a separate analysis was performed excluding all diabetic individuals receiving pharmacological treatment (n = 13), still observing no significant differences among groups. In contrast, serum SFRP5 levels showed a significant positive correlation with serum adiponectin (r = 0.330; P = 0.02), but a negative correlation with serum leptin (r = -0.381; P = 0.01) and leptin/adiponectin ratio (LAR) (r = -0.455; P = 0.001) (Table 2), which remained significant after adjusting for T2D.
Correlation between serum SFRP5 levels with biochemical parameters.
| Characteristics | Serum SFRP5 (ng/mL) |
|---|---|
| Hepatic mRNA SRRP5 | -0.21 |
| Hepatic SFRP5 protein | -0.08 |
| Age (yrs) | -0.19 |
| BMI (kg/m2) | -0.05 |
| Glucose (mg/dL) | -0.18 |
| Insulin (mlU/L)* | -0.10 |
| HOMA_IR‡ | -0.16 |
| Triglycerides (mg/dL) | 0.04 |
| Cholesterol (mg/dL) | 0.04 |
| HDL-C (mg/dL) | 0.20 |
| LDL-C (mg/dL) | -0.10 |
| AST (lU/mL) | -0.15 |
| ALT (lU/mL) | 0.23 |
| GGT (lU/mL) | 0.06 |
| Serum adiponectin (mg/L) | 0.33* |
| Serum leptin (ng/mL) | -0.38** |
| LAR | -0.45** |
| HTGC (mg TG/mg protein) | -0.06 |
BMI: body mass index. HOMA-IR: Homeostatic model assessment for insulin resistance. HDL-C: high-density lipoprotein cholesterol. AST: aspartate transaminase. ALT: alanine transaminase. GGT: gamma glutamyl transpeptidase. LAR: leptin-adiponectin ratio. HTGC: hepatic triglyceride content.
SFRP5 mRNA was detectable in 34% of subcutaneous and in 63% of visceral adipose tissue samples.
In contrast, hepatic SFRP5 mRNA was detectable in all samples, and significantly higher than in adipose tissue samples (P < 0.01). The presence of SFRP5 in hepatocytes was confirmed by immunohistochemistry, as immunoreactivity was observed in both the cytoplasm and the nucleus of hepatocytes (Figure 2A). These results were further confirmed with SFRP5 immunodetection in nuclear and cytoplasm protein extracts (Figure 2B).
. B. SFRP5 immunoblotting in nuclear and cytoplasmic fractions from hepatic tissue (two representative examples).")
Cellular localization of SFRP5 in hepatic tissue. A. A representative example of SFRP5 immunoblotting in hepatic tissue of a non-NASH subject, immunoreactivity is present in both nuclei and cytoplasm (200x magnification). B. SFRP5 immunoblotting in nuclear and cytoplasmic fractions from hepatic tissue (two representative examples).
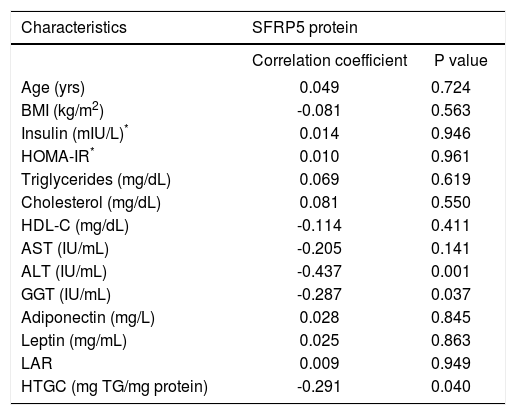
Interestingly, both SFRP5 hepatic mRNA and protein levels showed a significant negative correlation with HTGC (r = -0.349, P = 0.016 and r = -0.291, P = 0.040, respectively) (Figures 3A-3B). In addition, SFRP5 hepatic protein levels showed a significantly negative correlation with serum ALT (r = -0.437, P = 0.001) and GGT levels (r = -0.287, P = 0.037) (Table 3).
.")
Relationship between hepatic SFRP5 expression and NAFLD. A. SFRP5 mRNA levels and hepatic triglyceride content. B. Hepatic SFRP5 protein levels and hepatic triglyceride content. C. Representative examples of SFRP5 immunoblotting in hepatic tissue of control, steatosis and NASH individuals. D. Comparison of SFRP5 protein expression in control, steatosis, non-defining-NASH, and NASH subjects. Data are expressed as mean ± SEM. * Indicates statistically significant differences between groups (P < 0.001).
Correlation between hepatic SFRP5 protein levels with biochemical parameters.
| Characteristics | SFRP5 protein | |
|---|---|---|
| Correlation coefficient | P value | |
| Age (yrs) | 0.049 | 0.724 |
| BMI (kg/m2) | -0.081 | 0.563 |
| Insulin (mIU/L)* | 0.014 | 0.946 |
| HOMA-IR* | 0.010 | 0.961 |
| Triglycerides (mg/dL) | 0.069 | 0.619 |
| Cholesterol (mg/dL) | 0.081 | 0.550 |
| HDL-C (mg/dL) | -0.114 | 0.411 |
| AST (IU/mL) | -0.205 | 0.141 |
| ALT (IU/mL) | -0.437 | 0.001 |
| GGT (IU/mL) | -0.287 | 0.037 |
| Adiponectin (mg/L) | 0.028 | 0.845 |
| Leptin (mg/mL) | 0.025 | 0.863 |
| LAR | 0.009 | 0.949 |
| HTGC (mg TG/mg protein) | -0.291 | 0.040 |
BMI: body mass index. HOMA-IR: homeostatic model assessment for insulin resistance. HDL-C: high-density lipoprotein cholesterol. AST: aspartate transaminase. ALT: alanine transaminase. GGT: gamma glutamyl transpeptidase. LAR: leptin-adiponectin ratio. HTGC: hepatic triglyceride content.
In order to determine whether SFRP5 is associated with NAFLD, hepatic SFPR5 expression was compared among groups. Hepatic SFRP5 mRNA levels were 27.1 % lower in individuals with steatosis (P = 0.08, adjusted for T2D status and hypoglycemic agent) and 36.9% lower in individuals with NASH (P = 0.026, adjusted for T2D status and hypoglycemic treatment) as compared to controls. In addition, SFRP5 protein levels were 38.8 % lower in the NASH group (P = 0.006, adjusted for T2D status and hypoglycemic treatment) as compared to controls (Figures 3C and 3D). Hepatic SFRP5 protein levels were not significantly different between individuals with stage 0 (n = 45) and stage 1 (n = 7) fibrosis (0.48 ± 0.03 vs. 0.48 ± 0.04, P = 0.7), but were lower in both patients with stage 2 fibrosis (0.34 ± 0.019).
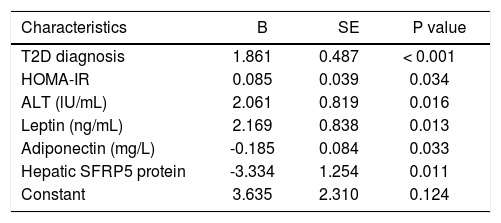
Table 4 describes a multivariate linear regression model to predict NAFLD activity score. According to this model, T2D diagnosis, HOMA-IR, serum ALT, leptin and adiponectin levels, and hepatic SFRP5 protein content were predictive factors independently associated with NAFLD activity score.
Multivariate regression model to predict NAFLD activity score.
| Characteristics | B | SE | P value |
|---|---|---|---|
| T2D diagnosis | 1.861 | 0.487 | < 0.001 |
| HOMA-IR | 0.085 | 0.039 | 0.034 |
| ALT (lU/mL) | 2.061 | 0.819 | 0.016 |
| Leptin (ng/mL) | 2.169 | 0.838 | 0.013 |
| Adiponectin (mg/L) | -0.185 | 0.084 | 0.033 |
| Hepatic SFRP5 protein | -3.334 | 1.254 | 0.011 |
| Constant | 3.635 | 2.310 | 0.124 |
NAFLD activity score is the unweighted sum of steatosis (0-3), lobular inflammation (0-3), and hepatocellular ballooning (0-2) scores; B: unstandardized coefficient. SE: standard error of unstandardized coefficient. Constant: constant of the regression model. T2D: type 2 diabetes. HOMA-IR: homeostatic model assessment for insulin resistance. ALT: alanine transaminase.
In the present study, serum SFRP5 levels decreased with NAFLD progression although differences did not reach statistical significance, in consistency with the findings of Catalán, et al.21 Interestingly, and in agreement with previous studies, SRFP5 levels showed a significantly positive correlation with adiponectin,17,18,28 and an inverse correlation with leptin and LAR,29 which has been considered a useful measure of insulin sensitivity.
In this study, we found low SFRP5 mRNA levels in visceral and subcutaneous adipose tissue from morbidly obese women. These results are in agreement with a previous study reporting extremely low levels of SFRP5 transcript in human WAT, and SFRP5 not being actively secreted from adipocytes.22 Because there is scarce information on SFRP5 expression in other metabolically relevant non-adipose tissues in humans, we quantified its mRNA and protein levels in liver biopsies from morbidly obese women, confirming the presence of SFRP5 by immunohistochemistry and immunoblot analyses. We then tested whether hepatic SFRP5 levels were associated with NAFLD. SFRP5 mRNA and protein levels correlated negatively with HTGC and also were inversely associated with non-alcoholic steatohepatitis. These results are in agreement with the report of Ouchi, et al.,15 who observed higher HTGC and liver steatosis in Sfrp5 deficient mice fed a high-fat diet. Furthermore, a recent study reported that Sfrp5 may ameliorate liver fibrosis in the mouse model.16 Unfortunately, because only 2 individuals had stage 2 fibrosis, it was not possible to assess whether SFRP5 has a role in human liver fibrosis. Finally, although circulating SFRP5 levels did not differ significantly according to NAFLD severity, SFRP5 mRNA and protein levels were decreased in hepatic tissue of NASH subjects as compared to controls. This may be consistent with an autocrine role of SFRP5 in the liver, as previously observed for SFRP5 in pancreatic beta-cell proliferation, participating in WNT signaling pathway.30 Further studies are required to understand the mechanisms by which hepatic SFRP5 is associated with NAFLD.
Hepatic SFRP5 protein levels were found to be an independent predictor of NAFLD by multivariate analysis. This analysis also confirmed other NAFLD predictors such as T2D, adiponectin and ALT serum levels.11,13,31 Although serum adiponectin levels and hepatic SFRP5 protein levels were both identified as NAFLD predictors, it is noteworthy that these parameters were not significantly correlated in the present study. These findings suggest hepatic SFRP5 may have an important role in obesity-related metabolic complications.
Because this study included only morbidly obese women, our results may not be applicable to men and/or to other classes of obesity. Moreover, because this is a cross-sectional study, it is not possible to identify causality of low SFRP5 hepatic expression in human NAFLD. One more limitation is that serum wingless-type MMTV integration site family member 5A (WNT5A) levels, previously associated with NAFLD,21 were not measured. SFRP5 binds and antagonizes WNT5A, inhibiting its downstream non-canonical signaling pathway that affects various metabolic traits.19,21,30 Additional studies are required to replicate these findings, and to further characterize the role of hepatic SFRP5 and other SFRPs (SFRP1, 2 and 4) known to have a role in adipogenesis, which could also be involved in the development of NAFLD.15,22,32
In conclusion, this is the first study reporting the association of reduced SFRP5 hepatic expression with hepatic triglyceride accumulation and with severity NAFLD in humans.
AcknowledgementsWe thank Luz E. Guillén-Pineda for his technical assistance. This study was supported by grants provided by the National Council of Science and Technology of Mexico (CONACyT SALUD-2012-01-182801), and by the Programa de Apoyo a Proyectos de Investigación e Innovación Tecnológica (PAPIITUNAM IA202413). Roxana Gutiérrez-Vidal is in the PhD program in Ciencias Bioquímicas at UNAM and was supported by a graduate scholarship from the CONACyT (no. 207486). Hugo A. Hernández Pérez was supported by postdoctoral fellowship DGAPA-UNAM.
Competing InterestsThe authors declare that they have no competing interests.
Abbreviations- •
ACTB:β-actin.
- •
ALT: alanine aminotransferase.
- •
AST: aspartate aminotransferase.
- •
BMI: body mass index.
- •
GAPDH: glyceraldehyde 3-phosphate dehydrogenase.
- •
GGT: gamma glutamyl transpeptidase.
- •
HDL-C: high-density lipoprotein cholesterol.
- •
HOMA-IR: homeostatic model assessment for insulin resistance.
- •
HTGC: hepatic triglyceride content.
- •
LAR: leptin-adiponectin ratio.
- •
NAFLD: non-alcoholic fatty liver disease.
- •
NAS: NAFLD activity score.
- •
NASH: non-alcoholic steatohepatitis.
- •
SFRP5: secreted frizzled-related protein 5.
- •
T2D: type 2 diabetes.
- •
WAT: white adipose tissue.


