


Introduction and aims. Serum electrolyte derangements are common in patients with decompensated cirrhosis hospitalized for hepatic encephalopathy. There are limited data describing the association between electrolyte levels and outcomes in hepatic encephalopathy. We assessed the association between initial serum electrolyte values and outcomes in patients with hepatic encephalopathy.
Material and methods. A total of 385 consecutive patients hospitalized with encephalopathy were included in the study. Baseline electrolyte levels (sodium, potassium, chloride, bicarbonate, calcium and phosphorus) were measured at the time of admission and assessed for association with outcomes, which included survival, admission to the intensive care unit, requirement for mechanical ventilation, and length of hospital stay. P-values ≤ 0.0083 were considered significant after adjustment for multiple testing.
Results. In unadjusted analysis, significant associations were identified regarding both bicarbonate and phosphorus (admission to intensive care unit), and calcium (mechanical ventilation); however these findings weakened and no longer approached statistical significance when adjusting for confounding variables. No other significant associations between serum electrolyte measurements and outcomes were observed.
Conclusions. Our findings suggest that in patients hospitalized with encephalopathy, serum electrolyte measurements are not strong predictors of patient outcome.
Hepatic encephalopathy (HE) is a neurometabolic syndrome characterized by impaired brain function in patients with decompensated cirrhosis.1–3 The pathogenesis of HE is not completely understood and several proposed pathways are implicated in the initiation and exacerbation of this syndrome.3,4 Ammonia plays a central role in HE as it crosses the blood brain barrier causing neurological insult mediated by a decrease in excitatory neurotransmission.3–5 Multiple precipitating factors for HE have been recognized and if controlled, may alter the disease acuity and improve mental status.6 The most common precipitating factors for HE include dehydration, acute kidney injury, non-adherence to medications (particularly non-absorbable disaccharides), constipation and infections.7–9 HE is associated with a mortality risk of up to 54% in the first 12 months of initial presentation.3,10,11 Many patients with acute HE require hospitalization and intensive care unit (ICU) admission, which may be associated with worse outcomes. Fichet and colleagues studied the prognosis and one-year mortality in patients with HE and found that arterial hypotension, mechanical ventilation, vasopressor use, acute renal failure, and sepsis were among the most common factors associated with mortality in the ICU.10 Another study found that diabetes mellitus, hypertension, prior transjugular intrahepatic portosystemic shunt (TIPS) placement, prior HE, and prior use of lactulose were associated with increased 90-day readmission rates.12
Electrolyte derangements, mainly hyponatremia and hypokalemia, represent major precipitating factors for HE.7,8,13,14 Guevara, et al. reported an association between the occurrence of HE and hyponatremia in 70 patients.15,16 However, no studies have examined the relationship between serum electrolyte levels and outcomes in patients hospitalized with HE. In this study we evaluated the associations of serum electrolyte levels obtained at the time of hospital admission for HE with separate outcomes in a cohort of patients admitted with HE.
Material and MethodsStudy design and participantsA total of 385 consecutive patients hospitalized with HE at the Mayo Clinic in Jacksonville, Florida between April 2010 and January 2016 were included in this retrospective study. Information was collected regarding baseline patient characteristics, baseline laboratory measurements, hospitalization, and outcomes. The primary serum electrolyte measurements were sodium, potassium, chloride, bicarbonate, calcium, and phosphorus. Ionized calcium and ionized magnesium were also examined but were considered as secondary serum electrolyte parameters due to the presence of a relatively large amount of missing data for these two variables (N = 183 and N = 207 missing, respectively). All serum electrolyte parameters were measured at baseline at the time of hospital admission. HE was defined as altered mental status from the patient’s baseline and was graded according to the New-Haven classification (grades I-IV) using clinical assessment at the time of hospital admission. As an overall measure of patient comorbidities, the Charlson comorbidity index was recorded for each patient. The Model for End-Stage Liver Disease (MELD) score was calculated using the formula in figure 1, with and without adjustment for serum sodium level. Precipitating factors for HE were recorded based on clinical documentation at the time of hospital admission.
Outcome measures score, with and without adjustment for serum sodium level.")
A total of four outcomes (survival, admission to the ICU, mechanical ventilation, and length of hospital stay) were assessed. For survival, the baseline time point was considered to be the date of hospital admission, and deaths that occurred both during hospitalization and after discharge were considered. Of note, calculation of length of hospital stay included the 39 patients who died during hospitalization; median length of stay in these 39 patients was 9 days (Range: 1-48 days).
Statistical analysisContinuous variables were summarized with the sample median and range. Categorical variables were summarized with number and percentage of patients. A number of variables (phosphorus, white blood count [WBC], platelets, INR, total bilirubin, creatinine, BUN, and ammonia) were examined on the logarithm scale for use in association analysis due to their skewed distributions. Associations of serum electrolyte parameters with the separate outcomes of survival, admission to the ICU, mechanical ventilation, and length of hospital stay were evaluated using single-variable (i.e. unadjusted) and multivariable regression models appropriate for the nature of the given outcome measure. More specifically, associations of serum electrolyte parameters with survival after hospital admission were evaluated using Cox proportional hazards regression models; hazard ratios (HRs) and 95% confidence intervals (CIs) were estimated. For the binary outcomes of admission to the ICU and mechanical ventilation, logistic regression models were used, and odds ratios (ORs) and 95% confidence intervals (CI) were estimated. For length of hospital stay, associations with serum electrolyte parameters were assessed using negative binomial regression models;17 multiplicative increases and 95% CI were estimated and were interpreted as the effect on mean length of hospital stay corresponding to a specified increase in the given serum electrolyte parameters. Associations of other baseline variables with the aforementioned four outcomes were assessed using the previously described Cox, logistic, and negative binomial regression models.
In evaluation of associations involving primary serum electrolyte parameters only, multivariable analysis was performed and models were adjusted for the pre-specified potential confounding baseline variables (in order of importance) of INR, creatinine, total bilirubin, albumin, TIPS, age, Charlson comorbidity index, hepatocellular carcinoma (HCC) at admission, platelet and WBC counts, hemoglobin level, and grade of HE. In accordance with recommended guidelines, multivariable adjustment for all of these pre-specified variables was only possible for survival after admission, length of stay, and for the most common dichotomous outcome of admission to ICU. For the less common dichotomous outcome of mechanical ventilation, multivariable models were adjusted for as many of the pre-specified confounding variables as possible while including no more than one variable in given model for every 10 patients who experienced the outcome.18 Multivariable analysis was not performed for secondary serum electrolyte parameters due to the extent of missing data for these parameters (and resulting exploratory nature of the analysis), and was also not performed when evaluating associations of other baseline variables with outcomes and these analyses were not the focus of the study.
Separately for each outcome measure, we adjusted for the six statistical tests of association that were performed for the primary serum electrolyte parameters using a Bonferroni correction, after which p-values of 0.0083 or lower are considered statistically significant. All other analyses were considered to be secondary and therefore of a more exploratory nature, with p-values of 0.05 or lower considered statistically significant. All statistical tests were twosided. All statistical analysis was performed using SAS (version 9.4; SAS Institute, Inc., Cary, North Carolina) and R Statistical Software (version 3.2.3; R Foundation for Statistical Computing, Vienna, Austria).
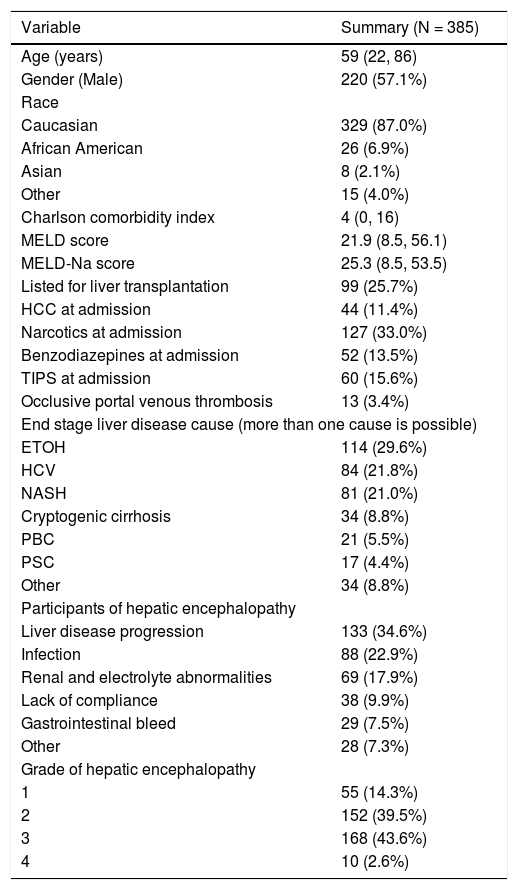
ResultsA summary of patient baseline characteristics is provided in table 1. Median age was 59 years (Range: 22-86 years) and 220 patients (57%) were male. The majority of patients (87%) were Caucasian. Median Charlson comorbidity score was 4 (Range: 0-16) while median MELD-sodium score was 25.3 (Range: 8.5-53.5). A total of 99 patients (26%) were listed for liver transplantation (LT) and 44 patients (11%) had HCC at admission. The most common causes of end-stage liver disease (ESLD) were alcohol use (30%), hepatitis C infection (HCV) (22%), and non-alcoholic steatohepatitis (NASH) (21%), while the most common diagnoses were liver disease progression (35%), infection (23%), and renal and electrolyte abnormalities (18)%.
Baseline characteristics of the study population.
| Variable | Summary (N = 385) |
|---|---|
| Age (years) | 59 (22, 86) |
| Gender (Male) | 220 (57.1%) |
| Race | |
| Caucasian | 329 (87.0%) |
| African American | 26 (6.9%) |
| Asian | 8 (2.1%) |
| Other | 15 (4.0%) |
| Charlson comorbidity index | 4 (0, 16) |
| MELD score | 21.9 (8.5, 56.1) |
| MELD-Na score | 25.3 (8.5, 53.5) |
| Listed for liver transplantation | 99 (25.7%) |
| HCC at admission | 44 (11.4%) |
| Narcotics at admission | 127 (33.0%) |
| Benzodiazepines at admission | 52 (13.5%) |
| TIPS at admission | 60 (15.6%) |
| Occlusive portal venous thrombosis | 13 (3.4%) |
| End stage liver disease cause (more than one cause is possible) | |
| ETOH | 114 (29.6%) |
| HCV | 84 (21.8%) |
| NASH | 81 (21.0%) |
| Cryptogenic cirrhosis | 34 (8.8%) |
| PBC | 21 (5.5%) |
| PSC | 17 (4.4%) |
| Other | 34 (8.8%) |
| Participants of hepatic encephalopathy | |
| Liver disease progression | 133 (34.6%) |
| Infection | 88 (22.9%) |
| Renal and electrolyte abnormalities | 69 (17.9%) |
| Lack of compliance | 38 (9.9%) |
| Gastrointestinal bleed | 29 (7.5%) |
| Other | 28 (7.3%) |
| Grade of hepatic encephalopathy | |
| 1 | 55 (14.3%) |
| 2 | 152 (39.5%) |
| 3 | 168 (43.6%) |
| 4 | 10 (2.6%) |
The sample median (minimum, maximum) is given for continuous variables. Information was unavailable regarding race (N = 7), Charlson comorbidity index (N = 1), initial MELD (N = 35), and MELD sodium (N = 35). MELD: model for end-stage liver disease. Na: sodium. HCC: hepatocellular carcinoma. TIPS: transjugular intrahepatic portosystemic shunt ETOH: ethanol (alcohol) use. HCV: hepatitis-C virus. NASH: nonalcoholic steatohepatitis. PBC: primary biliary cholangitis. PSC: primary sclerosing cholangitis.
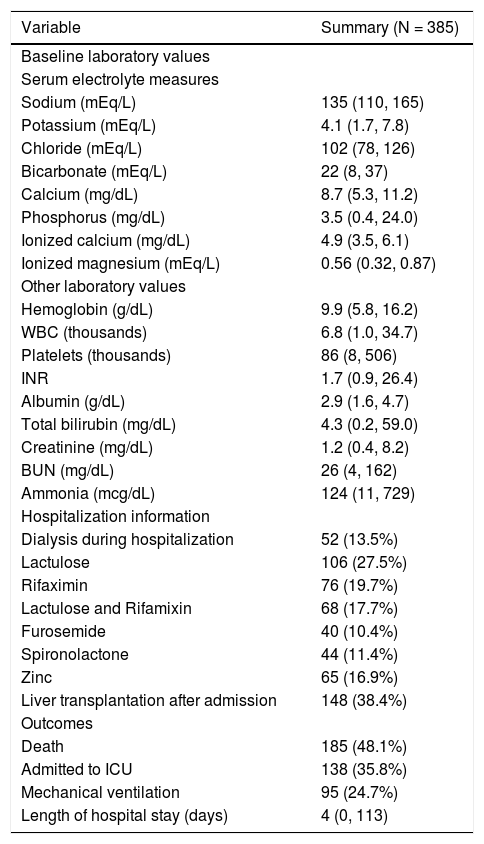
Table 2 displays baseline laboratory values, hospitalization information, and outcomes. Median follow-up length after admission was 6.5 months (Range: 1 day-86.4 months) and 185 patients (48.1%) died. Slightly more than one-third of patients (36%) were admitted to the ICU and one-quarter (25%) required mechanical ventilation. The median length of hospital stay after admission was 4 days (Range: 0-113 days).
Baseline laboratory values, hospitalization information, and outcomes.
| Variable | Summary (N = 385) |
|---|---|
| Baseline laboratory values | |
| Serum electrolyte measures | |
| Sodium (mEq/L) | 135 (110, 165) |
| Potassium (mEq/L) | 4.1 (1.7, 7.8) |
| Chloride (mEq/L) | 102 (78, 126) |
| Bicarbonate (mEq/L) | 22 (8, 37) |
| Calcium (mg/dL) | 8.7 (5.3, 11.2) |
| Phosphorus (mg/dL) | 3.5 (0.4, 24.0) |
| Ionized calcium (mg/dL) | 4.9 (3.5, 6.1) |
| Ionized magnesium (mEq/L) | 0.56 (0.32, 0.87) |
| Other laboratory values | |
| Hemoglobin (g/dL) | 9.9 (5.8, 16.2) |
| WBC (thousands) | 6.8 (1.0, 34.7) |
| Platelets (thousands) | 86 (8, 506) |
| INR | 1.7 (0.9, 26.4) |
| Albumin (g/dL) | 2.9 (1.6, 4.7) |
| Total bilirubin (mg/dL) | 4.3 (0.2, 59.0) |
| Creatinine (mg/dL) | 1.2 (0.4, 8.2) |
| BUN (mg/dL) | 26 (4, 162) |
| Ammonia (mcg/dL) | 124 (11, 729) |
| Hospitalization information | |
| Dialysis during hospitalization | 52 (13.5%) |
| Lactulose | 106 (27.5%) |
| Rifaximin | 76 (19.7%) |
| Lactulose and Rifamixin | 68 (17.7%) |
| Furosemide | 40 (10.4%) |
| Spironolactone | 44 (11.4%) |
| Zinc | 65 (16.9%) |
| Liver transplantation after admission | 148 (38.4%) |
| Outcomes | |
| Death | 185 (48.1%) |
| Admitted to ICU | 138 (35.8%) |
| Mechanical ventilation | 95 (24.7%) |
| Length of hospital stay (days) | 4 (0, 113) |
The sample median (minimum, maximum) is given for continuous variables. Information was unavailable regarding INR (N = 23), albumin (N = 3), total bilirubin (N = 18), creatinine (N = 4), BUN (N = 5), ammonia (N = 123), calcium (N = 25), phosphorus (N = 24), ionized calcium (N = 183), ionized magnesium (N = 207), 30-day mortality (N = 18), and 30-day readmission (N = 55). WBC: white blood cells. INR: international normalized ration. BUN: blood urea nitrogen. ICU: Intensive Care Unit.
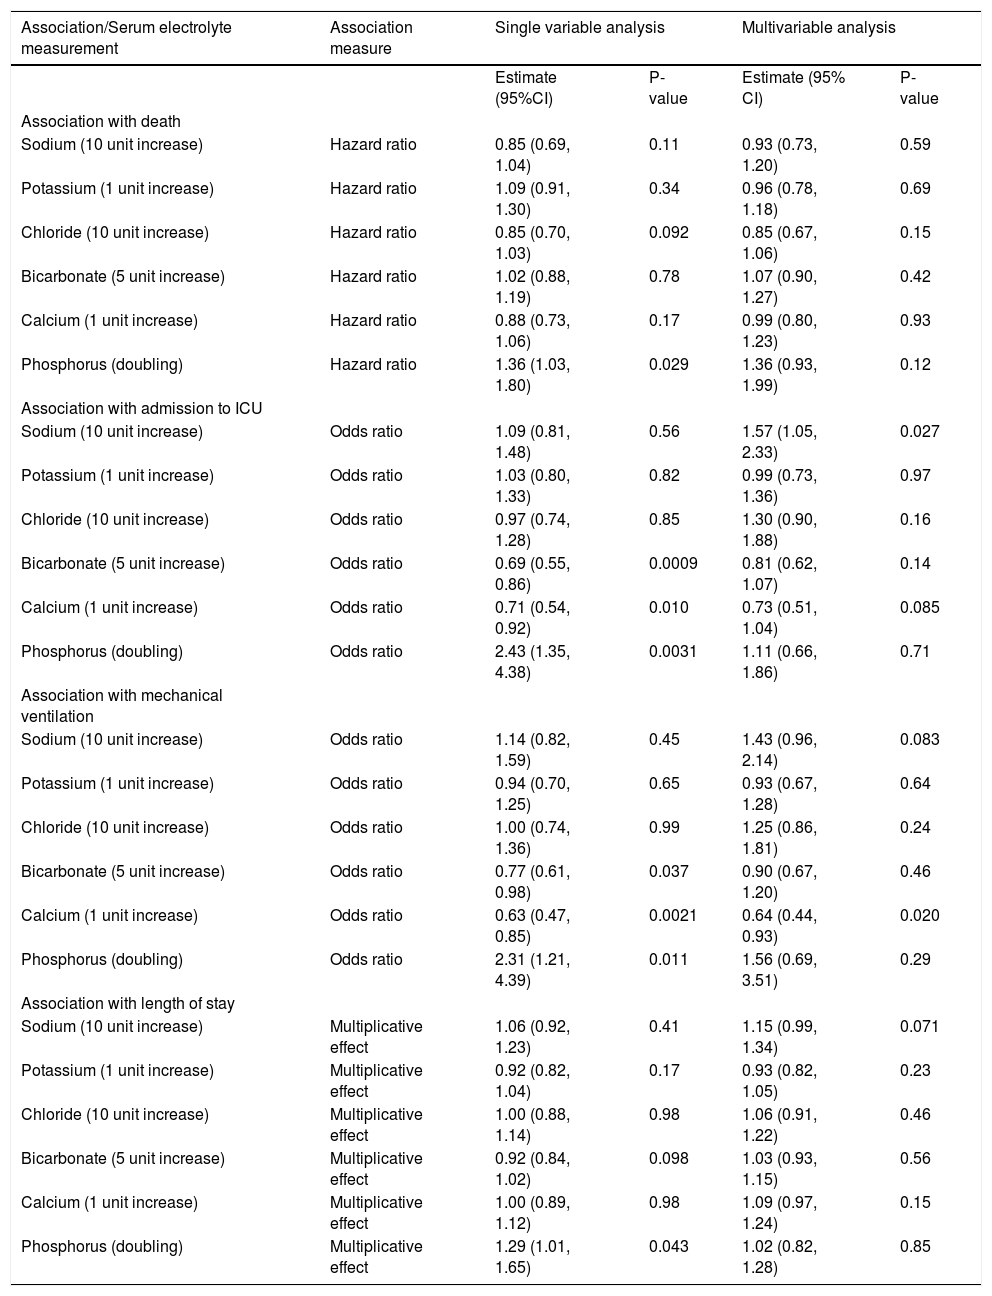
An evaluation of the association between the six primary serum electrolyte measured (sodium, potassium, chloride, bicarbonate, calcium, and phosphorus) and outcomes is shown in table 3. In single-variable (i.e. unadjusted) analysis, there were significant (P ≤ 0.0083 after multiple testing adjustment) associations between a higher phosphorus level and an increased risk of ICU admission (OR: 2.43, P = 0.0031), between a higher bicarbonate level and a lower risk of ICU admission (OR: 0.69, P = 0.0009), and between a higher calcium level and lower risk of mechanical ventilation (OR: 0.63, P = 0.0021). However, in multivariable analysis adjusting for potential confounding variables, none of the aforementioned remained statistically significant. Of note, the magnitude of association between a higher calcium level and decreased risk of mechanical ventilation stayed relatively consistent in multivariable analysis (OR: 0.64, P = 0.020); the increase in p-value is likely attributable to the adjustment for several variables with missing values (INR, creatinine, total bilirubin, albumin, Charlson comorbidity index) and the subsequent reduction in sample size that this caused.
Association between primary serum electrolyte measurements and outcomes.
| Association/Serum electrolyte measurement | Association measure | Single variable analysis | Multivariable analysis | ||
|---|---|---|---|---|---|
| Estimate (95%CI) | P-value | Estimate (95% CI) | P-value | ||
| Association with death | |||||
| Sodium (10 unit increase) | Hazard ratio | 0.85 (0.69, 1.04) | 0.11 | 0.93 (0.73, 1.20) | 0.59 |
| Potassium (1 unit increase) | Hazard ratio | 1.09 (0.91, 1.30) | 0.34 | 0.96 (0.78, 1.18) | 0.69 |
| Chloride (10 unit increase) | Hazard ratio | 0.85 (0.70, 1.03) | 0.092 | 0.85 (0.67, 1.06) | 0.15 |
| Bicarbonate (5 unit increase) | Hazard ratio | 1.02 (0.88, 1.19) | 0.78 | 1.07 (0.90, 1.27) | 0.42 |
| Calcium (1 unit increase) | Hazard ratio | 0.88 (0.73, 1.06) | 0.17 | 0.99 (0.80, 1.23) | 0.93 |
| Phosphorus (doubling) | Hazard ratio | 1.36 (1.03, 1.80) | 0.029 | 1.36 (0.93, 1.99) | 0.12 |
| Association with admission to ICU | |||||
| Sodium (10 unit increase) | Odds ratio | 1.09 (0.81, 1.48) | 0.56 | 1.57 (1.05, 2.33) | 0.027 |
| Potassium (1 unit increase) | Odds ratio | 1.03 (0.80, 1.33) | 0.82 | 0.99 (0.73, 1.36) | 0.97 |
| Chloride (10 unit increase) | Odds ratio | 0.97 (0.74, 1.28) | 0.85 | 1.30 (0.90, 1.88) | 0.16 |
| Bicarbonate (5 unit increase) | Odds ratio | 0.69 (0.55, 0.86) | 0.0009 | 0.81 (0.62, 1.07) | 0.14 |
| Calcium (1 unit increase) | Odds ratio | 0.71 (0.54, 0.92) | 0.010 | 0.73 (0.51, 1.04) | 0.085 |
| Phosphorus (doubling) | Odds ratio | 2.43 (1.35, 4.38) | 0.0031 | 1.11 (0.66, 1.86) | 0.71 |
| Association with mechanical ventilation | |||||
| Sodium (10 unit increase) | Odds ratio | 1.14 (0.82, 1.59) | 0.45 | 1.43 (0.96, 2.14) | 0.083 |
| Potassium (1 unit increase) | Odds ratio | 0.94 (0.70, 1.25) | 0.65 | 0.93 (0.67, 1.28) | 0.64 |
| Chloride (10 unit increase) | Odds ratio | 1.00 (0.74, 1.36) | 0.99 | 1.25 (0.86, 1.81) | 0.24 |
| Bicarbonate (5 unit increase) | Odds ratio | 0.77 (0.61, 0.98) | 0.037 | 0.90 (0.67, 1.20) | 0.46 |
| Calcium (1 unit increase) | Odds ratio | 0.63 (0.47, 0.85) | 0.0021 | 0.64 (0.44, 0.93) | 0.020 |
| Phosphorus (doubling) | Odds ratio | 2.31 (1.21, 4.39) | 0.011 | 1.56 (0.69, 3.51) | 0.29 |
| Association with length of stay | |||||
| Sodium (10 unit increase) | Multiplicative effect | 1.06 (0.92, 1.23) | 0.41 | 1.15 (0.99, 1.34) | 0.071 |
| Potassium (1 unit increase) | Multiplicative effect | 0.92 (0.82, 1.04) | 0.17 | 0.93 (0.82, 1.05) | 0.23 |
| Chloride (10 unit increase) | Multiplicative effect | 1.00 (0.88, 1.14) | 0.98 | 1.06 (0.91, 1.22) | 0.46 |
| Bicarbonate (5 unit increase) | Multiplicative effect | 0.92 (0.84, 1.02) | 0.098 | 1.03 (0.93, 1.15) | 0.56 |
| Calcium (1 unit increase) | Multiplicative effect | 1.00 (0.89, 1.12) | 0.98 | 1.09 (0.97, 1.24) | 0.15 |
| Phosphorus (doubling) | Multiplicative effect | 1.29 (1.01, 1.65) | 0.043 | 1.02 (0.82, 1.28) | 0.85 |
CI: confidence interval. Hazard ratios, 95% CIs, and p-values result from Cox proportional hazards regression models. Odds ratios, 95% CIs, and p-values result from logistic regression models. Multiplicative effects, 95% CIs, and p-values result from negative binomial regression models; multiplicative effects are interpreted as the multiplicative increase on mean length of stay corresponding to the increase shown in parenthesis for the given serum electrolyte measure. Multivariable models were adjusted for the following variables: death, admission to ICU, and length of stay (INR, creatinine, total bilirubin, albumin, TIPS, age, Charlson comorbidity index, HCC at admission, platelets, WBC, hemoglobin, grade of HE), and mechanical ventilation (INR, creatinine, total bilirubin, albumin, TIPS, age, Charlson comorbidity index, HCC at admission). P-values ≤ 0.0083 are considered as statistically significant after applying a Bonferroni correction separately for each outcome measure.
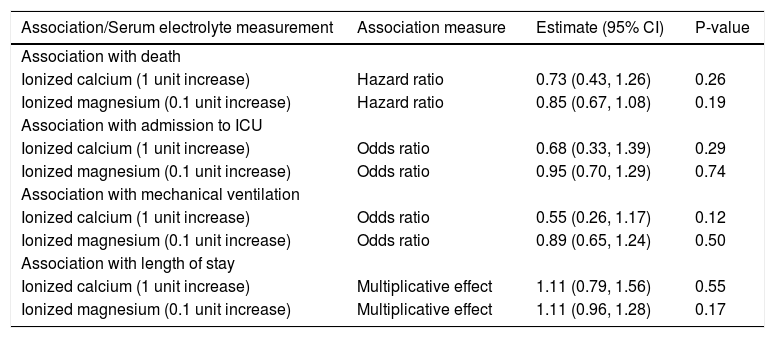
There were no statistically significant associations between either ionized calcium or ionized magnesium and any of the five outcome measures that were assessed (all P ≥ 0.12, Table 4). Although not of primary interest for the evaluation of the aims of this study, associations between other baseline variables and outcomes are shown in Supplemental Tables 1-4.
Association between secondary serum electrolyte measurements and outcomes.
| Association/Serum electrolyte measurement | Association measure | Estimate (95% CI) | P-value |
|---|---|---|---|
| Association with death | |||
| Ionized calcium (1 unit increase) | Hazard ratio | 0.73 (0.43, 1.26) | 0.26 |
| Ionized magnesium (0.1 unit increase) | Hazard ratio | 0.85 (0.67, 1.08) | 0.19 |
| Association with admission to ICU | |||
| Ionized calcium (1 unit increase) | Odds ratio | 0.68 (0.33, 1.39) | 0.29 |
| Ionized magnesium (0.1 unit increase) | Odds ratio | 0.95 (0.70, 1.29) | 0.74 |
| Association with mechanical ventilation | |||
| Ionized calcium (1 unit increase) | Odds ratio | 0.55 (0.26, 1.17) | 0.12 |
| Ionized magnesium (0.1 unit increase) | Odds ratio | 0.89 (0.65, 1.24) | 0.50 |
| Association with length of stay | |||
| Ionized calcium (1 unit increase) | Multiplicative effect | 1.11 (0.79, 1.56) | 0.55 |
| Ionized magnesium (0.1 unit increase) | Multiplicative effect | 1.11 (0.96, 1.28) | 0.17 |
CI: confidence interval. Hazard ratios, 95% CIs, and p-values result from single-variable (i.e. unadjusted) Cox proportional hazards regression models. Odds ratios, 95% CIs, and p-values result from single-variable (i.e. unadjusted) logistic regression models. Multiplicative effects, 95% CIs, and p-values result from single-variable (i.e. unadjusted) negative binomial regression models and are interpreted as the multiplicative increase on mean length of stay corresponding to the increase shown in parenthesis for the given serum electrolyte measure. ICU: Intensive Care Unit.
Our study found that in a large cohort of patients hospitalized with HE, there was no association between initial electrolyte levels and outcomes after adjustment for key factors including patients’ age, underlying kidney function, and progression of liver disease (as measured by the MELD-sodium score). Associations between electrolyte levels and outcomes in unadjusted analysis included bicarbonate and admission to ICU, phosphorus and admission to ICU, phosphorus and 30-day mortality, and calcium and mechanical ventilation. However, these findings weakened notably when adjusting for confounding variables in multivariable analysis. No other notable associations between serum electrolyte measurements and outcomes were observed.
To our knowledge, this is the first study to evaluate associations between initial serum electrolyte levels and outcomes in patients hospitalized with HE. Several studies have described an association between hyponatremia and HE. Guevara et al found in a study population of 61 patients with cirrhosis that serum sodium of < 130 mmol/L was predictive of developing overt HE due to low brain concentration of organic osmolytes.19 Subsequently, the same investigators reported that in 70 patients with refractory ascites, the occurrence of HE was independently associated with serum sodium, bilirubin and creatinine levels in a time dependent analysis that accounted for variables that could change over time.16 Qureshi, et al. found that a serum sodium concentration of < 135 mmol/L was associated with a greater frequency of HE compared to patients whose serum sodium was > 135 mmol/L.20 In our study, we analyzed data in patients hospitalized with HE at a single time point. There were only 62 patients (16.1%) who were on diuretics on admission, while 87 patients (22.6%) had a sodium level < 130 mmol/L. We did not account for changes in sodium level prior to admission, which may be more significant than the actual level on admission.
Our study is not free of limitations. First, its retrospective design may have introduced a data collection bias. Second, although the sample size was not small, the possibility of type II error (i.e. a false-negative finding) is still important to consider, particularly after adjustment for multiple testing. Finally, the outcome of length of hospital stay is inherently biased to some degree due to the patient population being studied in which death during or shortly after hospitalization is common. For example, a patient who was discharged one day after admission (a positive outcome) was treated exactly the same as a patient who died one day after admission. However, the bias is lessened to a degree for length of stay since this was generally long (median=9 days) in patients who died during hospitalization compared to the remaining group who survived until discharge (median = 4 days). Although an alternative analysis could be considered, our approach to the length of stay offers a measure of burden to the hospital in addition to the patient, which seems reasonable given that we assessed three other meaningful outcomes (survival, ICU admission, mechanical ventilation).
The role of electrolytes in HE and patients with decompensated cirrhosis remains understudied and underrepresented in the medical literature. Studying one time point as compared to serial measurements may underestimate the importance of changes in values that could impact clinical events such as the development of HE, and the lack of serial electrolyte measurements is an additional limitation of our study.
In conclusion, our findings suggest that in patients hospitalized with HE, initial serum electrolyte measurements are not strong predictors of patient outcomes. Further studies are needed to define the association between serial electrolyte measurements during hospitalization and outcomes in patients with HE.
Abbreviations- •
BUN: blood urea nitrogen.
- •
CI: confidence intervals.
- •
ESLD: end stage liver disease.
- •
HCC: hepatocellular carcinoma.
- •
HCV: hepatitis-C virus.
- •
HE: hepatic encephalopathy.
- •
ICU: Intensive Care Unit.
- •
INR: International Normalized Ratio.
- •
LT: liver transplantation.
- •
MELD: model for end-stage liver disease.
- •
NASH: nonalcoholic steatohepatitis.
- •
OR: odds ratios.
- •
TIPS: transjugular intrahepatic portosystemic shunt.
- •
WBC: white blood cells.
None of the authors have a conflict of interest to disclose.
Author ContributionAli Alsaad, Fernando Stancampiano, William Palmer and Andrew Keaveny authored the manuscript. Ali Alsaad, Fernando Stancampiano, April Henry, Jillian Jackson contributed to data acquisition. Michael Heckman and Nancy Diehl conducted the statistical analysis. All authors reviewed and approved the manuscript prior to submission.
Source of SupportMayo Clinic Departmental Resources and approved by the Mayo Clinic Institutional Review Board.


