


It is indicated that high levels of serum alanine aminotransferase (ALT) and aspartate aminotransferase (AST) are associated with increased incident type 2 diabetes risk. However, whether serum ALT levels could improve the discrimination of type 2 diabetes remains unclear.
MethodsThe data was derived from the Dongfeng-Tongji cohort study, which was established in 2008 and followed until October 2013. A total of 17,173 participants free of type 2 diabetes at baseline were included and 1159 participants developed diabetes after 4.51 (0.61) years of follow-up. Cox proportional hazard regression model was used to calculate the hazard ratios (HRs) for the association between ALT and AST levels with incident diabetes risk. Receiver-operating characteristic (ROC) curves analysis was used to evaluate the predictive accuracy of models incorporating traditional risk factors with and without ALT.
ResultsCompared with the lowest quartile of ALT and AST levels, the highest quartile had a significantly higher risk of developing type 2 diabetes (HR: 2.17 [95% CI: 1.78–2.65] and 1.29 [1.08–1.54], respectively) after adjustment for potential confounders. The addition of ALT levels into the traditional risk factors did not improve the predictive ability of type 2 diabetes, with AUC increase from 0.772 to 0.774; P=0.86.
ConclusionsAlthough elevated ALT or AST levels increased incident type 2diabetes risk, addition of ALT levels into the prediction model did not improve the discrimination of type 2 diabetes.
The prevalence of type 2 diabetes mellitus increases dramatically worldwide. In China, the prevalence of diabetes and prediabetes was 11.6% and 50.1%, respectively [1]. Several clinical trials demonstrated that lifestyle interventions can effectively prevent or delay the development of diabetes among high risk populations [2]. Identification of the populations at high risk of developing type 2 diabetes and adoption of preventive interventions was important strategy to reduce incident type 2 diabetes risk. Numerous predictive models for the risk of incident diabetes were established to predict diabetes occurrence, such as Framingham risk score [3], the Finnish diabetes risk score (FINDRISC) [4], the Indian diabetes risk score (IDRS) [5], the German diabetes risk score [6], Danish diabetes risk score [7], and Chinese diabetes risk score [8,9]. However, addition of more effective risk factors into the models and improving the predictive ability of the models remained to be further investigated, especially among a middle-aged and elderly Chinese population.
The effects of liver enzymes on incident type 2 diabetes risk have attracted much interest. Several epidemiological studies examined the associations between ALT levels with risk of incident type 2 diabetes [10,11]. A systematic review and meta-analysis of prospective studies indicated moderate associations between ALT levels with risk of developing diabetes [12]. However, studies on the associations between AST levels and incident type 2 diabetes risk were limited and inconsistent [13,14]. A systematic review and meta-analysis of prospective studies did not find significant association between AST levels with incident diabetes risk [12].
In the present study, we aimed to investigate whether serum ALT or AST levels could improve the discrimination of type 2 diabetes.
2Methods2.1Study populationData was derived from the Dongfeng-Tongji cohort (DFTJ cohort) study, detailed description of this study has been published elsewhere [15]. Briefly, the DFTJ cohort study is a prospective cohort study conducted by Tongji Medical College, Huazhong University of Science and Technology and Dongfeng Motor Corporation (DMC). We recruited 27,009 (out of 31,000) retired employees (average aged 63.6 years) who underwent the questionnaire interviews and provided baseline blood samples between September 2008 and June 2010. The participants will be followed up every five years. Of the 27,009 subjects, 25,978 participates (96.2%) finished the first follow-up examinations conducted from April to October in 2013. Participants with diabetes (n=4974) and consumption of excessive alcohol (n=809) at baseline were excluded. Participants with missing data on plasma fasting glucose (n=142), ALT or AST (n=2067) were further excluded. Lastly, subjects with HBsAg positive (n=813) were further excluded. After these exclusion, we included 17,173 participants in the final analysis.
The present study was approved by the Medical Ethics Committee of the School of Public Health, Tongji Medical College, and Dongfeng General Hospital. All participants provided written informed consent for participation in the study.
2.2Data collectionThrough face-to-face interviews, trained interviewers collected information including demographic information, family and personal disease history, drug use, and lifestyle factors including exercise, smoking status, and drinking status. According to smoking status participants were classified as never smokers, ever smokers, or current smokers. Regarding drinking status, participants were characterized as never drinkers, ever drinkers, or current drinkers. The general health examination was performed at the same time. Height, weight and waist circumference were measured with participants wearing light indoor clothing and no shoes. Body mass index (BMI), calculated as weight in kilograms divided by the square of the height in meters. Overweight and obesity were defined according to the classifications for Asian populations as a BMI of 24.0–27.9kg/m2 and a BMI of ≥28.0kg/m2, respectively [16]. Abdominal obesity was defined according to guidelines for Chinese populations as a waist circumference ≥85cm for men and ≥80cm for women [17]. Serum ALT, AST, total cholesterol (TC), triglycerides (TG), high-density lipoprotein cholesterol (HDL-C) and low-density lipoprotein cholesterol (LDL-C) levels were measured by ARCHITECTCi8200 automatic analyzer (ABBOTT Laboratories. Abbott Park, Illinois, USA) using the Abbott Diagnostic reagents according to the instructions of the manufacturer. Fasting plasma glucose was measured with Aeroset automatic analyzer (Abbott, USA).
2.3Assessment of type 2 diabetesDiabetes was diagnosed according to the American Diabetes Association criteria [18] as meeting any of the following criteria: (1) fasting blood glucose level ≥7.0mmol/L, (2) HbA1c level ≥6.5%, (3) 2-h 75-g oral glucose tolerance test (OGTT) value ≥11.1mmol/L, (4) usage of oral hypoglycemic medication and/or insulin, or both, (5) self-reported physician diagnosed diabetes. Because we did not perform OGTT test and HbA1c levels were only measured during the follow-up, we used fasting plasma glucose, self-reported physician diagnosed diabetes, and usage of diabetes medication and/or insulin to identify baseline and incident diabetic case.
2.4Statistical analysisThe continuous variables assumed to be normally distributed were presented as means±standard deviation (SD) and compared between groups using one-way ANOVA. The skewed distribution variables were presented as median (quartile) and compared between groups using non-parametric statistical hypothesis test including Wilcoxon rank test and Kruskal–Wallis test. The categorical variables were expressed as percentages and compared by the chi-square test. Baseline clinical and biochemical characteristics were compared between individuals according to diabetes status at follow-up and baseline ALT and AST levels. The levels of liver enzymes were defined by the following quartiles: for ALT, < 15, 15–20, 20–27, and ≥27IU/L; for AST, < 19, 19–23, 23–28, and ≥28IU/L.
Cox proportional hazards regression was used to calculate the hazard ratios (HRs) and 95% confidence intervals (CIs) for developing type 2 diabetes according to the quartiles of serum ALT and AST levels. Four models were constructed to investigate the associations of ALT and AST levels with incident diabetes risk: model 1 included age and sex; model 2 included the terms in model 1 plus lifestyle factors including drinking status (never, ever, or current), smoking status (never, ever, or current), exercise (yes or no), and family history of diabetes (yes or no); model 3a included the terms in model 2 and baseline BMI (continuous); model 3b included the terms in model 2 and baseline waist circumference (continuous); model 4 included the terms in model 3a and the liver enzymes (AST or ALT). HRs for incident diabetes risks were calculated for a 1–SD increment in the natural log of ALT levels by subgroups of sex, family history of diabetes (yes or no), current drinking status (yes or no), BMI (normal or overweight/obesity) and waist circumference (normal or abdominal obesity).
Receiver-operating characteristic (ROC) curves analysis were used to calculate the corresponding area under the ROC curve to evaluate discrimination ability incorporating traditional risk factors (age, sex, fasting blood glucose, BMI, waist circumference, TC and TG levels, hypertension, and family history of diabetes) with and without ALT levels. We also examined the discrimination ability of the ALT levels to identify undiagnosed diabetes in other diabetes risk scores including Framingham risk score, Indian risk score, Thai risk score, and New Chinese diabetes risk score. A 2-sided P value <0.05 was used to determine statistical significance. Statistical analyses were performed using SPSS (version 13.0; SPSS, Chicago, IL, USA).
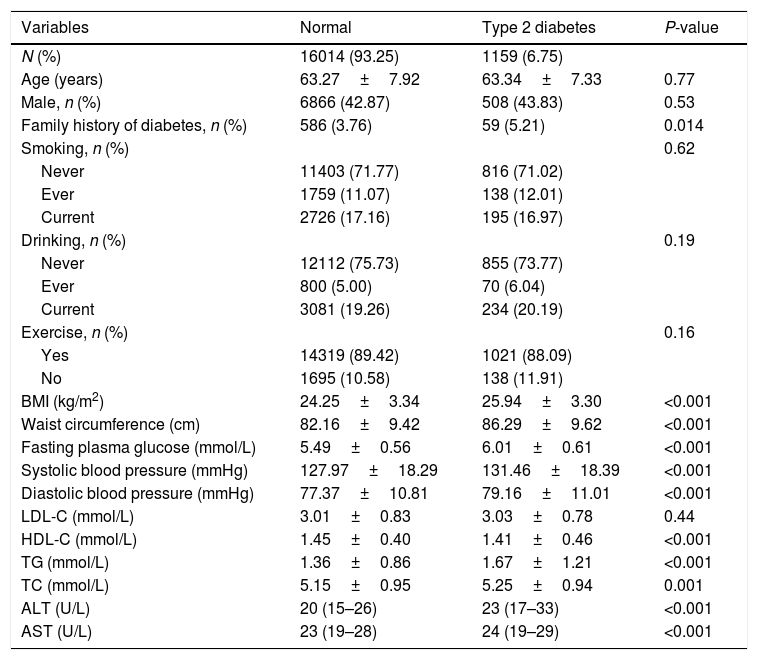
3ResultsOf the 17,173 non-diabetic participants at baseline, 1159 (6.48%) developed type 2 diabetes during the follow-up of 4.51 (0.61) years. The baseline characteristics of the study subjects according to the diabetes status are shown in Table 1. In the diabetes group, subjects were more likely with higher levels of AST, ALT, BMI, waist circumference, fasting plasma glucose, systolic blood pressure, diastolic blood pressure, triglycerides, total cholesterol, LDL-C, in contrast, with lower levels of HDL-C.
Baseline characteristics of the subjects according to the diabetes status.
| Variables | Normal | Type 2 diabetes | P-value |
|---|---|---|---|
| N (%) | 16014 (93.25) | 1159 (6.75) | |
| Age (years) | 63.27±7.92 | 63.34±7.33 | 0.77 |
| Male, n (%) | 6866 (42.87) | 508 (43.83) | 0.53 |
| Family history of diabetes, n (%) | 586 (3.76) | 59 (5.21) | 0.014 |
| Smoking, n (%) | 0.62 | ||
| Never | 11403 (71.77) | 816 (71.02) | |
| Ever | 1759 (11.07) | 138 (12.01) | |
| Current | 2726 (17.16) | 195 (16.97) | |
| Drinking, n (%) | 0.19 | ||
| Never | 12112 (75.73) | 855 (73.77) | |
| Ever | 800 (5.00) | 70 (6.04) | |
| Current | 3081 (19.26) | 234 (20.19) | |
| Exercise, n (%) | 0.16 | ||
| Yes | 14319 (89.42) | 1021 (88.09) | |
| No | 1695 (10.58) | 138 (11.91) | |
| BMI (kg/m2) | 24.25±3.34 | 25.94±3.30 | <0.001 |
| Waist circumference (cm) | 82.16±9.42 | 86.29±9.62 | <0.001 |
| Fasting plasma glucose (mmol/L) | 5.49±0.56 | 6.01±0.61 | <0.001 |
| Systolic blood pressure (mmHg) | 127.97±18.29 | 131.46±18.39 | <0.001 |
| Diastolic blood pressure (mmHg) | 77.37±10.81 | 79.16±11.01 | <0.001 |
| LDL-C (mmol/L) | 3.01±0.83 | 3.03±0.78 | 0.44 |
| HDL-C (mmol/L) | 1.45±0.40 | 1.41±0.46 | <0.001 |
| TG (mmol/L) | 1.36±0.86 | 1.67±1.21 | <0.001 |
| TC (mmol/L) | 5.15±0.95 | 5.25±0.94 | 0.001 |
| ALT (U/L) | 20 (15–26) | 23 (17–33) | <0.001 |
| AST (U/L) | 23 (19–28) | 24 (19–29) | <0.001 |
BMI, body mass index; LDL-C, low-density lipoprotein cholesterol; HDL-C, high-density lipoprotein cholesterol; TG, triglycerides; TC, total cholesterol; ALT, alanine aminotransferase; AST, aspartate aminotransferase.
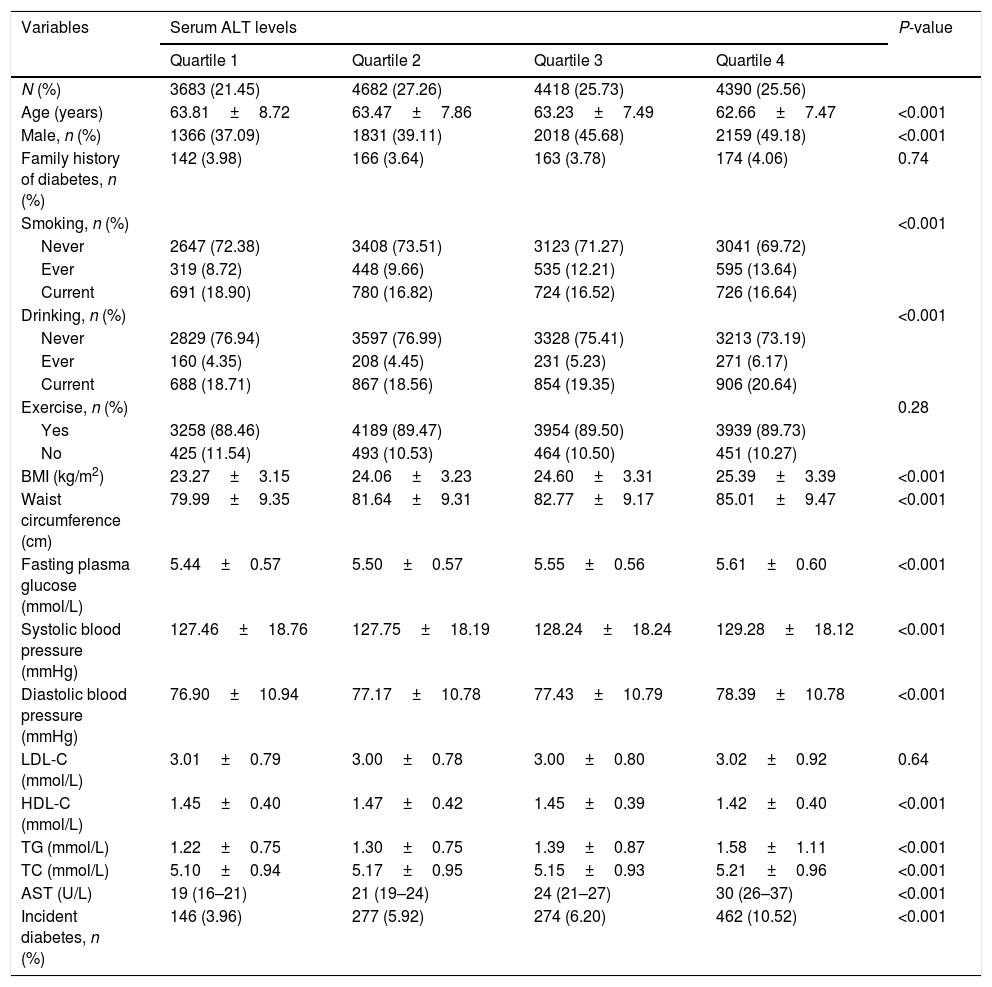
Baseline clinical and biochemical characteristics of the study populations according to baseline serum ALT levels are shown in Table 2. High serum ALT concentrations were significantly associated with higher levels of AST, BMI and waist circumference, fasting plasma glucose, systolic blood pressure, diastolic blood pressure, triglycerides, total cholesterol levels, in contrast, with lower levels of HDL-C. The incident type 2 diabetes increased significantly with increasing ALT levels (3.96%, 5.92%, 6.20%, and 10.52% in four groups respectively). Supplementary Table 1 shows that the baseline characteristics according to baseline serum AST levels. The incident diabetes in subjects with the highest quartile of AST levels was 8.03%.
Baseline characteristics of the subjects according to serum ALT levels.
| Variables | Serum ALT levels | P-value | |||
|---|---|---|---|---|---|
| Quartile 1 | Quartile 2 | Quartile 3 | Quartile 4 | ||
| N (%) | 3683 (21.45) | 4682 (27.26) | 4418 (25.73) | 4390 (25.56) | |
| Age (years) | 63.81±8.72 | 63.47±7.86 | 63.23±7.49 | 62.66±7.47 | <0.001 |
| Male, n (%) | 1366 (37.09) | 1831 (39.11) | 2018 (45.68) | 2159 (49.18) | <0.001 |
| Family history of diabetes, n (%) | 142 (3.98) | 166 (3.64) | 163 (3.78) | 174 (4.06) | 0.74 |
| Smoking, n (%) | <0.001 | ||||
| Never | 2647 (72.38) | 3408 (73.51) | 3123 (71.27) | 3041 (69.72) | |
| Ever | 319 (8.72) | 448 (9.66) | 535 (12.21) | 595 (13.64) | |
| Current | 691 (18.90) | 780 (16.82) | 724 (16.52) | 726 (16.64) | |
| Drinking, n (%) | <0.001 | ||||
| Never | 2829 (76.94) | 3597 (76.99) | 3328 (75.41) | 3213 (73.19) | |
| Ever | 160 (4.35) | 208 (4.45) | 231 (5.23) | 271 (6.17) | |
| Current | 688 (18.71) | 867 (18.56) | 854 (19.35) | 906 (20.64) | |
| Exercise, n (%) | 0.28 | ||||
| Yes | 3258 (88.46) | 4189 (89.47) | 3954 (89.50) | 3939 (89.73) | |
| No | 425 (11.54) | 493 (10.53) | 464 (10.50) | 451 (10.27) | |
| BMI (kg/m2) | 23.27±3.15 | 24.06±3.23 | 24.60±3.31 | 25.39±3.39 | <0.001 |
| Waist circumference (cm) | 79.99±9.35 | 81.64±9.31 | 82.77±9.17 | 85.01±9.47 | <0.001 |
| Fasting plasma glucose (mmol/L) | 5.44±0.57 | 5.50±0.57 | 5.55±0.56 | 5.61±0.60 | <0.001 |
| Systolic blood pressure (mmHg) | 127.46±18.76 | 127.75±18.19 | 128.24±18.24 | 129.28±18.12 | <0.001 |
| Diastolic blood pressure (mmHg) | 76.90±10.94 | 77.17±10.78 | 77.43±10.79 | 78.39±10.78 | <0.001 |
| LDL-C (mmol/L) | 3.01±0.79 | 3.00±0.78 | 3.00±0.80 | 3.02±0.92 | 0.64 |
| HDL-C (mmol/L) | 1.45±0.40 | 1.47±0.42 | 1.45±0.39 | 1.42±0.40 | <0.001 |
| TG (mmol/L) | 1.22±0.75 | 1.30±0.75 | 1.39±0.87 | 1.58±1.11 | <0.001 |
| TC (mmol/L) | 5.10±0.94 | 5.17±0.95 | 5.15±0.93 | 5.21±0.96 | <0.001 |
| AST (U/L) | 19 (16–21) | 21 (19–24) | 24 (21–27) | 30 (26–37) | <0.001 |
| Incident diabetes, n (%) | 146 (3.96) | 277 (5.92) | 274 (6.20) | 462 (10.52) | <0.001 |
ALT, alanine aminotransferase; BMI, body mass index; LDL-C, low-density lipoprotein cholesterol; HDL-C, high-density lipoprotein cholesterol; TG, triglycerides; TC, total cholesterol; AST, aspartate aminotransferase.
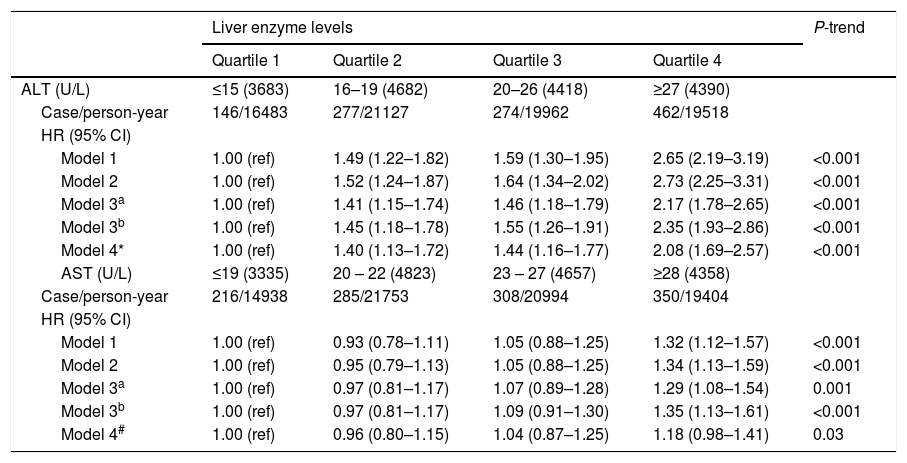
Associations between serum ALT and AST levels at baseline and incident diabetes risk are shown in Table 3. In the final multivariable model, compared with the first quartile of ALT levels, participants in quartiles 2–4 of ALT levels were significantly associated with an increased risk of incident diabetes after adjustment for age, sex, drinking, smoking, exercise, family history of diabetes, and BMI (HR 1.41 [95% CI 1.15–1.74], 1.46 [1.18–1.79] and 2.17 [1.78–2.65], respectively) (P for trend <0.001). Compared with the first quartile of AST levels, the HR (95% CI) of incident diabetes risk for quartiles 2–4 was 0.97 (0.81–1.17), 1.07 (0.89–1.28), and 1.29 (1.08–1.54) (P for trend=0.001) in the final multivariable model. Further adjustment for AST in the full multivariable model did not materially alter the associations between ALT levels and incident diabetes risk; in contrast, the association between AST and incident diabetes risk was marginal after addition of ALT levels into the full multivariable model (P for trend=0.03).
Hazard ratios (HRs) for development of diabetes by baseline serum ALT and AST levels.
| Liver enzyme levels | P-trend | ||||
|---|---|---|---|---|---|
| Quartile 1 | Quartile 2 | Quartile 3 | Quartile 4 | ||
| ALT (U/L) | ≤15 (3683) | 16–19 (4682) | 20–26 (4418) | ≥27 (4390) | |
| Case/person-year | 146/16483 | 277/21127 | 274/19962 | 462/19518 | |
| HR (95% CI) | |||||
| Model 1 | 1.00 (ref) | 1.49 (1.22–1.82) | 1.59 (1.30–1.95) | 2.65 (2.19–3.19) | <0.001 |
| Model 2 | 1.00 (ref) | 1.52 (1.24–1.87) | 1.64 (1.34–2.02) | 2.73 (2.25–3.31) | <0.001 |
| Model 3a | 1.00 (ref) | 1.41 (1.15–1.74) | 1.46 (1.18–1.79) | 2.17 (1.78–2.65) | <0.001 |
| Model 3b | 1.00 (ref) | 1.45 (1.18–1.78) | 1.55 (1.26–1.91) | 2.35 (1.93–2.86) | <0.001 |
| Model 4* | 1.00 (ref) | 1.40 (1.13–1.72) | 1.44 (1.16–1.77) | 2.08 (1.69–2.57) | <0.001 |
| AST (U/L) | ≤19 (3335) | 20 – 22 (4823) | 23 – 27 (4657) | ≥28 (4358) | |
| Case/person-year | 216/14938 | 285/21753 | 308/20994 | 350/19404 | |
| HR (95% CI) | |||||
| Model 1 | 1.00 (ref) | 0.93 (0.78–1.11) | 1.05 (0.88–1.25) | 1.32 (1.12–1.57) | <0.001 |
| Model 2 | 1.00 (ref) | 0.95 (0.79–1.13) | 1.05 (0.88–1.25) | 1.34 (1.13–1.59) | <0.001 |
| Model 3a | 1.00 (ref) | 0.97 (0.81–1.17) | 1.07 (0.89–1.28) | 1.29 (1.08–1.54) | 0.001 |
| Model 3b | 1.00 (ref) | 0.97 (0.81–1.17) | 1.09 (0.91–1.30) | 1.35 (1.13–1.61) | <0.001 |
| Model 4# | 1.00 (ref) | 0.96 (0.80–1.15) | 1.04 (0.87–1.25) | 1.18 (0.98–1.41) | 0.03 |
Model 1: adjusted for age, sex.
Model 2: adjusted for variables in model 1 plus drinking, smoking, exercise, and family history of diabetes.
Model 3a: adjusted for variables in model 2 plus baseline BMI.
Model 3b: adjusted for variables in model 2 plus baseline waist circumference.
Model 4*: adjusted for variables in model 3a plus baseline AST.
Model 4#: adjusted for variables in model 3a plus baseline ALT.
The associations of serum ALT levels with incident type 2 diabetes risk in stratification analysis by sex, family history of diabetes (yes or no), current drinking status (yes or no), BMI (normal or overweight/obesity), and waist circumference (normal or abdominal obesity) are shown in Supplementary Table 2. No significant interactions were found for serum ALT levels and any of the above variables on the incident type 2 diabetes risk (all P-interaction >0.05).
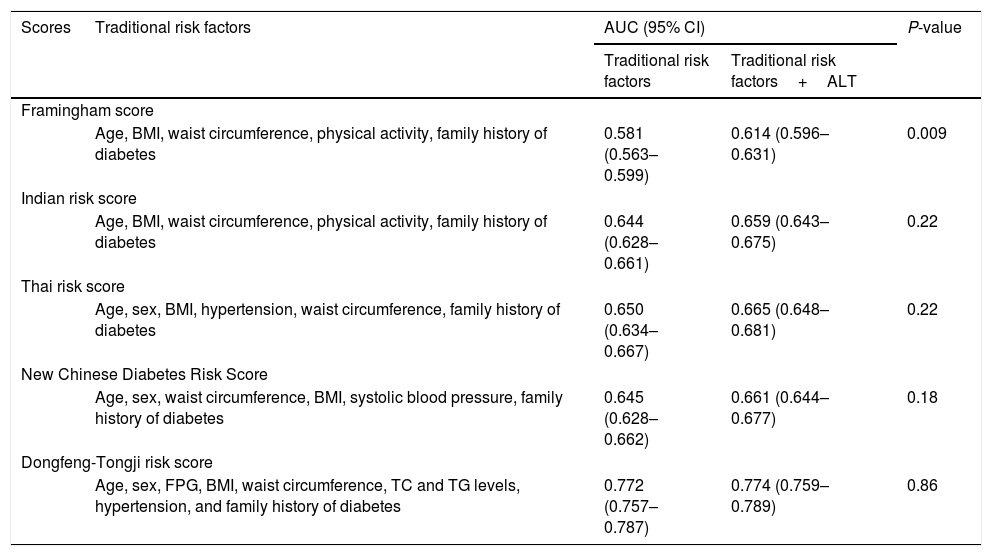
The predictive ability of ALT levels for incident type 2 diabetes risk is shown in Table 4. The addition of ALT levels into the traditional risk factors (age, sex, fasting blood glucose, BMI, waist circumference, TC and TG levels, hypertension, and family history of diabetes) did not improve the predictive ability of incident type 2 diabetes risk, with AUC increase from 0.772 to 0.774; P=0.86. The addition of the ALT levels into the model slightly improved the predictive ability in Framingham risk score with limited AUC increase from 0.581 to 0.614; P=0.009. However, addition of ALT levels into the model did not improve the predictive ability of other diabetes risk scores including Indian risk score, Thai risk score, and New Chinese diabetes risk score (AUC0.659 [95% CI:0.643–0.675],0.665 [0.648–0.681]and 0.661 [0.644 –0.677], respectively) (P>0.05).
Performance of traditional risk factors with and without ALT for predicting incident type 2 diabetes risk.
| Scores | Traditional risk factors | AUC (95% CI) | P-value | |
|---|---|---|---|---|
| Traditional risk factors | Traditional risk factors+ALT | |||
| Framingham score | ||||
| Age, BMI, waist circumference, physical activity, family history of diabetes | 0.581 (0.563–0.599) | 0.614 (0.596–0.631) | 0.009 | |
| Indian risk score | ||||
| Age, BMI, waist circumference, physical activity, family history of diabetes | 0.644 (0.628–0.661) | 0.659 (0.643–0.675) | 0.22 | |
| Thai risk score | ||||
| Age, sex, BMI, hypertension, waist circumference, family history of diabetes | 0.650 (0.634–0.667) | 0.665 (0.648–0.681) | 0.22 | |
| New Chinese Diabetes Risk Score | ||||
| Age, sex, waist circumference, BMI, systolic blood pressure, family history of diabetes | 0.645 (0.628–0.662) | 0.661 (0.644–0.677) | 0.18 | |
| Dongfeng-Tongji risk score | ||||
| Age, sex, FPG, BMI, waist circumference, TC and TG levels, hypertension, and family history of diabetes | 0.772 (0.757–0.787) | 0.774 (0.759–0.789) | 0.86 | |
AST, aspartate aminotransferase; ALT, alanine aminotransferase; ROC, receiver-operating characteristic; BMI, body mass index; TG, triglycerides; TC, total cholesterol; FPG, fasting plasma glucose.
In the present study, we investigated the associations of serum ALT and AST levels and incident type 2 diabetes risk in a prospective study among a middle-aged and elderly Chinese population. Our results suggested that elevated serum ALT or AST levels were positively associated with increased incident type 2 diabetes risk. Of the two liver enzymes, ALT levels were more strongly associated with incident diabetes risk. However, serum ALT levels did not improve the predictive ability of type 2 diabetes based on the traditional risk factors.
Several prospective studies also found that serum ALT concentrations increased risk of incident type 2 diabetes [19,20]. A systematic review and a meta-analysis of prospective studies further established the positive associations [21]. The present cohort study added further evidence that ALT levels were significantly associated with increased risk of developing diabetes. The association between ALT levels and incident diabetes risk could be explained in several mechanisms. ALT, as a specific marker of accumulation of liver fat, was associated with hepatic insulin sensitivity [22]. ALT is commonly considered as an epidemiologic biomarker of nonalcoholic fatty liver disease, which was associated with increased risk of developing diabetes [23]. In addition, ALT levels have been demonstrated to be connected with hepatic insulin resistance, which may contribute to the development of the diabetes [24].
Several prospective studies examined the association between serum AST levels and incident type 2 diabetes risk but the results were inconsistent [25,26]. In the present study, slightly positive association was observed between AST levels and risk of developing type 2 diabetes compared with ALT levels. A possible explanation for the stronger association of ALT levels with incident diabetes risk compared with AST is that serum AST are less specific marker of liver function, as AST could be found in other tissues [27].
Till now, numerous prospective studies have been conducted to establish diabetes risk scores and to identify subjects with high risk of incident diabetes among different populations [7,28]. For example, Framingham model included variables including fasting glucose, BMI, HDL-C levels, family history of diabetes and hypertension [29] to predict the incident diabetes risk. The Indian model included age, BMI, waist circumference, physical activity, family history of diabetes to predict the incident diabetes risk [5]. Using age, family history of diabetes, abdominal obesity and physical activity, Mohan and colleagues constructed the Indian diabetes risk score [5]. Several prospective studies also developed models to predict incident type 2 diabetes risk among Chinese population [8,9].
The AUCs of these existing diabetes risk scores ranged from 0.70 to 0.75 in the original study populations. However, in the present study these diabetes risk scores performed not so good as in their original population, with the AUCs ranged from 0.61 to 0.67, indicating that a population-specific diabetes risk score was needed. For example, based on the present population, addition of ALT levels into the Framingham score significantly improved the predictive ability of incident diabetes risk, however, limited AUC was observed (AUC=0.61). In contrast, in the present study, using traditional risk factors (age, sex, fasting blood glucose, BMI, waist circumference, TC and TG levels, hypertension, and family history of diabetes) did improve the predictive ability of incident type 2 diabetes risk, with AUC of 0.772. Although to some extent the established diabetes predictive models could predict incident diabetes risk, the predictive ability was still needed to be improved. Finding more novel variables to predict incident diabetes risk is still warranted. In the present study, the serum ALT levels were positively associated with risk of developing type 2 diabetes. However, serum ALT levels did not improve the predictive ability of type 2 diabetes based on the traditional factors (AUC=0.774). To the best of our knowledge, limited prospective studies were conducted to investigate the discrimination of incident diabetes risk by adding liver enzymes into the traditional risk factors model. Future prospective studies are needed to find more novel variables to improve the predictive ability of model in the discrimination of type 2 diabetes.
This study has several strengths. Firstly, there are few prospective studies to examine the predictive ability of liver enzymes in the discrimination of type 2 diabetes. Secondly, the sample size in the present prospective cohort was relative large, the finding might be more convincible. Thirdly, time-dependent Cox regression model was used, which could minimize the possibility of residual and time-dependent confounding.
Several limitations should be considered. Firstly, participants included in the present cohort study were middle-aged and elderly Chinese populations, therefore the findings might not be generalized to other populations. Secondly, we used plasma fasting glucose but not a 2-h OGTT or HbA1c levels to exclude undiagnosed diabetes at baseline and identify the incidence of diabetes during the follow-up, which might result in some misclassification. Thirdly, we measured the levels of liver enzymes only once, which may lead to minor inaccuracies.
5ConclusionsIn conclusion, the present prospective study provides evidence that high serum ALT and AST levels were independently associated with increased incident type 2 diabetes risk among a middle-aged and elderly Chinese population. However, ALT levels did not improve the predictive ability of type 2 diabetes based on traditional risk factors. Future studies are needed to confirm our findings among different populations.AbbreviationsFINDRISC the Finnish diabetes risk score the Indian diabetes risk score alanine aminotransferase aspartate aminotransferase body mass index total cholesterol triglycerides high-density lipoprotein cholesterol low-density lipoprotein cholesterol standard deviation hazard ratios confidence intervals receiver-operating characteristic oral glucose tolerance test
This work was supported by the grant from the National Natural Science Foundation (grant NSFC-81522040, 81473051, and 81230069); the 111 Project (No. B12004); the Program for Changjiang Scholars; Innovative Research Team in University of Ministry of Education of China (No. IRT1246); China Medical Board (No. 12-113) and the Program for the New Century Excellent Talents in University (NCET-11-0169) for Meian He.
Conflict of interestWe confirm there are no conflicts of interest.
The authors would like to thank the staffs and participants in the DFTJ-cohort study as well as all volunteers for assisting in collecting the samples and questionnaire data.
The following are the supplementary data to this article:


