


Practicing physicians often hesitate to use statins and/or other lipid-lowering therapies in NAFLD due to concern for hepatotoxicity. The aim of this study is to examine the safety of lipid lowering therapies in NAFLD patients.
Materials and MethodsData from randomized control trials (RCT) among NAFLD patients were pooled to examine the effect of lipid-lowering therapies on liver chemistry, lipid profile, and liver histology. Results are reported as the mean difference of the change (pretreatment-posttreatment) between the treatment and control group.
ResultsA total of 21 placebo-controlled RCT on 1900 patients (304 receiving statins, 520 other lipid-lowering therapies, and 61 combinations) were treated for 26 weeks [Interquartile range (IQR): 17.5-52 weeks]. Pooled data showed an improved lipid profile without any worsening of ALT, AST, total bilirubin, or alkaline phosphatase at the end of the treatment period. NAFLD activity score improved with other lipid-lowering agents but not with statins. There was no change in individual components of NAFLD activity score or fibrosis stage.
ConclusionThis meta-analysis of randomized controlled trials examining statins and/or other lipid-lowering therapies in NAFLD patients showed no evidence of worsening liver chemistry. Studies with longer use of lipid-lowering therapies are suggested to examine the benefit of liver histology among patients with NAFLD.
Non-alcoholic fatty liver disease (NAFLD) is the most common cause of liver disease worldwide [1]. Its spectrum extends from steatosis to non-alcoholic steatohepatitis (NASH), cirrhosis, and hepatocellular carcinoma [1]. NASH cirrhosis is currently the second leading etiology for liver transplantation and the fastest growing indication for simultaneous liver-kidney transplantation, hepatocellular carcinoma, and admissions with liver failure [2–5].
NAFLD is currently recognized as the most common cause of elevated liver enzymes [1]. In addition, NAFLD represents the hepatic manifestation of metabolic syndrome and insulin resistance, and includes central obesity, type 2 diabetes mellitus, dyslipidemia and hypertension. Dyslipidemia as a risk factor for the development of NAFLD is frequently observed in these patients, and is characterized by decreased serum high-density lipoprotein (HDL) and increased serum triglycerides (TG) levels [1]. Hence, appropriate treatment of dyslipidemia is important for the management of patients with NAFLD. The mainstay of treatment is 3-hydroxy-3-methyl-glutaryl-CoA reductase (HMG-CoA) reductase inhibitors (i.e., statins) along with lipid-lowering therapies. Improved lipid profile with statins reduces cardiovascular mortality, and statins are recommended to be used for at-risk populations [6]. Statins also provide anti-inflammatory, anti-oxidant, and anti-thrombotic benefits by targeting pathways that are activated in the pathophysiology of NAFLD [7]. Further, the data is accumulating on the benefits of statins on liver fibrosis, HCC risk, liver disease complications, and overall survival [8].
However, the fear of hepatotoxicity with the use of statins and/or triglyceride lowering therapy for dyslipidemia in patients with NAFLD often deters physicians from their use in clinical practice [1, 9]. The objective of this meta-analysis is to examine the effect of using statins or lipid-lowering therapies among NAFLD patients on the risk of hepatotoxicity. We also examined their effects on lipid profile and liver histology.
2Methods2.1Search strategy and study selection for analysisA comprehensive literature search was conducted in PubMed, EMBASE, PsycINFO, and Cochrane databases through May 2020 for the safety and efficacy of lipid-lowering agents and omega-3 polyunsaturated fatty acid (PUFA) supplementation in patients with NAFLD and is described in the supplementary document. As per the Preferred Reporting Items for Systematic Reviews and Meta-Analysis (PRISMA) guidelines, full-length articles in English reporting on lean NAFLD were identified. Data from selected studies on patients with NAFLD comparing statins and/or lipid-lowering therapy against placebo or other active agents were extracted and pooled in this meta-analysis. Identification of studies for analysis was performed independently by three investigators (M.A., J.P., A.K.S) using inclusion criteria–A) randomized-controlled trials; (b) included adult subjects; c) published in English language; and (d) reported as full papers. The studies were excluded if: (1) without a control group; (2) without data on pre- and post-treatment study outcomes; (3) studies not including lipid-lowering agents; (4) non-randomized studies; or 5) not meeting ≥1 inclusion criteria. We also excluded certain studies despite meeting inclusion and exclusion criteria because they reported results in a format that was not extractable for meta-analysis. Retrieved articles were independently reviewed for their eligibility by the three investigators. Any discrepancy among investigators was resolved by consensus among all the investigators. Given that one of the aims of the study is to evaluate hepatotoxicity of lipid-lowering agents, we included studies that compared the combination of two lipid-lowering agents vs. another agent or a placebo.
2.2Study quality assessmentTwo reviewers (M.A and S.G) independently assessed the methodological quality of studies using the risk of bias by Cochrane for RCTs (Supplementary Fig. 1, 2) [10]. Each study was graded on the study quality as per the following criteria: sequence generation for the randomization of subjects, allocation concealment, participant blinding, outcome assessment blinding, attrition bias, and any other sources of bias. The risk of bias for one of the first three components is defined as a high risk of bias.
2.3Study outcomesThe primary outcome of this study is the effect of lipid-lowering drugs on liver toxicity evaluated by the change in liver biochemical profile (pre-treatment value – post-treatment value) in serum levels of alanine aminotransferase (ALT), aspartate aminotransferase (AST), alkaline phosphatase (ALP), and total bilirubin (TB). Secondary outcomes are the effect of lipid-lowering drugs on a) lipid profile (pre-treatment – post-treatment) in serum levels of total cholesterol (TC), low-density lipoprotein (LDL), high-density lipoprotein (HDL), triglycerides (TG) and b) liver histology (pre-treatment – post- treatment) in steatosis grade, lobular inflammation score (LI), ballooning severity, NAFLD activity score (NAS), and fibrosis.
2.4Data extractionData from studies selected for analysis were extracted independently by three authors (J.P., M.A., and S.G.) on A) characteristics (sample size, study population); b) patient demographics (age, gender, and BMI); c) treatment details (type of intervention, comparator group, dose in each group, duration of treatment); c) diabetes mellitus; d) serum liver chemistry before and after treatment (ALT, AST, ALP in IU/l, and total bilirubin in mg/dL); e) serum lipid profile values before and after treatment (TC, LDL, HDL and TG in mg/dL); and f) liver histology before and after treatment (steatosis, lobular inflammation, ballooning, NAS, and fibrosis stage). If studies reported continuous variables with median values, this was converted into mean using standard statistical methods [11]. Similarly, if the unit of variation was reported as standard error of mean, this was converted to standard deviation (SD). For studies reporting laboratory values in molar concentration, these were converted to mass concentration.
2.5DefinitionsNAFLD: Hepatic steatosis in the absence of other causes of liver disease and alcohol use <30 g/d in males and <20 g/d in females [1].
Steatosis grade: on liver histology with% of hepatocytes showing fat as grade 1 (5-33%), grade 2 (34-66%), and grade 3 (≥66%) [12].
Lobular inflammation: graded by number of inflammatory foci per 200X field as grade 1 (<2 foci) grade 2 (2-4 foci), and grade 3 (>4 foci) [12].
Hepatocyte ballooning: graded by number of ballooned hepatocytes as grade 1 (few balloon cells), and grade 2 (many ballooned cells) [12].
NAFLD activity score (NAS): sum of the scores for steatosis, lobular inflammation, and ballooning [12].
NASH–Defined on liver histology with NAS ≥5 [12].
Fibrosis stage–As stage 1 with peri-sinusoidal or portal fibrosis, stage 2 with peri-portal fibrosis, stage 3 as bridging fibrosis, and stage 4 with cirrhosis [12].
2.6Data analysesComprehensive Meta-analysis Software (CMA) was used to pool the data, using random effects model. Pooled effect size represented as Forrest plots is reported as standardized mean difference (SMD) with 95% confidence interval (CI) and considered significant if the 95% CI does not cross ‘0’. For each study, the SMD is the difference in means between groups divided by standard deviation among the participants in that study.
Heterogeneity between the studies was assessed using the I2 statistics (I2 >50% or P <0.05). If the data were heterogeneous, reason/s of heterogeneity were examined using the subgroup and/or sensitivity analyses. Visual inspection of funnel plots Egger's regression test was used to assess the publication bias [13]. P<0.05 was considered significant for all the analyses.
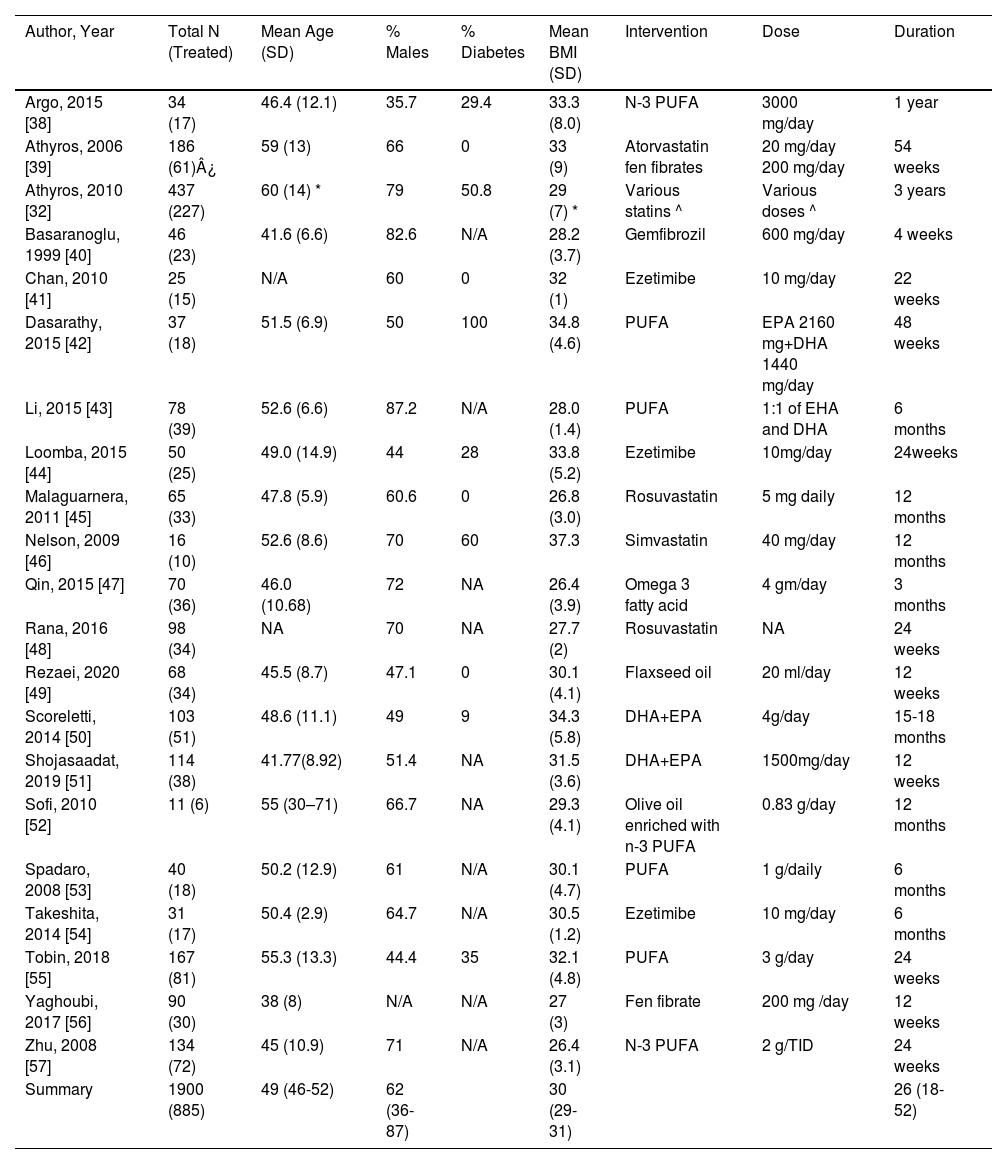
3Results3.1Baseline characteristicsThe PRISMA flow diagram and results based on the search strategies and selection criteria described above are outlined in (Fig. 1) [14]. Of the 4818 studies identified in initial literature search, 35 studies met the inclusion criteria. Fourteen studies, however, were excluded (four for the lack of randomization, four other studies for not having data presented in an extractable form for meta-analysis, and six for insufficient data for treatment and/or control). Therefore, twenty-one studies were included in the final meta-analysis. There were 1900 patients (304 received statins, 520 other lipid- lowering agents and 61 with combination therapy). The mean age of patients treated with single agent or a combination of two lipid-lowering agents was 49.3 (95% CI: 46.4-52.2) years, with 61.6% males (range: 35.7-87.2%). The mean body mass index was 30 (95% CI: 29-31) Kg/m2. The median duration of treatment was 26 weeks [25-75% Interquartile range (IQR): 17.5-52 weeks] (Table 1). Among eleven studies with available information, 28.4% (range: 0-100) of patients were included with diabetes mellitus as comorbidity. Most importantly, 18 out of the included 21 studies (85.7%) had an elevated ALT at baseline.
Baseline characteristics of studies included in the analysis.
| Author, Year | Total N (Treated) | Mean Age (SD) | % Males | % Diabetes | Mean BMI (SD) | Intervention | Dose | Duration |
|---|---|---|---|---|---|---|---|---|
| Argo, 2015 [38] | 34 (17) | 46.4 (12.1) | 35.7 | 29.4 | 33.3 (8.0) | N-3 PUFA | 3000 mg/day | 1 year |
| Athyros, 2006 [39] | 186 (61)¿ | 59 (13) | 66 | 0 | 33 (9) | Atorvastatin fen fibrates | 20 mg/day 200 mg/day | 54 weeks |
| Athyros, 2010 [32] | 437 (227) | 60 (14) * | 79 | 50.8 | 29 (7) * | Various statins ^ | Various doses ^ | 3 years |
| Basaranoglu, 1999 [40] | 46 (23) | 41.6 (6.6) | 82.6 | N/A | 28.2 (3.7) | Gemfibrozil | 600 mg/day | 4 weeks |
| Chan, 2010 [41] | 25 (15) | N/A | 60 | 0 | 32 (1) | Ezetimibe | 10 mg/day | 22 weeks |
| Dasarathy, 2015 [42] | 37 (18) | 51.5 (6.9) | 50 | 100 | 34.8 (4.6) | PUFA | EPA 2160 mg+DHA 1440 mg/day | 48 weeks |
| Li, 2015 [43] | 78 (39) | 52.6 (6.6) | 87.2 | N/A | 28.0 (1.4) | PUFA | 1:1 of EHA and DHA | 6 months |
| Loomba, 2015 [44] | 50 (25) | 49.0 (14.9) | 44 | 28 | 33.8 (5.2) | Ezetimibe | 10mg/day | 24weeks |
| Malaguarnera, 2011 [45] | 65 (33) | 47.8 (5.9) | 60.6 | 0 | 26.8 (3.0) | Rosuvastatin | 5 mg daily | 12 months |
| Nelson, 2009 [46] | 16 (10) | 52.6 (8.6) | 70 | 60 | 37.3 | Simvastatin | 40 mg/day | 12 months |
| Qin, 2015 [47] | 70 (36) | 46.0 (10.68) | 72 | NA | 26.4 (3.9) | Omega 3 fatty acid | 4 gm/day | 3 months |
| Rana, 2016 [48] | 98 (34) | NA | 70 | NA | 27.7 (2) | Rosuvastatin | NA | 24 weeks |
| Rezaei, 2020 [49] | 68 (34) | 45.5 (8.7) | 47.1 | 0 | 30.1 (4.1) | Flaxseed oil | 20 ml/day | 12 weeks |
| Scoreletti, 2014 [50] | 103 (51) | 48.6 (11.1) | 49 | 9 | 34.3 (5.8) | DHA+EPA | 4g/day | 15-18 months |
| Shojasaadat, 2019 [51] | 114 (38) | 41.77(8.92) | 51.4 | NA | 31.5 (3.6) | DHA+EPA | 1500mg/day | 12 weeks |
| Sofi, 2010 [52] | 11 (6) | 55 (30–71) | 66.7 | NA | 29.3 (4.1) | Olive oil enriched with n-3 PUFA | 0.83 g/day | 12 months |
| Spadaro, 2008 [53] | 40 (18) | 50.2 (12.9) | 61 | N/A | 30.1 (4.7) | PUFA | 1 g/daily | 6 months |
| Takeshita, 2014 [54] | 31 (17) | 50.4 (2.9) | 64.7 | N/A | 30.5 (1.2) | Ezetimibe | 10 mg/day | 6 months |
| Tobin, 2018 [55] | 167 (81) | 55.3 (13.3) | 44.4 | 35 | 32.1 (4.8) | PUFA | 3 g/day | 24 weeks |
| Yaghoubi, 2017 [56] | 90 (30) | 38 (8) | N/A | N/A | 27 (3) | Fen fibrate | 200 mg /day | 12 weeks |
| Zhu, 2008 [57] | 134 (72) | 45 (10.9) | 71 | N/A | 26.4 (3.1) | N-3 PUFA | 2 g/TID | 24 weeks |
| Summary | 1900 (885) | 49 (46-52) | 62 (36-87) | 30 (29-31) | 26 (18-52) |
*Results for patients on statin therapy.
^ Statin drug (median statin dose per day in mg [range]): Atorvastatin 25 (10–80), Simvastatin 22 (10–40), Pravastatin 29 (20–40), Fluvastatin 40 (40–40).
¿ [atorvastatin (n=63), fen fibrate (n=62), combination of atorvastatin and fen fibrate (n=61)].
Of 21 RCTs, all studies reported on random sequence generation (Supplementary Figs. 1 and 2). Four RCTs did not report on concealment of allocation. Ten studies did not blind the study personnel or participants, and thirteen studies did not blind the outcome assessor/s. Four RCTs did not report on the attrition rate, and one study failed to provide information on selective reporting of the outcomes. The overall risk of bias was estimated to be low in twelve out of the twenty-one studies included in the meta-analysis.
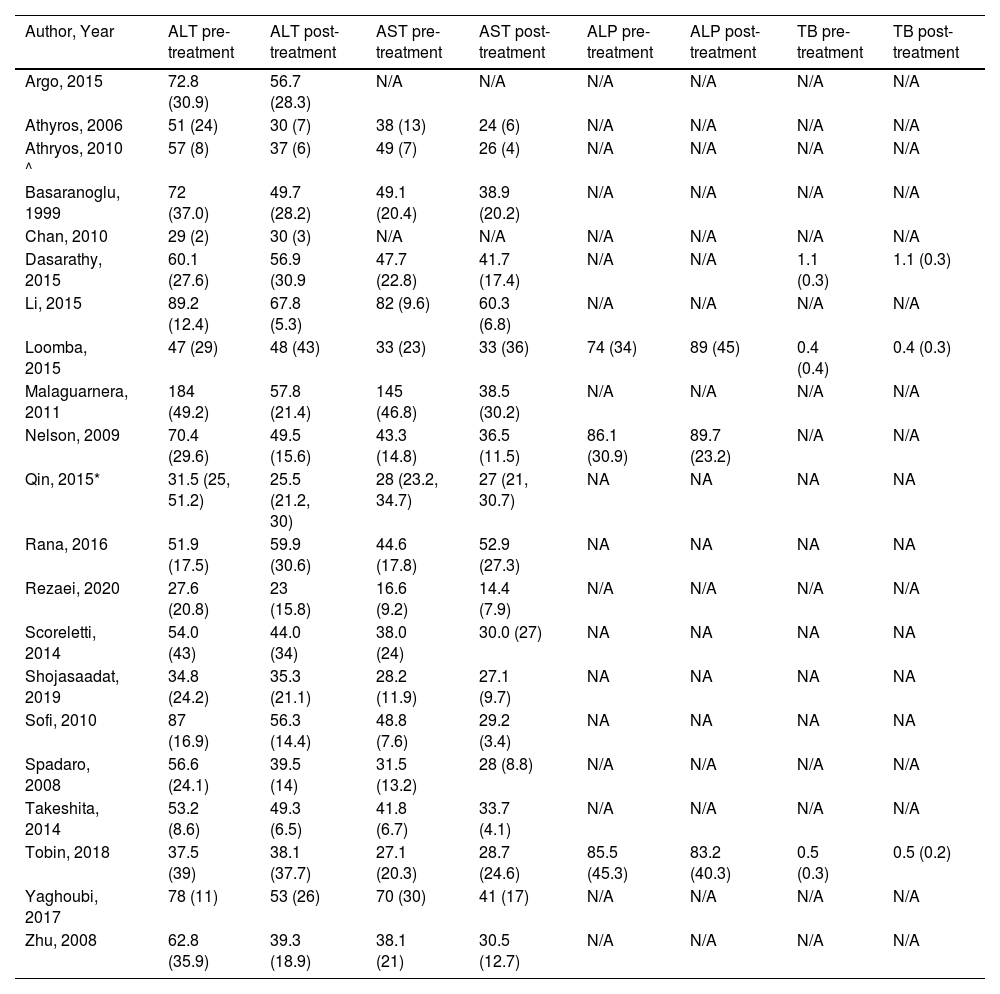
3.3Primary outcome–Change in liver chemistryData on ALT, AST, ALP, and serum total bilirubin values before and after treatment for intervention and control arms (Table 2) were pooled for SMD (95% CI) on change (pre-treatment – post-treatment).
Liver chemistry profile [values given as mean (SD), IU/liter except for TB in mg/dL] before and after treatment.
^ Results for patients on statin therapy.
*Median, interquartile range (IQR).
Change in serum ALT levels was similar after intervention versus the control arm on pooled data from 21 studies, with mean difference (95% CI) of 0.35 (-0.19-0.88, P = 0.21). The data were heterogeneous with I2 = 96, P<0.001 (Fig. 2A). There was no publication bias, Egger's regression test P = 0.21.
 alanine aminotransferase (ALT), B) aspartate aminotransferase (AST), C) alkaline phosphatase (ALP), and D) total bilirubin (TB).")
Mean serum AST levels from baseline value were also similar between treatment and control arm on pooled data from 19 studies, with mean difference (95% CI) of 0.58 (-0.05-1.2, P<0.07). The data were heterogeneous with I2 = 96, P<0.001 (Fig. 2B). There was no publication bias, P = 0.66.
Change in serum ALP levels after intervention compared to control arm was similar on pooled data from three studies, with mean difference (95% CI) of -0.04 (-0.32 - 0.24, P = 0.78). The data were homogeneous with I2 = 6, P = 0.34 without publication bias, P = 0.46 (Fig. 2C).
Change in mean serum bilirubin levels after intervention compared to control arm was similar on pooled data from three studies, with mean difference (95% CI) of 0.09 (-0.16 - 0.33, P = 0.48). The data were homogeneous with I2 = 0, P = 0.89 without publication bias, P = 0.077 (Fig. 2D).
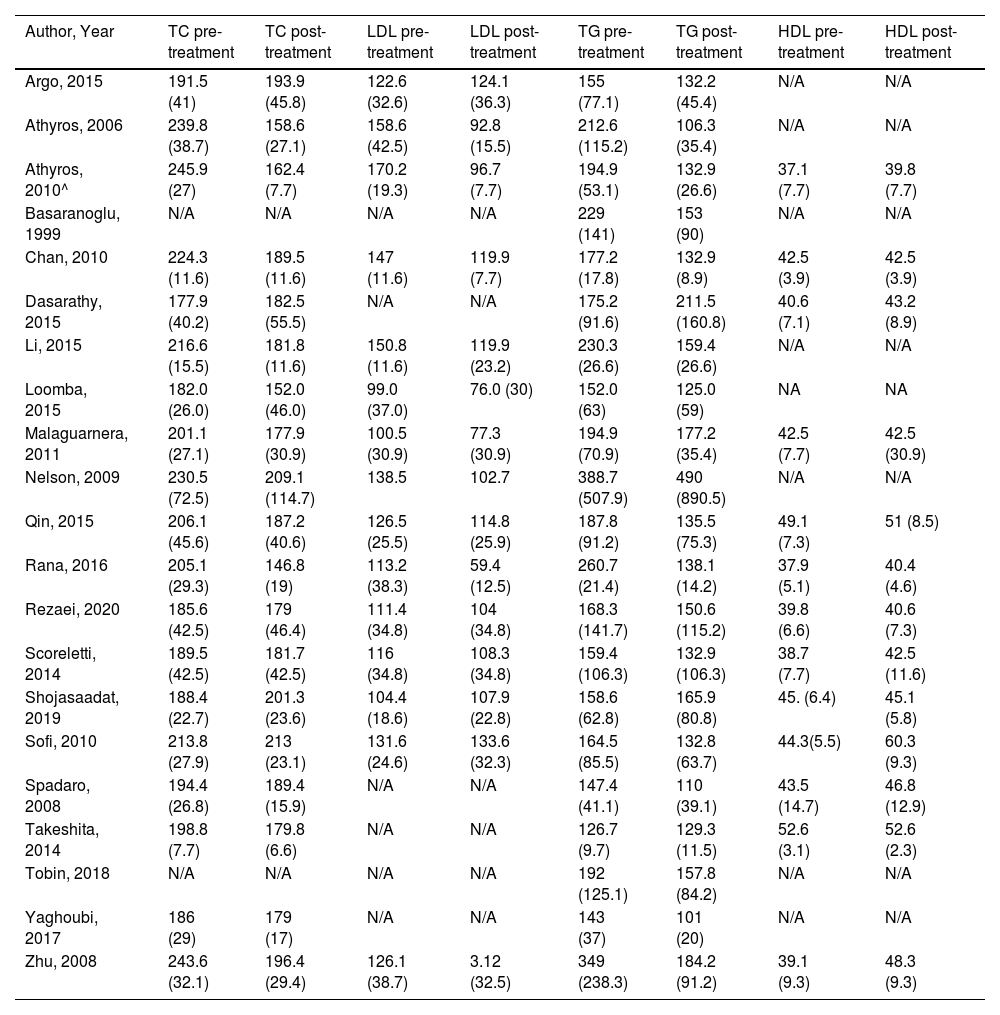
3.4Secondary outcomes3.4.1Change in lipid profileData on TC, LDL, HDL, and TG values before and after treatment for the intervention as well for the control arm were extracted (Table 3). Data were pooled in the statistical software for MD (95% CI) on the change (pre-treatment – post-treatment) in the two arms.
Lipid profile [values given as mean (SD), mg/dL] before and after treatment.
^ Results for patients on statin therapy * Percentage of patient improvement or stability after 6 months (95% CI) ** Median and interquartile range (IQR).
Mean (95% CI) serum TC level was lower by 0.58 (0.03-1.31), P = 0.039 after intervention compared to control arm on pooled data from 18 studies. The data were heterogeneous with I2 = 95, P<0.001 (Fig. 3A). There was no publication bias, P = 0.068.
 serum total cholesterol (TC), B) low-density lipoprotein (LDL), C) high-density lipoprotein (HDL), and D) triglycerides (TG).")
Mean (95% CI) serum LDL level was lower by 0.83 (0.20-1.5, P = 0.01), after intervention compared to control arm on pooled data from 16 studies. The data were heterogeneous with I2 = 95, P<0.001 (Fig. 3B). There was no publication bias, P = 0.90.
Mean (95% CI) serum HDL level changed by -0.04 (-0.39 - 0.32), P = 0.84 (Fig. 3C) after intervention compared to control arm on pooled data from eight studies. The data were homogeneous with I2 = 67, P = 0.003, with a publication bias on Egger's test, P = 0.049.
Mean (95% CI) serum TG level was lower by 0.46 (0.05-0.88), P<0.03 after intervention compared to control arm on pooled data from 21 studies. The data were heterogeneous with I2 = 93, P<0.001 (Fig. 3D). There was no publication bias, P = 0.67.
3.4.2Change in liver histologyData on steatosis grade, lobular inflammation score, hepatocyte ballooning score, NAS and fibrosis before and after treatment for the intervention as well for the control arm were extracted (Supplementary Table 1). Data were pooled in the statistical software for MD (95% CI) on the change (pre-treatment – post-treatment) in the two arms.
Change in steatosis grade was similar after intervention compared to control arm on pooled data from six studies, with mean difference (95% CI) of 0.63 (-0.23-1.49, P = 0.15). The data were heterogeneous with I2 = 90, P<0.001 (Fig. 4A). There was no publication bias, P = 0.69.
 steatosis grade, B) lobular inflammation score (LI), C) hepatocyte ballooning score, D) Non-alcoholic fatty liver disease (NAFLD) activity score (NAS), and E) fibrosis stage.")
Change in lobular inflammation score was similar after intervention compared to control arm on pooled data from six studies, with mean difference (95% CI) of 0.21 (-0.93-1.34, P = 0.80). The data were heterogeneous with I2 = 94, P<0.001 (Fig. 4B). There was no publication bias, P = 0.79.
Change in hepatocyte ballooning severity was similar after intervention compared to control arm on pooled data from four studies, with mean difference (95% CI) of 0.02 (-0.27-0.31, P = 0.89). The data were homogeneous with I2 = 0, P = 0.53 (Fig. 4C). There was no publication bias, P = 0.87.
Mean (95% CI) NAS was lower by 0.49 (0.09-0.89), P<0.02 (Fig. 4D) after intervention compared to control arm on pooled data from three studies. The data were homogeneous with I2 = 3, P = 0.36. There was no publication bias, P = 0.16.
Mean (95% CI) fibrosis stage was lower by 0.51 (-0.25 - 1.27), P = 0.19 (Fig. 4E) after intervention compared to control arm on pooled data from six studies. The data were heterogeneous with I2 = 88, P<0.001. There was no publication bias, P = 0.36.
3.5Subgroup analyses steatosis grade, B) lobular inflammation score (LI), C) hepatocyte ballooning score, D) Non-alcoholic fatty liver disease (NAFLD) activity score (NAS), and E) fibrosis stage.")
Results were similar when pooled data were analyzed only for 12 studies with low risk of study bias (Supplementary Table 2). Similarly, results did not change on separately pooling 10 studies using lipid- lowering therapies and five using statins. The study using combination of statins and lipid-lowering drugs was counted in the subgroup of statins. Both subgroups improved LDL levels (mg/dL) by 1.8 on 8 non-statin studies and 1.64 in 5 studies using statins. Similarly, TG levels (mg/dL) decreased by 1.1 in 10 non-statin studies and 2.6 in 5 studies using statins. However, the decrease TC levels (mg/dL) decreased by 1.1 in 9 studies using non-statin based medications, but there was no change in 5 studies using statins (Supplementary Table 3). Although no publication bias was detected, heterogeneity between studies was noted in both subgroups for most analyses.
4DiscussionThe main finding of this meta-analysis is that drugs used for dyslipidemia among patients with NAFLD are not associated with worsening of liver enzymes, including patients with elevated liver chemistry at baseline. Further, lipid-lowering therapies are associated with improvement in lipid profile, especially LDL levels and TG. Although there was improvement in NAFLD activity score, there was no benefit on its components or on fibrosis.
Asymptomatic ALT elevation with statins is dose‐related, and occurs in less than 3% within the first 12 weeks of therapy, which improves spontaneously in the majority of patients [15]. In another meta‐analysis (n = 49,275), statin use versus placebo was not associated with liver enzymes elevation of > 3 times upper limit normal (1.1% vs. 1.1%, OR 1.3, 95% CI: 0.99–1.62) [16]. Further, the incidence of acute liver failure with statins has been shown to be similar to that of the general population (1:130,000 vs. 1:114,000) [17]. Our NAFLD focused analysis also showed no increased risk of elevation of liver enzymes with use of statins or lipid-lowering drugs. Our study findings strengthen the recently published American Gastroenterology Association Clinical Practice Update based on an expert review advocating that statins and other lipid lowering therapies are safe and effective in NAFLD patients and should not be avoided because of fears of hepatotoxicity [18]. Although drug induced hepatotoxicity are linked to fibrates, compelling evidence for fibrate-induced hepatotoxicity is not available [19]. In a meta-analysis of twenty-six studies on 9494 individuals, the use of fibrates combined with statins was associated with increased risk of hepatotoxicity [20]. However, in the current meta-analysis, use of fibrates and omega-3 fatty acids among NAFLD patients did not increase this risk.
The benefit of statins or lipid-lowering therapies on histological improvement of NASH remains controversial. For example, use of eicosapentanoic acid among patients with NASH or NAFLD did not show any benefit on the liver histology [21, 22]. In another study on 100 subjects, use of statins protected from steatosis, NASH, and fibrosis stage F2-4. This effect was dose dependent and was stronger in subjects not carrying the PNPLA3 at-risk variant [23]. Also, resolution of NASH was shown in 19 out of 20 patients after treatment with rosuvastatin in some reports [24]. Our subgroup analysis, however, did not show improvement of NAS or any of its components with statin or non-statin therapy. This finding is similar to the recently published American Gastroenterology Association Clinical Practice Update based on expert review concluding that no firm recommendation could be derived on the benefit of lipid-lowering therapies on liver histology [18]. The lack of benefit could be due to short period of treatment and observation of about 26 weeks in this pooled data. In a recent report, the observation period on the benefit of statins to reduce the risk of hepatocellular carcinoma was 4-19 years [25]. Studies with long-term treatment are needed to establish the role of these drugs among patients with NASH on improvement of liver disease.
Dyslipidemia among NAFLD patients confers increased risk of cardiovascular disease, the most common cause of death in these patients [26–28]. The association of effective treatment of dyslipidemia on the cardiovascular outcomes is variable with benefit in many studies [29–33], however, no benefit was shown in a recently reported analysis of subjects enrolled in the National Health and Nutrition Examination Survey [34]. In addition, statins use has been shown to protect from NASH and fibrosis among at-risk individuals with improvement in liver histology in NASH patients. Statins also reduce portal pressure, liver disease severity and decompensation, hepatocellular carcinoma risk, and patient mortality in patients with cirrhosis [23, 24, 35, 36].
Pooled data from 21 RCT with large sample size and satisfactory follow up duration is a strength of our study. However, our study is limited by heterogeneous data due to variations across studies on active ingredient, dose, treatment regimen, duration of treatment, and follow up period. Despite heterogeneous data, this pooled data confirms safety of treatment of dyslipidemia among NAFLD patients, with no increased risk for liver enzyme elevations and hepatotoxicity. Although, there are previous studies highlighting safety of drugs for dyslipidemia in NAFLD patients including a recently published practice guidance document by the American Gastroenterological Association, our meta-analysis of all randomized controlled studies on different lipid-lowering therapies has not been performed earlier and provides a high level of evidence to further reassure physicians and providers on the safety of these drugs for treatment of dyslipidemia in NAFLD patients. With effective improvement of lipid profile and reduced risk for cardiovascular event, and added potential benefit on liver disease, the findings of this meta-analysis on safety on treatment of dyslipidemia in NAFLD patients will be reassuring to the practicing physicians. However, it is recommended to obtain baseline liver chemistry profile before initiating the treatment, and practice repeated testing on follow up during treatment of dyslipidemia among patients with NAFLD [37].
5ConclusionThis meta-analysis of randomized controlled trials examining statins and/or other lipid-lowering therapies in NAFLD patients showed no evidence for worsening of liver chemistry. Studies with longer use of lipid-lowering therapies are suggested to examine benefit on liver histology among patients with NAFLD.
FundingThis research did not receive any specific grant from funding agencies in the public, commercial, or not-for-profit sectors.
Author ContributionsMA drafted the article and interpreted the data; LB conceived the idea and extracted the study data; JP extracted the study data; RT contributed to drafting the article; SG extracted the study data; AKS conceived the study design, performed analyses, provided study supervision, and drafted the article. All the authors approved the final version of the manuscript.


