


Introduction. Splanchnic hypoperfusion appears to play a key role in the failure of functional recovery of the graft after orthotopic liver transplantation (LT). The aim of this study was to determine if alterations of tonometric parameters, which are related to splanchnic perfusion, could predict poor graft function in patients undergoing LT.
Materials and methods: After Ethics Committee approval, 68 patients undergoing LT were enrolled. In all the patients, regional-arterial CO2 gradient (Pr-aCO2) was recorded; in addition, the difference between Pr-aCO2 recorded at anhepatic phase (T1) and at the end of surgery (T2) (T2- T1 = ΔPr-aCO2) was calculated. Poor graft function was determined on the basis of Toronto’s classification 72 hours after LT. Student t-test and logistic regression analysis were used for statistical purpose.
Results. ΔPr-aCO2 was significantly greater in patients with poor graft function (3.5 ± 13.2) compared to patients with good graft function (−5.8 ± 12.3) (p = 0.014). The logistic regression analysis showed that the ΔPr-aCO2 was able to predict the onset of poor graft function (p = 0.037). A value of ΔPr-aCO2 ≥ −4 was associated with poor graft function with a sensibility of 93.3% and a specificity of 42.3%.
Conclusion. Our study suggests that the change of Pr-aCO2 may be a valuable index of graft dysfunction. Gastric tonometry might give early prognostic information on the graft outcome, and it may aid clinicians in planning a more strict follow-up and proper interventions in order to improve graft survival.
The prompt diagnosis of poor graft function is important in order to strongly support liver function and improve graft survival; therefore, several parameters, as well as clinical signs, have been adopted in the early postoperative period in order to achieve a diagnosis of poor graft function.1–3
Previous studies suggest that splanchnic hypoperfusion may affect the graft recovery and may lead to liver failure and multiple organ failure (MOF).4,5 Therefore, gastric tonometry, a useful device to examine regional splanchnic perfusion, might provide an indirect assessment of the graft status.6,7 To date, tonometric parameters have been evaluated in many clinical settings,8–10 but few studies have been carried out in cirrhotic patients undergoing LT and none of these has evaluated the effect of graft recovery.6,7,11
pHi is the most used parameter among tonometric ones, whereas regional-arterial gradient of CO2(Pr-aCO2) has been demonstrated to be more sensitive and reliable in detecting splanchnic hypoperfusion,7,12 even if many confounding factors may affect the precision of both parameters.13,14
The hypothesis of this study was that the trend of Pra-CO2 in the course of LT, and particularly the change in Pr-aCO2 between the late anhepatic phase and the end of surgery (ΔPra-CO2) could be a useful predictor of poor graft function.
Material and MethodsAfter obtaining Local Ethics Committee approval and patients’ consent, 68 cirrhotic patients candidate to LT were included in the study. Recipients with non treated esophageal varices were excluded. Patients were listed with a biochemical MELD score of 15 or above. Donor recipient match was performed in order to keep the DMELD value below 1,600, as recently stated.15,16
All the patients underwent cava-sparing liver transplantation.
Standard monitoring consisted of 2-lead electrocardiography (II/V5), pulse oximetry, direct arterial pressure monitoring (radial artery catheter), multi-gas analysis, pulmonary artery catheterization (Vigilance Monitor, Edwards Lifesciences, Irvine, CA, USA), and blood temperature.
General anaesthesia was induced using intravenous propofol (2-3 mg/kg), fentanyl (2-3 mcg/kg) and rocuronium (0.6 mg/kg). Maintenance was performed with sevoflurane and remifentanil in continuous infusion (as required). Just before the induction of anesthesia, omeprazole (40 mg iv) was administered to the recipients in order to obtain reliable tonometric values.17 Patients were ventilated with a tidal volume of 6-8 mL/kg and respiratory rate between 10 and 14 bpm in order to achieve an EtCO2 (the level of carbon dioxide released at the end of expiration) near 35 mmHg.
A gastric tonometer (Tonocap TC-200; Datex, Helsinki, Finland) was placed orally after induction of anaesthesia; regional-arterial gradient of CO2 (Pr-aCO2) and arterial blood gas analysis were recorded throughout the surgery in all the patients. Two time points were considered for data analysis: the end of anhepatic phase (T1) and the end of surgery (T2). Patients with abnormal Pr-aCO2 at the gastric tonometer positioning were excluded from the study. Moreover, the difference between Pr-aCO2 at the end of surgery and at the anhepatic phase (T2-T1; ΔPra-CO2) was used as dependent variable to evaluate the effect of graft recovery. Hemodynamic (PAM, HR, CO) and metabolic (SvC2, lactate) data were also collected.
Fluid therapy and vasoactive administration were performed on the basis of haemodynamic parameters derived from pulmonary artery catheter; each major hemodynamic change (more than 20% of baseline values) was counteracted by fluid therapy and/or by vasoactive drugs administration (norepineprine 0.01-0.05 mcg/kg/min and/or dobutamine 5-8 mcg/ kg/min). In addition, we aimed at 10 g/dL of hemoglobin value through packed red cell infusions and cell-salvaged blood.
AllonTM 2001 thermowrap (Mtre advanced technology LTD, Yavne, IS), warmed fluids, and a forced-air warming device (Bair Hugger Model 505, Arizant Healthcare Inc, MN, USA) were used to maintain patients’ core temperature within the normal range.
Stratification of graft function into 4 grades was used.18,19 It includes the following parameters: transaminase activity (alanine aminotransferase, ALT), bile production, and degree of coagulopathy during the 72 h after transplantation. In a grade I, ALT remained below 1,000 U/L, there was a bile production > 40 mL/day, and coagulation improved. In a grade II, initial ALT level exceeded 1,000 U/L, but fell over the subsequent 48 h with improved coagulation and bile flow > 40 mL/day. In a grade III, ALT overcame 2,500 U/L for the first 48 h, bile production was reduced (< 40 mL/day), and coagulopathy was more severe. In grade IV, there were a rapid rising of ALT levels with no bile production and severe coagulopathy. Primary outcome was considered positive for patients showing grade I-II (good graft function) or negative in patients with grade III-IV (poor graft function).
Statistical analysisDescriptive statistics (means ± standard deviations or numbers) were used for patients’ characteristics: student t test or Fisher test were used on absolute values to compare patients with poor graft function and those with good graft function. Student’s t-test was used to determine the difference in all parameters between the two groups. A paired intragroup t test of Pr-aCO2 at T1 vs. T2 was performed. Statistical significance for the inclusion of variables in the regression model was considered at the 0.05 level. Logistic regression was used to determine possible predictors for negative outcome (poor graft function). Post-regression analysis on sensibility and specificity was run. Cut-off of ΔPr-aCO2 was calculated establishing a sensitivity > 0.9. In addition, Pearson correlation with Bonferroni correction was used to determine the relationship between ΔPr-aCO2 and serum transaminase peak value (ALT) at 72h after LT.
Statistical analysis was carried out using Statistica Version 6.1 software (StatSoft, Tulsa, Oklahoma, USA) and Epi Info™ Version 3.4 (Atlanta, Georgia, USA).
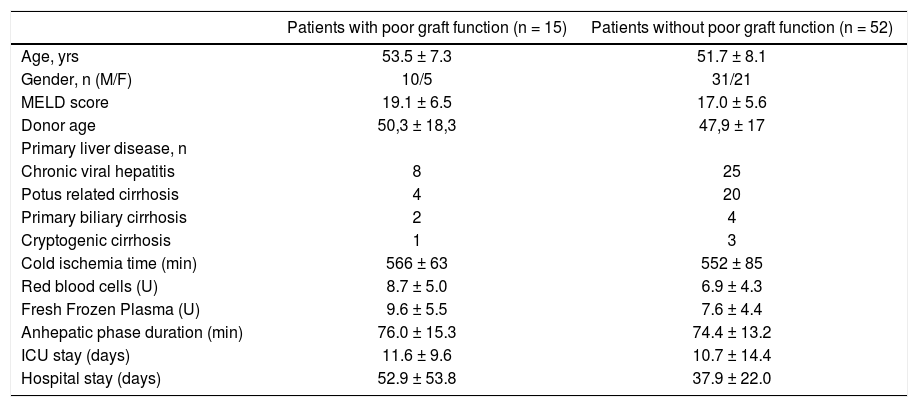
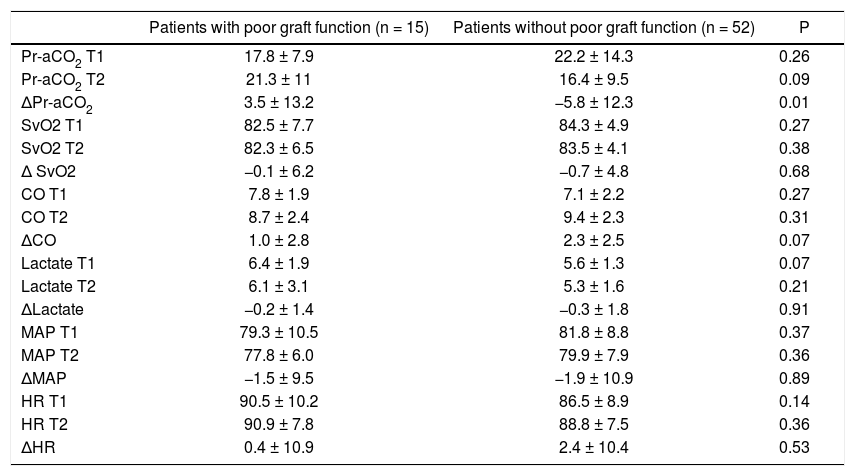
ResultsFifteen patients presented poor graft function with one patient showing grade 4 and 14 patients experiencing grade 3 of Toronto classification and fifty-two had a good graft recovery. There were not differences between the two groups regarding preoperative characteristics (Table 1). Only one patient was excluded for a very large Pr-aCO2 at the beginning of surgery, reasonably due to a lack of fasting. The main tonometric, hemodynamic and metabolic intraoperative results are summarized in table 2.
Demographic characteristics of the patients with and without poor graft function.
| Patients with poor graft function (n = 15) | Patients without poor graft function (n = 52) | |
|---|---|---|
| Age, yrs | 53.5 ± 7.3 | 51.7 ± 8.1 |
| Gender, n (M/F) | 10/5 | 31/21 |
| MELD score | 19.1 ± 6.5 | 17.0 ± 5.6 |
| Donor age | 50,3 ± 18,3 | 47,9 ± 17 |
| Primary liver disease, n | ||
| Chronic viral hepatitis | 8 | 25 |
| Potus related cirrhosis | 4 | 20 |
| Primary biliary cirrhosis | 2 | 4 |
| Cryptogenic cirrhosis | 1 | 3 |
| Cold ischemia time (min) | 566 ± 63 | 552 ± 85 |
| Red blood cells (U) | 8.7 ± 5.0 | 6.9 ± 4.3 |
| Fresh Frozen Plasma (U) | 9.6 ± 5.5 | 7.6 ± 4.4 |
| Anhepatic phase duration (min) | 76.0 ± 15.3 | 74.4 ± 13.2 |
| ICU stay (days) | 11.6 ± 9.6 | 10.7 ± 14.4 |
| Hospital stay (days) | 52.9 ± 53.8 | 37.9 ± 22.0 |
The values are mean ± standard deviation or numbers. No significant differences were found between the groups.
Main intraoperative parameters at the investigated time points and difference between T2 and T1 (Δ) in patients with and without poor graft function.
| Patients with poor graft function (n = 15) | Patients without poor graft function (n = 52) | P | |
|---|---|---|---|
| Pr-aCO2 T1 | 17.8 ± 7.9 | 22.2 ± 14.3 | 0.26 |
| Pr-aCO2 T2 | 21.3 ± 11 | 16.4 ± 9.5 | 0.09 |
| ΔPr-aCO2 | 3.5 ± 13.2 | −5.8 ± 12.3 | 0.01 |
| SvO2 T1 | 82.5 ± 7.7 | 84.3 ± 4.9 | 0.27 |
| SvO2 T2 | 82.3 ± 6.5 | 83.5 ± 4.1 | 0.38 |
| Δ SvO2 | −0.1 ± 6.2 | −0.7 ± 4.8 | 0.68 |
| CO T1 | 7.8 ± 1.9 | 7.1 ± 2.2 | 0.27 |
| CO T2 | 8.7 ± 2.4 | 9.4 ± 2.3 | 0.31 |
| ΔCO | 1.0 ± 2.8 | 2.3 ± 2.5 | 0.07 |
| Lactate T1 | 6.4 ± 1.9 | 5.6 ± 1.3 | 0.07 |
| Lactate T2 | 6.1 ± 3.1 | 5.3 ± 1.6 | 0.21 |
| ΔLactate | −0.2 ± 1.4 | −0.3 ± 1.8 | 0.91 |
| MAP T1 | 79.3 ± 10.5 | 81.8 ± 8.8 | 0.37 |
| MAP T2 | 77.8 ± 6.0 | 79.9 ± 7.9 | 0.36 |
| ΔMAP | −1.5 ± 9.5 | −1.9 ± 10.9 | 0.89 |
| HR T1 | 90.5 ± 10.2 | 86.5 ± 8.9 | 0.14 |
| HR T2 | 90.9 ± 7.8 | 88.8 ± 7.5 | 0.36 |
| ΔHR | 0.4 ± 10.9 | 2.4 ± 10.4 | 0.53 |
There were not significant differences for MAP, HR, SvO2, CO and lactates in patients with and without poor graft function (Table 2); also Pr-aCO2 data do not reach a statistically significant difference between the two groups either at T1 or at T2. On the contrary, the difference of Pr-aCO2 between T2 and T1 (T2-T1 = ΔPr-aCO2) was significant (as seen in table 2, t test demonstrated that there was an effect of poor graft function for ΔPr-aCO2 [T(df) = −2.5 (65); p = 0.014]). A paired intra-group t test of Pr-aCO2 at T1 vs. T2 showed a significant difference in patients without poor graft function [T(df) = 3.4 (51); p = 0.001] and no differences in patients with poor graft function [T(df) = -1.0 (14); p = 0.32].
Logistic regression showed that ΔPr-aCO2 was able to predict poor graft function [Model Log-Likelihood (LR χ2; p) = 31.8 (7.62; p < 0.006); OR = 1.1; CI = 1.0-1.2; SE = 0.46; Z: 2.09; p = 0.037)]. Post regression ROC analysis showed an area under ROC curve of 0.71 (Figure 1). A cut-off value of ΔPr-aCO2= −4 was found with a sensibility of 93.3% and a specificity of 42.3%. A negative predictive power of 96% for ΔPr-aCO2 value < −4 (one false negative and 22 true negative) and a positive predictive power of 32% for ΔPr-aCO2 value ≥ −4 (14 true positive and 30 false positive) were found (Figure 2). The values distribution in a 2 × 2 contingency table using Fisher’s exact test was significant (p = 0.008).
 for outcome (poor graft function). The area under the curve (AUC) showed a moderate correlation (< 0.75) between ΔPr-aCO2 and poor graft function.")
 with (1) and without (0) poor graft function for each value of ΔPr-aCO2.")
Moreover, a positive correlation was also found between ΔPr-aCO2 and the peak of ALT after LT (r = 0.45; p = 0.015).
DiscussionThe main result of this study is that the patients with poor graft function showed a ΔPr-aCO2 significantly greater than the patients without poor graft function; this means that patients with poor graft function had not a significant improvement in Pr-aCO2 at the end of the surgery. A poor reperfusion of the graft, with consequent limitation of blood flow through the liver, could be the reason for this lack of improvement, in absence of significant macrohemodynamic changes. The significant relationship between ΔPr-aCO2 and the peak of ALT seems to confirm this hypothesis.
Moreover, a ΔPr-aCO2 value = − 4 proved to be a cut off for poor graft function occurrence, with a sensibility of 93.3% and a specificity of 42.3%. This high sensibility as well as weak specificity is in line with previous researches.20 In this study, patients had a high probability of absence of poor graft function after LT (PPN = 96%) when ΔPr-aCO2 was < − 4. On the contrary, poor graft function cannot be predicted by a ΔPr-aCO2 value ≥ − 4 (PPP = 32%).
As previously stated, ΔPr-aCO2 between the anhepatic phase and the end of the surgery was used in order to evaluate the effect of the graft, as the trend of Pr-aCO2, and not a single value, may better reflect splanchnic perfusion.21 In this context, the time point at the late anhepatic phase was chosen in order to consider only recipient parameters just before graft reperfusion.22 In our opinion, the difference between Pr-aCO2 at the end of the surgery (T2) and before graft reperfusion (T1) may reflect changes in splanchnic perfusion related to the presence of new liver.
In our data set, Pr-aCO2 values at the end of anhepatic phase as well as at the end of the surgery showed a moderate hypoperfusion, even if no signs of hypoxia have been detected. These results are in keeping with other studies that demonstrated a reduction of blood flow without hypoxia in cirrhotic patients undergoing LT.11
Pr-aCO2 may be a good marker of the adequacy between local blood flow and metabolism because the main determinant for Pr-aCO2 is the blood flow; in this way, Pr-aCO2 values between 8-25 mmHg should be read as moderate hypoperfusion without hypoxia.13
Moreover, experimental results yielded the anaerobic threshold in metabolism at a Pr-aCO2 of 25-35, even if only at higher values a clinician may be sure of critical flow reduction with consequent tissue hypoxia.13 Clinically, a Pr-aCO2 below 25 should be considered as the target to avoid hypoperfusion and hypoxia,13 even though no study could confirm that a goal direct study, aimed at a narrow Pr-aCO2, may improve patient outcome.
In this study, none of the hemodynamic and metabolic parameters showed a significant relationship with the early outcome of the graft. This finding is in keeping with that of Mandli, et al.,7 who demonstrated that systemic parameters cannot reflect regional circulation and recovery of the graft, at least in the early period after reperfusion.
Therefore, gastric tonometry, even if with its well known limits, might give further valuable insight into splanchnic circulation and graft status; this very early prognostic information might aid clinicians in planning a more strict follow-up to improve graft survival.
This study suffers from some limitations. First of all, the study was performed on an observation basis, while a randomized goal direct study would have been more relevant.
Additionally, hepatic blood flow was not measured intraoperatively by means of Doppler, in order to confirm the hypothetical hypoperfusion.
ConclusionOur study suggests that the change of Pr-aCO2between anhepatic phase and end of surgery may be a good predictor of poor graft recovery, with high sensitivity but weak specificity; larger prospective studies are requested to confirm our results.


