


Background. Available prognostic scores for mortality after acute variceal bleeding are mainly based on logistic regression analysis but may have some limitations that can restrict their clinical value.
Aims. To assess the efficacy of a novel prognostic approach based on Classification and Regression Tree-CART-analysis to common easy-to-use models (MELD and Child-Pugh) for predicting 6-week mortality in patients with variceal bleeding.
Methods. Sixty consecutive cirrhotic patients with acute variceal bleeding. CART analysis, MELD and Child-Pugh scores were performed to assess 6-week mortality. Receiver operating characteristic (ROC) curves were constructed to evaluate the predictive performance of the models.
Results. Six-week rebleeding and mortality were 30% and 22%, respectively. Child-Pugh and MELD scores were clinically relevant for predicting 6 weeks mortality. CART analysis provided a simple algorithm based on just three bedside-available variables (albumin, bilirubin and in-hospital rebleeding), allowing accurate discrimination of two distinct prognostic subgroups with 3% and 80% mortality rates. All MELD, Child-Pugh and CART models showed excellent and comparable predictive accuracy, with areas under the ROC curves (AUROC) of 0.88, 0.84 and 0.91,respectively.
Conclusions. A simple CART algorithm combining albumin, bilirubin and in-hospital rebleeding allows an accurate predictive assessment of 6-week mortality after acute variceal bleeding.
Variceal bleeding is a major complication of portal hypertension and the leading cause of death in patients with cirrhosis.1-3 After an episode of variceal bleeding, rebleeding and mortality rates rise during the first 6 weeks and then tend to stabilize.1,4Over the last two decades, new developments in diagnostic and therapeutic techniques for the management of the acute episode and during the ensuing critical 6-week window have led to an improvement in the prognosis of this serious complication.5-7 However, mortality rates in these patients still remains markedly high (17-20%) within this 6-week period.6,8-10
Prognostic indicators of mortality within the 6-week period following an episode of acute variceal bleeding have been proposed in different studies.8,10,11 These estimates are based on statistical models inferred from cohort data with methods such as logistic regression or Cox proportional analyses. On the other hand, studies assessing the efficiency of Child-Pugh and MELD scores in predicting mortality of any cause in cirrhotic patients with variceal bleeding have also been published.12-15 The use of these methods is based on their accuracy and their ease-of-use for the non-statistician. However, clinicians often find it challenging to integrate this prognostic information into the day to day clinical routine.
Recently, alternative statistical methods, such as Classification And Regression Tree (CART) analysis, are being explored and evaluated for risk prediction in medical domains. Different studies have so far shown the utility of this method in the accurate prognostic models in the distinct medical areas.16-20 However, Child-Pugh, MELD and CART have not been applied together in a common patient dataset. CART analysis for short and long-term survival has only been reported in two preliminary-data studies for prognostic assessment of bleeding cirrhotic patients.21,22
These considerations led us to conduct a retrospective study in a single centre cohort of patients in a clinical practice setting to asses 6-week mortality after an acute variceal bleeding. Moreover, we performed a prognostic analysis of mortality in the series and evaluated the efficiency of Child-Pugh, MELD and regression trees (based on CART analysis).
Patients and MethodsPatientsAll consecutive episodes of esophageal variceal bleeding (EVB) in patients with liver cirrhosis admitted to the Emergency Gastroenterology Unit of the Hospital Juárez de México, Mexico City, México, from January 2006 to January 2007 were prospectively collected. Patients with hepatocellular carcinoma, aged > 80 years, had infection documented at entrance or suspicion of infection during the first 24 hrs after hospital admission and non-cirrhotic EVB or bleeding from sources other than esophageal varices (e.g., gastric varices, peptic ulcers, postvariceal ligation scars or portal gastropathy) were not included in the study. Baseline and follow-up clinical and biochemical characteristics, as well as the use of initial pharmacological therapy were recorded. All biochemical and clinical variables of patients were used for calculations of Child-Pugh and MELD scores at admission. MELD score was calculated with the following formula: MELD = 9,57Ln(Creatinine) + 3,78Ln(Bilirrubin) C 11,2 Ln(INR) C 6,43.
Cirrhosis was diagnosed on basis of previous liver biopsy or by a combination of the usual clinical, biochemical and radiological criteria. The time of inclusion was determined as the moment of admission to the Emergency Gastroenterology Unit (Bleeding unit) of our centre. Patients were followed until day 42 (6 weeks) or until their death.
The protocol was approved by the ethics committee of our institution, and all patients or near relative (when patient was unable) gave a written informed consent.
TreatmentsAll patients included in the study received oral prophylaxis with norfloxacin PO 400 mg every 12 h for 7 days, at admission to the bleeding unit. An initial endoscopy was performed within the first 12 h [median time 62-10 h] after admission, and endoscopic variceal ligation (EVL) was conducted in all cases. A Sengstaken-Blakemore tube was placed as a bridge to a new endoscopy when indicated. Pharmacological vasoactive therapy was performed with octreotide 50 μg IV bolus followed by continuous infusion of 50 μg/h for 5 days, this therapeutic measure was started immediately after admission to the bleeding unit. The pharmacological therapy was only performed in patients with the financial ability to purchase it.
Secondary prophylaxis was initiated in surviving patients passing the 5-day period. Oral propranolol was started at 40 mg/day and subsequently increased until intolerance appeared, the heart rate decreased below 55 beats per minute or a reduction in at least 25% of the baseline heart rate was observed. All patients underwent EVL at 2-to-3-week intervals until variceal eradication was achieved. In addition, patients who were on pharmacological therapy before bleeding had EVL added to the prophylactic regime.
DefinitionsBleeding from variceal source was considered if the initial endoscopy showed any of the signs of variceal haemorrhage according to Baveno Consensus Workshop criteria.23 Uncontrolled bleeding was defined as any bleeding from esophageal varices that persisted despite intensive endoscopic treatment (e.g. more than 2 therapeutic endoscopy procedures), balloon tamponade when indicated or death. Rebleeding was defined as a new hematemesis or melena after a period of 24 h of stable vital signs and haemoglobin levels, as defined in Baveno Consensus Workshop.23 In-hospital bleeding was defined as the presence of hematemesis or melena with signs of hemodynamic instability during hospitalization. Mortality was defined as death resulting from any cause, occurring within 42 days after admission. Criteria of hemodynamic instability included a systolic blood pressure < 100 mmHg, pulse rate > 100 bpm and/or the presence of clinical signs of peripheral hypoperfusion. Criteria of bacterial infection included: fever > 37.5° during more than 12 hours; spontaneous bacterial peritonitis: ascitic fluid polymorphonuclear count equal to or greater than 250/ mm3; positive blood cultures; urinary tract infection; and/or pneumonia on chest x-ray. Other infections were diagnosed according to clinical, radiological and bacteriologic data.
Statistical analysisContinuous variables were described as median within 25-75 interquartile range and compared using Student’s t test or Mann-Whitney U test, as appropriate, depending on their normality test. Differences between categorical variables were assessed by Fisher’s exact test or the chi-square test with Yeat’s correction for continuity, when necessary. A p value of < 0.05 was required for statistical significance.
Three different techniques were used for prognostic assessment of mortality and rebleeding at 6-week period. First, the performance of Child Pugh and MELD scores at entrance were evaluated by measurement of their discriminative ability, estimated by the concordance c-statistic (AUROC). An AUROC value of > 0.70 was considered clinically relevant. The SPSS statistical package (SPSS Inc., version 15.0, Chicago, IL, USA) was used for these calculations. Second, for CART analysis we used the CART Pro v6.0 software (Salford systems, San Diego, CA, USA), based on the original Breinman’s code. Briefly, the method allows the construction of inductive decision trees through strictly binary splitting. This algorithm divides each parent node into two homogeneous child nodes by applying yes/no answers at each decision node. The basic tree-generating or “learning” process consists of:
- 1.
Selecting the most discriminative variable according to an impurity function to partition the data
- 2.
Repeating this partition until child nodes are considered pure enough to be terminal
- 3.
Pruning the resulting tree to avoid overfitting and redundancy. In our study, sensitivity analysis was based on the Gini index, and 10-fold cross validation was performed to assess internal validity
Misclassification costs were set at 1.0. The number of patients in terminal nodes was set to a minimum of 20 and no specific splitters were forced for root or children nodes. Cut-off points for continuous and categorical variables were automatically generated by the model based on statistical cost assumptions. Optimal trees were then selected according to their relative misclassification costs, predictive accuracy and clinical relevance.
Finally, a receiver operating characteristic (ROC) curve was constructed with the CART model and statistical differences between scores were assessed comparing the AUROC values by means of the Z test using MEDCALC software (Version 10.0.2 Mariakerke, Belgium).
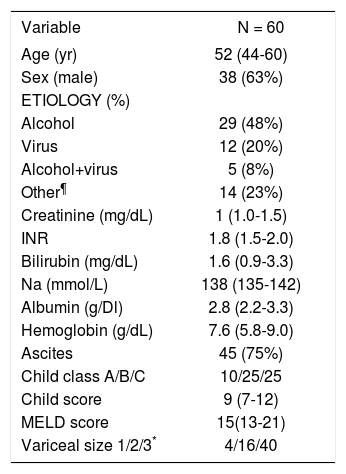
ResultsPatient features and treatmentDuring the 1-year period 75 consecutive patients with cirrhosis and gastrointestinal bleeding were received at our Bleeding Unit. Fifteen patients were excluded for several reasons: 6 HCC, 5 bleeding from other cause than EVB and 4 infections at entrance. Therefore 60 patients (38 men, 22 women) with EVB were analyzed. Basal demographic and clinical characteristics of patients at admission are shown in Table 1.
Baseline characteristics of patients admitted to the Gastroenterology Unit with esophageal variceal bleeding.
| Variable | N = 60 |
|---|---|
| Age (yr) | 52 (44-60) |
| Sex (male) | 38 (63%) |
| ETIOLOGY (%) | |
| Alcohol | 29 (48%) |
| Virus | 12 (20%) |
| Alcohol+virus | 5 (8%) |
| Other¶ | 14 (23%) |
| Creatinine (mg/dL) | 1 (1.0-1.5) |
| INR | 1.8 (1.5-2.0) |
| Bilirubin (mg/dL) | 1.6 (0.9-3.3) |
| Na (mmol/L) | 138 (135-142) |
| Albumin (g/Dl) | 2.8 (2.2-3.3) |
| Hemoglobin (g/dL) | 7.6 (5.8-9.0) |
| Ascites | 45 (75%) |
| Child class A/B/C | 10/25/25 |
| Child score | 9 (7-12) |
| MELD score | 15(13-21) |
| Variceal size 1/2/3* | 4/16/40 |
Summary statistics for quantitative variables are stated as median (interquartile range 25-75).
The most frequent etiology of cirrhosis was alcohol abuse (48%). Seventeen patients (28%) showed renal impairment at arrival to the hospital manifested by serum creatinine > 1.5 mg/dL. Clinically manifested hepatic encephalopathy (grade > 2) was present in 24 (40%). Infection of any cause developed during follow-up [median time 20 (4-30) days] in 20 of 60 patients (33%), the sites were: 12 spontaneous bacterial peritonitis, 4 urinary tract infection, 3 pneumonias and 1 from unknown cause with positive blood culture.
Active bleeding was found in 25 (42%) patients. Recent stigmata of variceal bleeding were seen in 31 (5l%), and 4 (7%) had blood in the stomach without any other source of bleeding. Median hospital stay was 9 (3-15) days. All patients underwent a diagnostic endoscopic procedure in order to confirm the variceal source of bleeding and EVL was performed in all cases. Pharmacological vasoactive therapy was used in 7 (12%) patients no adverse events were documented in these patients.
OutcomesWithin the 6-week follow-up period, 18 out of a total 60 patients (30%) suffered rebleeding and 13 patients (22%) died due to: 4 in-hospital rebleeding, 5 liver failure and 4 bacterial infection. The median time of presentation of in-hospital rebleeding was 4 (2-7) days. Kaplan-Meier plot showing survival cumulative proportions in the 6 week observation period for the whole cohort is presented in Figure 1.
. Kaplan-Meier plot showing the cumulative probability of survival in the 6-week period following an acute esophageal variceal bleeding for the whole cohort (60 patients).")
The first endoscopy procedure was effective in controlling active bleeding in 92% of cases, in cases where endoscopy could not control active bleeding, a Sengstaken Blakemore tube was placed and a second therapeutic endoscopy was done during the next 24 hrs. No major adverse events were documented during therapeutic endoscopy procedures. Among the 52 (87%) patients who survived the bleeding episode and could be discharged, all received therapy for secondary prophylaxis of variceal bleeding.
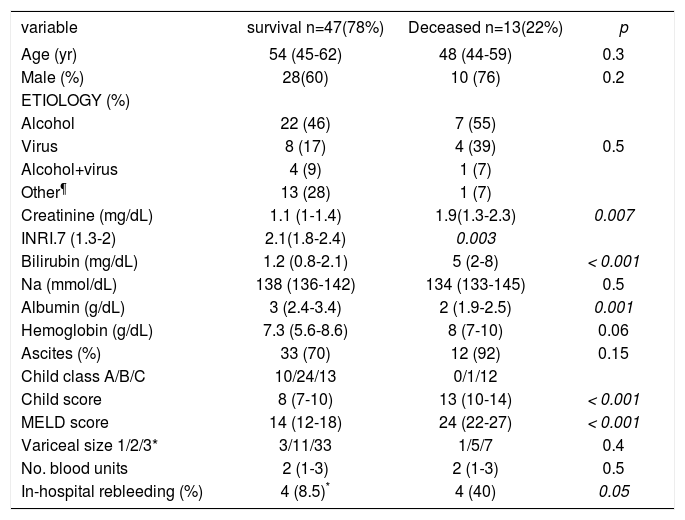
prognostic scoresTo evaluate the efficiency of scores in terms of 6 weeks mortality ROC curves were constructed for MELD and Child-Pugh scores, both with clinically relevant (0.88 IC 95% 0.78-0.99, 0.84 CI 9S% 0.73-0.95, respectively) AUROC. For cohort analysis, we performed 2 groups in relation to survival. After comparison of the groups (Table 2) the most relevant clinical and biochemical variables were directly introduced in CART analysis. The best decision tree (Gini´s index 0.35) was constructed with 2 biochemical (albumin and total bilirubin) and I clinical (in-hospital rebleeding) variables which were the best scores (Figure 2). The best cut-off points for biochemical variables were 2.85 g/dL for albumin and 3.95 mg/bL for bilirubin. The CART model also shown a significant AUROC (0.91 CI 95% 0.82-0.99). The first split in the CART model was with albumin showing a 97% of survival in those with levels above the cut-off point. For the second and third splits those patients for whom the level of bilirubin were > 3.95 mg/dl or in-hospital rebleeding was documented, mortality rates were 80%. When comparing the efficacy of constructed ROC curves for CART, MELD and Child-Pugh we found no statistical differences (Figure 3).
Comparison of relevant characteristics of patients according to mortality within 6 weeks.
| variable | survival n=47(78%) | Deceased n=13(22%) | p |
|---|---|---|---|
| Age (yr) | 54 (45-62) | 48 (44-59) | 0.3 |
| Male (%) | 28(60) | 10 (76) | 0.2 |
| ETIOLOGY (%) | |||
| Alcohol | 22 (46) | 7 (55) | |
| Virus | 8 (17) | 4 (39) | 0.5 |
| Alcohol+virus | 4 (9) | 1 (7) | |
| Other¶ | 13 (28) | 1 (7) | |
| Creatinine (mg/dL) | 1.1 (1-1.4) | 1.9(1.3-2.3) | 0.007 |
| INRI.7 (1.3-2) | 2.1(1.8-2.4) | 0.003 | |
| Bilirubin (mg/dL) | 1.2 (0.8-2.1) | 5 (2-8) | < 0.001 |
| Na (mmol/dL) | 138 (136-142) | 134 (133-145) | 0.5 |
| Albumin (g/dL) | 3 (2.4-3.4) | 2 (1.9-2.5) | 0.001 |
| Hemoglobin (g/dL) | 7.3 (5.6-8.6) | 8 (7-10) | 0.06 |
| Ascites (%) | 33 (70) | 12 (92) | 0.15 |
| Child class A/B/C | 10/24/13 | 0/1/12 | |
| Child score | 8 (7-10) | 13 (10-14) | < 0.001 |
| MELD score | 14 (12-18) | 24 (22-27) | < 0.001 |
| Variceal size 1/2/3* | 3/11/33 | 1/5/7 | 0.4 |
| No. blood units | 2 (1-3) | 2 (1-3) | 0.5 |
| In-hospital rebleeding (%) | 4 (8.5)* | 4 (40) | 0.05 |
Summary statistics for quantitative variables are stated as median (interquartile range 25-75).
: Grade I, varices flattened by insuflation; grade 2, varices not flattened by insuflation and separated by areas of normal mucosa; grade 3, confluent varices not flattened by insuflation. ¶Autoimmune and cryptogenetic etiologies. Abreviations: Na: Sodium. INR: International Normalized Ratio. MELD: Model for End Stage Liver Disease.

 of prognostic models for 6-week mortality obtained by CART analysis, and for Child-Pugh and MELD scores. CART: Classification and Regression Tree Analysis. MELD: Model for End Stage Liver Disease.")
In this study we analysed the clinical outcomes of a single-centre cohort of patients after acute variceal bleeding in day-to-day clinical practice. The main intention was to propose a novel and alternative prognostic approach to the assessment of 6-week mortality in this setting. The data of the present study clearly confirms an improvement in the outcome of patients with acute variceal bleeding in recent years compared to historical cohorts. The 22% six-week mortality rate in our study (excluding cases of HCC) is markedly lower than the 60% of the seminal study by Graham and Smith1 and similar to that of more recent and well conducted studies.6,8-10
Recently, some studies have compared Child-Pugh and MELD scores in cirrhotic patients with variceal bleeding. All of them documented a similar capability of Child-Pugh and MELD scores for predicting mortality12-14 Flores-Rendón AR, et al. has recently show the superiority of MELD versus CP for predicting in-hospital bleeding-related mortality in a retrospectively study. However, in the analysis of overall mortality no differences were encountered.15 Our results are concordant with these regarding in the point that no substantial differences for predicting 6-week mortality with this 2 prognostic scores were found. Moreover, the results of our analysis also reinforce the relevance of well-known risk factors (Child-Pugh and MELD score and occurrence of early in-hospital rebleeding), which are essentially related to basal patient liver function and their global clinical status.
Perhaps, the most original feature of our study is the use of CART analysis for the mortality prognostic assessment in a cohort of cirrhotic patients. An intuitive decision tree (Figure 2), based on the combined use of just three variables (albumin, bilirubin, in-hospital rebleeding), usually available at patient bedside, allowed an early discrimination of two prognostic subgroups with clearly distinct mortality after an episode of variceal bleeding. First, a low-risk group (all patients with albumin > 2.85 g/dL) is associated with an excellent overall 6-week survival (97%), independent of other prognostic factors, and for whom more aggressive therapeutic measures probably may not be needed. Second, patients with levels of albumin ≤ 2.85 g/dL and bilirubin ≤ 3.95 mg/ dL or who develop an in-hospital rebleeding episode would be included in the high-risk group (80% of 6-week mortality, respectively).
This is of great potential value, in order to inform difficult decisions on daily clinical practice (such as which patients should undergo a more aggressive diagnostic or therapeutic management), physicians tend to classify patients into risk groups (e.i. low/high risk). In the other hand, for the design of controlled trials, an accurate prognostic assessment is required in order to identify uniform subgroups of patients as adequate targets for therapies.
For these aims, either the straightforward knowledge of risk factors and their odd ratios (as provided by logistic regression analysis) or an exhaustive stratified analysis may reveal insufficient, especially when the outcome of interest is determined by many different variables, as in the case of variceal bleeding. As an example, it has already been suggested by post-hoc analysis of two-way interactions in different studies3,8,9 that the prognosis after variceal bleeding depends on the degree of liver dysfunction. However, the order, relative strength and interactions of the components of the scores for measuring the degree of liver dysfunction that mainly affect the prognosis of EVB are unclear with available published data.
Moreover, CART analysis do not only identify the most relevant prognostic variables, also the visual structure of trees helps us to understand the hierarchy of the variables, uncovers the interactions between them and highlights local covariate effects (i.e., different effects of the variable in different subgroups of patients).17-20 The CART model in our study clearly demonstrates how albumin ranks first in our cohort of patients followed by bilirubin levels.
An important point to highlight is the third split of our model in where in-hospital rebleeding plays the final role for stratification of patients with high mortality.
This, perhaps is the most important flaw of the model, and could lead to reduce its predicting accuracy; taking into account that prognosis could change day to day. Therefore, in order to elucidate which factors were related to rebleeding and subsequently a high risk for 6-week mortality we perform a sub-analysis of those patients included in the second “split” (n = 20). Among patients with albumin ≤ 2.85 and bilirubin ≤ 3.95 mg/dL the only variable associated with in-hospital rebleeding was creatinine (HR 24.2; IC 1.24-414.12, p = 0.24) nor number of infunded blood units or other liver dysfunction parameters were significant. Creatinine showed good performance for this purpose with an AUROC of 0.83 (IC 0.64-1.22) as a single variable. The best cut-off point was 1.6 mg/dL (sensitivity 80%, specificity 88%). These results are in keeping with previous findings in were renal failure has been catalogued as a prognostic indicator for 6-week mortality and rebreeding.8,24 The importance of this specific point is related to the lack of data about the relevance of creatinine among patients with the worst liver function. We found creatinine as the only determining factor of variceal rebleeding and subsequent death in this setting. Importantly, creatinine otherwise bilirubin and albumin could be a modifiable factor and a future therapeutic target for the early prognosis of patients with poor liver function and EVB.
Additionally, CART analysis is based on the original Breinman´s code and construction of decision trees are generated by binary splitting. We have to state that no forced splits were applied to allow its intuitive performance and because CART automatically select and rank the most discriminative variables according their relevance for a determinate outcome.20
In the other hand, our CART-model shows an excellent overall predictive ability with an AUROC of 0.91 (CI 95% 0.82-0.99). Nevertheless, although CART performs an automatic internal cross-validation for every tree, further studies using different datasets would be required to test the external validity of the model, in view of the established difficulty of transferring prognostic models.25
Finally, it should be noted that the comparison of ROC curves showed the global predictive performance of CART in our cohort is statistically non inferior to that of Child-Pugh and MELD scores. We propose using this CART model as an easy algorithm with 3 simple questions in a determined clinical situation as a reproducible option in day-to-day clinical practice. Moreover, this CART analysis allows us to properly stratified subgroups of risk without the subjectivity of some variables of Child-Pugh (e.g. ascites and encephalopathy) or the need of a device for complex calculations such as MELD.
Certainly, this study has some limitations; first, we did not primary assess in multivariate analysis the influence of other important and controversial variables in the outcome of this patients (e.g. infection or coagulation factors). Regard this point we have to mention that patients in our cohort were excluded if they shown signs of infection at admission and, if during the first 24 hrs of hospitalization were any analytic or clinical suspicion of sepsis. Moreover, when evaluating the role of infection in our patients we did not found significantly association with mortality (p = 0.5) in the univariate analysis. Second, patients with gastric variceal bleeding, portal gastropathy or HCC were not included in analysis. This, in order to make more pure our analysis to evaluating cirrhotic patients with EVB. On the other hand, several studies have previously shown the negative impact of HCC in the outcome of patients with EVB.11-13 Third, a lack of a split or external validation of this CART model is given for sample size reasons.
In summary, our study confirms an improvement in the prognosis of these patients compared to historical cohorts. For the prognostic assessment of 6-week mortality after acute variceal bleeding, we propose a novel and easy-to-use approach based on the combination of two biochemical variables and one clinical variable which is not inferior of commonly used models. Additionally, in patients with poorer liver function we found creatinine as the only variable associated to development of in-hospital rebleeding and subsequently high risk of death. There is a need for further larger, prospective and well validated studies in order to confirm our findings.
Funding- •
José Altamirano is a recipient of the fellowship grant “Estímulo Héctor Orozco Zepeda 2007” from FUNSALUD, A.C., FUNDACIÓN AMPARO and FUNDHEPA, A.C., Mexico
- •
Salvador Augustin is a recipient of a fellowship grant from the Institut de Recerca Vall d´Hebron/La Caixa, and is enrolled in the postgraduate program of the Universitat Autònoma de Barcelona


