


Many scoring systems in liver diseases use static values of liver function parameters. These parameters may change significantly in liver transplant (LTx) recipients over time due to various processes. The study was aimed at building a new model for survival prediction after LTx based on variability of selected parameters.
Materials and methodsThe study included 450 LTx recipients who survived a minimum one year after transplantation. We analyzed liver enzymes and hematology parameters static values and their variability during the first year after transplantation. Modeling patients’ survival was performed using Cox regression. Various sets of parameters (both static and variability and trends values) were tested to predict survival in our study group. Models’ performance was measured using the concordance index.
ResultsThe single predictors of the patients survival were the static values of AST with C-index 0.706 (0.5883–0.7494), ALT 0.6102 (0.4843–0.6857) and bilirubin 0.6224 (0.5537–0.6695). High prediction scores were observed for variability in creatinine 0.6023 (0.5409–0.6451), PLT 0.6350 (0.5491–0.7043), RBC 0.5689 (0.5065–0.6213) and WBC 0.6506 (0.5095–0.7124). Our best-fitted and proposed model for patients survival after LTx has C-index 0.8273 (IQR 0.7767–0.8649). The model uses the following indicators for mortality prediction: the static value of AST, variability measure of PLT and trend measures of WBC and PLT.
ConclusionsAdding variability and trend measures increases predictive accuracy in modeling patients survival after LTx. We propose a high-accuracy survival model in which variability and trend of PLT measures in the first year after transplantation are strong predictors of long-term mortality.
Several simple models based on lymphocytes and platelets count and basic biochemical parameters have been reported as predictors of liver inflammation, fibrosis, and survival in viral hepatitis, hepatectomy and liver transplantation [1–3]. Currently, all popular scoring systems related to liver diseases are composed of static values exclusively. All known parameters reflecting liver function may change significantly in liver transplant (LTx) recipient over time due to various processes like acute graft rejection, cholestasis, infections, etc.
We believe that by using only static measurements, we lose useful information on variability and trend of observations during the examined period. This information could be useful in improving survival modeling. Recently some researchers showed that variability of various vital and biochemical measurements has an impact on patients’ survival in many diseases [4–6], but it is still relatively uncommon to focus on these kind of parameters.
The first aim of our study was to verify whether measurements of variability and/or trend of selected biochemical parameters during the first year after LTx improve modeling of long-term survival prediction of the recipients. The second aim was to propose a new model for survival prediction after LTx.
2MethodsPatient selection. The retrospective cohort study covers patients who received LTx between 2000 and 20015 and were treated at transplant department. The study protocol has been approved by the Ethics Committee and it conforms to previsions of the Declaration of Helsinki.
We included patients who fulfill the design experiment criteria, i.e., survived a minimum one year after LTx and have available data from a minimum of five outpatients’ visits in the first year after transplant in the electronic database. Lab results obtained before 2010 were entered manually and after that were downloaded by automatic lab system to the patient's database. Blood for the tests was taken during patients ambulatory visits. Results of liver function tests’: alanine transaminase (ALT), aspartate transaminase (AST), bilirubin, and creatinine, hemoglobin (HGB), platelets (PLT), white blood cells (WBC) chosen for the analysis were available for each patient visit.
Static, variability and trend measures. We have selected parameters representing variability, trend and a static value for observations of each biochemical measurement in the first year after LTx. Static values, which are most commonly used in the literature, are represented by the last observation in the period. The alternative measures possible for static value are mean and median, but we found no significant differences between them. Variability could be represented in various ways, such as variation, standard deviation, the difference between maximum and minimum values. Inspired by the study by Bangalore et al. [7], we have chosen successive average variability as the primary variability measure, which is defined as the average absolute difference between successive values of observations. We have found that the choice of particular variability measure does not have any significant impact on models performance. Finally, the trend measure was represented by the tangent of the regression line over observations.
In order to reliably represent variability and trend measures, each patient in the scope of the analysis had to have a minimum number of observations. Theoretically, the trend can be measured with only two observations and variability – with 3. However, in practice including patients with such a small number of observations leads to unstable and unreliable models. Our choice of a minimum of five observations provided stable and reliable results in our modeling. Naturally, the higher the number of observations, the better, but increasing the required minimum also limits the number of patients who fulfill the criteria, so the smallest acceptable number was chosen.
Statistical analysis. The statistical analysis was performed in R software, version 3.4.3 (R Foundation for Statistical Computing, Vienna, Austria). A significance value of 0.05 was considered in all statistic tests. Modeling patients’ survival was performed using Cox regression.
Validation methodology. All models were tested for their performance on the unseen data using bootstrapping. Bootstrapping is a statistic method aimed at measuring estimating properties of an estimator using a strategy of random sampling with replacement. Performance was measured with the concordance index (C-index) [8], which determines models discriminatory power. We used Uno's C formula which allows to reliably compare between models built on various subsets of patients [9]. To correct for results optimism and obtain confidence intervals for C-index, bootstrapping was repeated 100 times for each model.
Predictor selection. For predictor selection, we used a forward stepwise selection method where added variables are characterized by the biggest increase of average C-index calculated in internal validation. The advantage of this method is receiving the final model with the low number of predictors which provide the biggest impact on the model's overall predictive power. Low number of variables in models also increases their applicability in medical practice and increases overall interpretability.
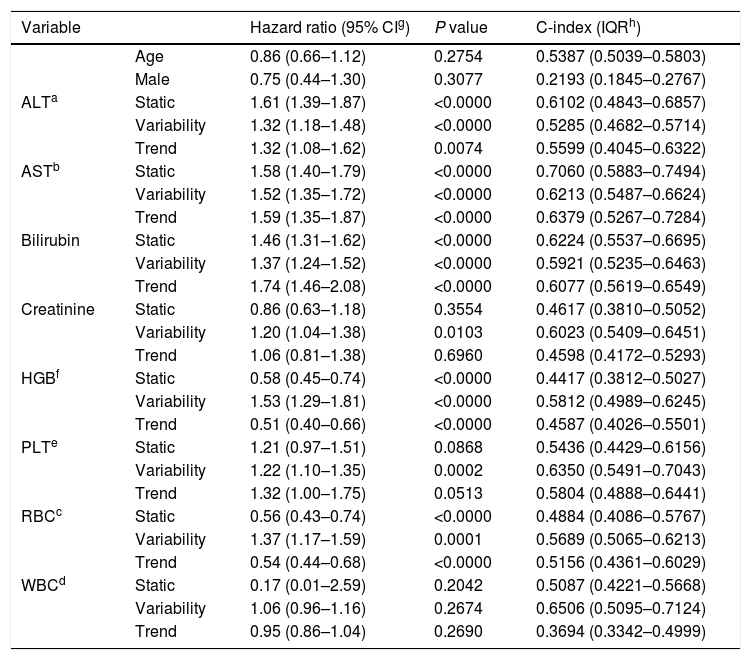
3ResultsThe study included 450 patients, 266 (59%) men and 184 (41%) women, mean age at transplantation was 46 (standard deviation; SD±13.1) years. The median observation time was 4 years while the median time to censoring was 2 years and 4 months. Univariate analysis’ results are presented in Table 1, the predictive accuracy of single variables is visualized in Fig. 1, and correlations between the predictors are visualized in Fig. 2. There was no strong correlation between selected predictors. The best single predictor was the static value of AST with C-index 0.706 (0.5883–0.7494). Higher prediction score for static values was observed also in ALT 0.6102 (0.4843–0.6857) and bilirubin 0.6224 (0.5537–0.6695). Higher prediction score for variability was observed for creatinine 0.6023 (0.5409–0.6451), PLT 0.6350 (0.5491–0.7043), RBC 0.5689 (0.5065–0.6213) and WBC 0.6506 (0.5095–0.7124). Various sets of parameters (both static and variability and trends values) were tested to predict survival in the study group. Our best-fitted and proposed model for patients survival after LTx is presented and explained in Table 2, with C-index 0.8273 (interquartile range; IQR 0.7767–0.8649).
Results of univariate analysis of variables as predictors of liver transplant recipients’ survival after transplantation.
| Variable | Hazard ratio (95% CIg) | P value | C-index (IQRh) | |
|---|---|---|---|---|
| Age | 0.86 (0.66–1.12) | 0.2754 | 0.5387 (0.5039–0.5803) | |
| Male | 0.75 (0.44–1.30) | 0.3077 | 0.2193 (0.1845–0.2767) | |
| ALTa | Static | 1.61 (1.39–1.87) | <0.0000 | 0.6102 (0.4843–0.6857) |
| Variability | 1.32 (1.18–1.48) | <0.0000 | 0.5285 (0.4682–0.5714) | |
| Trend | 1.32 (1.08–1.62) | 0.0074 | 0.5599 (0.4045–0.6322) | |
| ASTb | Static | 1.58 (1.40–1.79) | <0.0000 | 0.7060 (0.5883–0.7494) |
| Variability | 1.52 (1.35–1.72) | <0.0000 | 0.6213 (0.5487–0.6624) | |
| Trend | 1.59 (1.35–1.87) | <0.0000 | 0.6379 (0.5267–0.7284) | |
| Bilirubin | Static | 1.46 (1.31–1.62) | <0.0000 | 0.6224 (0.5537–0.6695) |
| Variability | 1.37 (1.24–1.52) | <0.0000 | 0.5921 (0.5235–0.6463) | |
| Trend | 1.74 (1.46–2.08) | <0.0000 | 0.6077 (0.5619–0.6549) | |
| Creatinine | Static | 0.86 (0.63–1.18) | 0.3554 | 0.4617 (0.3810–0.5052) |
| Variability | 1.20 (1.04–1.38) | 0.0103 | 0.6023 (0.5409–0.6451) | |
| Trend | 1.06 (0.81–1.38) | 0.6960 | 0.4598 (0.4172–0.5293) | |
| HGBf | Static | 0.58 (0.45–0.74) | <0.0000 | 0.4417 (0.3812–0.5027) |
| Variability | 1.53 (1.29–1.81) | <0.0000 | 0.5812 (0.4989–0.6245) | |
| Trend | 0.51 (0.40–0.66) | <0.0000 | 0.4587 (0.4026–0.5501) | |
| PLTe | Static | 1.21 (0.97–1.51) | 0.0868 | 0.5436 (0.4429–0.6156) |
| Variability | 1.22 (1.10–1.35) | 0.0002 | 0.6350 (0.5491–0.7043) | |
| Trend | 1.32 (1.00–1.75) | 0.0513 | 0.5804 (0.4888–0.6441) | |
| RBCc | Static | 0.56 (0.43–0.74) | <0.0000 | 0.4884 (0.4086–0.5767) |
| Variability | 1.37 (1.17–1.59) | 0.0001 | 0.5689 (0.5065–0.6213) | |
| Trend | 0.54 (0.44–0.68) | <0.0000 | 0.5156 (0.4361–0.6029) | |
| WBCd | Static | 0.17 (0.01–2.59) | 0.2042 | 0.5087 (0.4221–0.5668) |
| Variability | 1.06 (0.96–1.16) | 0.2674 | 0.6506 (0.5095–0.7124) | |
| Trend | 0.95 (0.86–1.04) | 0.2690 | 0.3694 (0.3342–0.4999) | |


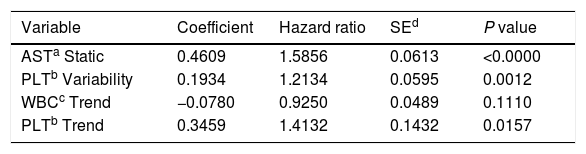
Proposed model for patients’ survival after liver transplantation. Model formula: hazard=base hazard * exp(0.4609 * AST Static+0.1934 * PLT Variability−0.0780 * WBC Trend+0.3459 * PLT Trend).
Model formula:hazard=base hazard*exp(0.4609*AST Static+0.1934*PLT Variability−0.0780*WBC Trend+0.3459*PLT Trend)
The model uses the following indicators for mortality prediction: the static value of AST, variability measure of PLT and trend measures of WBC and PLT. Model fit has been verified by the internal calibration presented in supplementary data files. Survival plot in Fig. 3 shows that our model significantly stratifies patients based on their estimated risk.
4Discussion
In our analysis, we first prove that variability and trend of observations can improve their predictive power, and then we incorporate our findings into the model predicting the survival of patients after LTx. In this study, we concentrate on predicting long-term patients’ survival based on blood tests’ results obtained in the first year after LTx. The rationale for such experiment design is based on the fact that many acute processes, e.g., ischemia, bile ducts’ injury, rejection, and infections often take please in the first transplant year and could influence long term morbidity and survival. Such study design introduces bias by excluding patients who did not survive the first year after LTx, but as we are focusing on the impact of variability and trend of measurements on survival, we need to use a period instead of a time-point to derive the predictors. We wanted to know which parameters in the first year after transplantation influence survival in the cohort of our patients in the outpatient department. In Poland, all recipients are follow up indefinitely in the transplant centers, so it was important to us to find a predictor of long term survival to increase surveillance in patients at risk.
Several studies have concentrated recently on the impact of the variability of common health parameters on morbidity and mortality in various diseases. Heart rate variability recorded in 10-min electrocardiogram could predict 18-month survival in cirrhotic patients independent of age, gender, use of beta-blockers, and the etiology of liver disease [4]. Glomerular filtration rate is a simple measurement of kidney function, but its variability measured during the first year since diagnosis of chronic kidney disease was the best predictor of cardiovascular outcome in a group of 2869 patients [5]. In a prospective cohort analysis including 4982 participants in the Antihypertensive and Lipid-Lowering Treatment to Prevent Heart Attack Trial (ALLHAT) greater visit-to-visit variability of fasting blood glucose level was associated with increased mortality risk over a median follow-up of 5 years. Visit-to-visit variability was defined as the standard deviation or variability of glucose results from the three visits [6].
In our study the best single predictors of patients’ survival were the static values of AST (C-index 0.706), bilirubin (C-index 0.6224), ALT (C-index 0.6102), but on the top half of best-performing predictors over 75% were variables being measures of variability or trend. Based on these findings, we propose the model for predicting long-term mortality in patients after LTx. The final predictors in the model are the static value of AST, the variability of PLT and trend for PLT and WBC. Even though WBC trend variable is not statistically significant in the model (p=0.111), it was included by the automated feature selection procedure indicating that it has an impact on the model's overall predictive power.
Models based on lymphocyte and platelets count and basic biochemical parameters have been reported as predictors of liver graft survival. In a study of 269 hepatocellular carcinoma transplant recipients low absolute lymphocyte count at one month after LTx was significantly related to lower overall survival over a mean follow-up of 35.9 months. The classical predictors like total tumor size>8cm, pretransplant albumin<2.8g/dL, Model End Stage Liver Disease (MELD) score>15 (p=0.017), and tumor beyond Milan criteria were the other significant factors of overall survival [10].
Postoperative PLT of <30G/L predicted major postoperative complications and early perioperative mortality in a prospective study of 120 consecutive living-donor LTx recipients [11]. In a prospective study of 257 LTx patients platelet count <60G/L in the first posttransplant week was an independent predictor of severe complications and early graft and patient survival. However, in both studies, this predictive values were lost in patients who survived more than 90 days [12]. Conversely, in a retrospective analysis of 61 liver transplant recipients high neutrophil-to-lymphocyte ratio (NLR) and platelet count until postoperative day 14 were predictors of the 1- and 5-year survival. In multivariate analysis, NLR≥50 and platelets <80G/L were independently associated with 1-year mortality [13].
Experimental and clinical data suggest an important role for platelet-derived factors in the regeneration of the liver after partial hepatectomy. In humans, platelet transfusion seems to improve regeneration in living-donor transplant recipients and liver function in patients with cirrhosis [14,15]. Platelets can influence liver regeneration by many mechanisms [16], e.g., secretion of growth factors into the hepatic circulation [17,18], transfer of RNA from platelets to hepatocytes, and recruitment of inflammatory cells [19,20]. All these studies focused only on PLT static value, whereas our analysis indicates that both PLT variability and trend measures have significant predictive power.
Our study has limitations. Firstly, we are concentrating only on patients who survived at least one year after liver transplantation. In our work, we focused on the period immediately after the transplantation as we hypothesize that this period should provide the most valuable information and is critical in determining further treatment. Variability period cannot be too short in order to provide the minimum number of observations and stability of trend and variability measures. Secondly, to derive variability predictors for the first year after liver transplantation, we had to exclude patients who have very few observations in this period (less than 5), which limits the applicability of our model in some cases. On the other hand, many papers analyzing variability and trends and predictive factors in LTx recipients included much fewer patients than in our study [4,10,13,14]. We are planning to verify our model using data retrospectively collected from medical records of all patients transplanted in our center. Further experiments are also planned to carry out similar analyzes covering a longer follow-up period after liver transplantation. One of the possible future extensions of the model is to incorporate the sliding window approach, i.e. to use one year period (or other lengths) not necessarily after liver transplantation to determine the remaining survival rate.
In conclusion, adding variability and trend measures increases models’ predictive accuracy in modeling patients survival after LTx. Using this observation, we propose a high-accuracy survival model in which variability and trend of PLT measures in the first year after transplantation are strong predictors of long-term mortality.AbbreviationsLTx liver transplant aspartate transaminase alanine transaminase blood platelets red blood cells white blood cells interquartile range
The research did not receive any specific grant from funding agencies in the public, commercial, or not-for-profit sectors.
Conflict of interestNone.


