


Aims. To define if there is an imbalance in plasma levels of proinflammatory, fibrogenic and antifibrogenic cytokines in patients with liver cirrhosis (LC) and impaired glucose tolerance (IGT) or diabetes mellitus (DM).
Material and methods. We randomly selected 54 out of 100 patients with LC who had normal fasting plasma glucose (FPG) levels. Three groups were formed based on an oral glucose tolerance test (OGTT) results: 18 patients were normal, 18 had IGT, and 18 had DM. Plasma levels of cytokines were measured: TNF-α, soluble tumor necrosis factor receptor 1 (sTNF-R1), leptin, TGF-β1, and hepatocyte growth factor (HGF). Also, fasting plasma insulin (FPI) levels were determined and HOMa2-IR was calculated. Results were compared with those of a control group of 18 patients without liver disease nor DM. Intergroup comparison was performed using non parametric tests.
Results. Significantly higher sTNF-R1 and lower TGF-β1 were found in patients with IGT and DM compared to controls. Leptin, HGF, and TNF-α levels showed no significant differences. According to Child-Pugh classification all cytokines levels were impaired in groups B or C as compared to group A. Positive correlations between sTNF-R1 and HOMA2-IR and between leptin and HOMA2-IR were found.
Conclusions. IGT and DM were associated with abnormalities of sTNF-R1 and TGF-β1 compared to non cirrhotic controls. Among cirrhotic patients impairment of all cytokines were more marked in advanced liver disease. Finally, sTNF-R1and leptin correlated with IR. These findings suggest that IGT and DM may be causally implicated with liver inflammation process.
Patients with LC have a prevalence of overt DM of 30%. However, in cirrhotic patients with normal fasting plasma glucose (FPG) impaired glucose tolerance (IGT) or DM may be detected in 38 and 14% of cases respectively by using an oral glucose tolerance test (OGTT).1–4
Prospective studies have shown that DM (either overt or subclinical) is associated with an increase risk of complications and reduction of survival.5–8 The causes of death were mostly due to liver disease complications.5,6 Since DM is frequently observed in patients with severe liver dysfunction, it has led to suggest that DM may aggravate liver disease.9–11
The type 2 DM and metabolic syndrome are causes of non alcoholic fatty liver disease. Conversely, liver cirrhosis may give rise to DM. It has been demonstrated that hormonal polypeptides called cytokines are involved in the pathophysiology of liver disease induced by type 2 DM. Cytokines act as chemical mediators in the processes of insulin resistance (IR), liver inflammation, and liver fibrosis. Those produced by adipose tissue are called “adipokynes”.12 Some of them have pro-inflammatory and anti-inflammatory activity and others stimulate liver fibrosis, particularly TGF-β1.13,14
TNF-α mediates its biological responses by binding to two cell surface receptors: TNF-R1 and TNF-R2. TNF-R1 is the main inductor of cytotoxicity through induction of a number of biological responses ranging from NF-κβ activation to cell death.15 Soluble forms of both receptors are present in serum as a result of receptor shedding after cellular activation by stimuli of free TNF-α.16–18 Furthermore, TNF-α can induce IR through phophorylation of serine residue of insulin receptor substrate (IRS-1-2).19
Leptin is produced predominantly by adipose tissue. A relationship between leptin and liver fibrosis has been identified in animals20,21 by up-regulation of the expression of TGF-β1.22 Leptin has a direct action on hepatic stellate cells (HSC) which express functionally active leptin receptors.23,24
TGF-β is a pro-fibrotic cytokine found in liver and other organs.25 β1 isoform is the most abundant in the liver.26 TGF-β1 stimulates cell proliferation and synthesis and deposition of type I collagen and extracellular matrix proteins in the injured liver.26
HGF has antifibrotic activity through inhibition of platelet growth factor and TGF-β1.14
The aims of this study were: to determine if there is an impairment of plasma levels of TNF-α, sTN-R1, leptin, TGF-β1, and HGF in patients with IGT or DM and compensated LC. At the same time to observe if there exists a relationship among these cytokines with other parameters such as Child Pugh score, insulin resistance (IR) and body mass index (BMI).
Material and MethodsPatientsWe studied patients with LC who were seen at our hospital from June 2007 to June 2012. Cirrhosis was diagnosed by liver biopsy and/or a combination of clinical data and imaging studies, particularly percutaneous abdominal ultrasound. All patients were adults without a previous diagnosis of DM and with normal FPG (< 100 mg/dL). Patients with: hepatocellular carcinoma, acute alcoholic hepatitis, gastrointestinal bleeding, clinically evident hepatic encephalopathy, chronic renal failure, hepatorenal syndrome, severe infections, and spontaneous bacterial peritonitis were excluded.
One hundred out of 293 assessed patients fulfilled the inclusion criteria. They underwent OGTT using a 75 g load for 180 min according to the provisions of the American Diabetes Association.27 Three study groups, with previously established number of patients, were formed in base of OGTT results: eighteen patients with normal glucose tolerance (NGT), 18 with IGT and 18 with DM were randomly selected for the study.
The protocol was executed in accordance with the ethical guidelines of the 1975 Declaration of Helsinki and it was approved by the Ethics Committee of the Faculty of Medicine of the Universidad Autónoma de Nuevo León. Written consent for participation into the study was obtained from all patients.
AssessmentsComplete clinical examination was conducted inquiring about family history of diabetes and alcohol consumption habits. The following laboratory tests were performed: plasma hemoglobin, platelets blood count, INR, plasma albumin, bilirubin, ALT and γGT. The body mass index (BMI) was calculated, and construed as follows: normal if < 24.9, overweight between 25 and 29.9, and obesity if ≥ 30.28 Liver function was estimated using Child-Pugh and MELD (Model for End-Stage Liver Disease) classifications.29,30
FPI and HOMA2-IRFPI levels were measure by electrochemiluminescence method (Normal values: 2.6-24.9 μIU/mL). In order to calculate IR, the Homeostasis Model Assessment index was calculated using the HOMA2-IR calculator software (http://www.dtu.ox.ac.uk/homa-calculator/index.php).31 IR was arbitrarily defined as a value >2.
Measurement of cytokinesVenous blood samples were obtained from fasting patients. They were centrifuged for 10 min at 5 oC, aliquots were made and samples were stored at -70 oC until they were processed. We used commercially available specific immunoassays for the measurement in duplicate of TNF-α, sTNF R1, leptin, TGF-β1 and HGF (MILLIPLEX MAP kits, Millipore, St. Charles, MO, USA). Luminex 200 was used for the essay. After hydration using buffer, standard curve, in-house quality controls, and sera were added. A mixture of microspheres labeled with the antibody specific for the biomarker were added to each pore. After incubating the plate, detection antibody was added to each pore. The plate was incubated and streptavidin-phycoerythrin was added to each pore. After other incubation, 100 of system liquid was added and stirred for 10 min to suspend the microspheres and ensure a homogeneous distribution. The flow cytometer counted the first 50 microspheres that passed through the reader in 60 sec. The calibration curves were used to convert the mean fluorescent intensity readings for each concentration sample (pg/mL) using a five parameter logistic model. The intra- and inter-assay variation coefficient was less than 5% for all cytokines.
Plasma cytokine levels in the cirrhotic patients were compared with those of a control group containing 18 individuals without LC and DM matched by age, gender, and BMI.
Statistical analysisAll variables were expressed as medians and interquartile ranges (IQR) and categorical variables were expressed as relative proportions. The inter-group comparison was performed by using nonparametric tests: median test, Mann-Whitney U test and Kruskal-Wallis test for independent samples. Correlation analysis was done by using non parametric Spearman rank test. A P-value < 0.05 was considered statistically significant. All statistical analyzes were performed using SPSS v17.0 Statistical Package (Chicago, Illinois, USA).
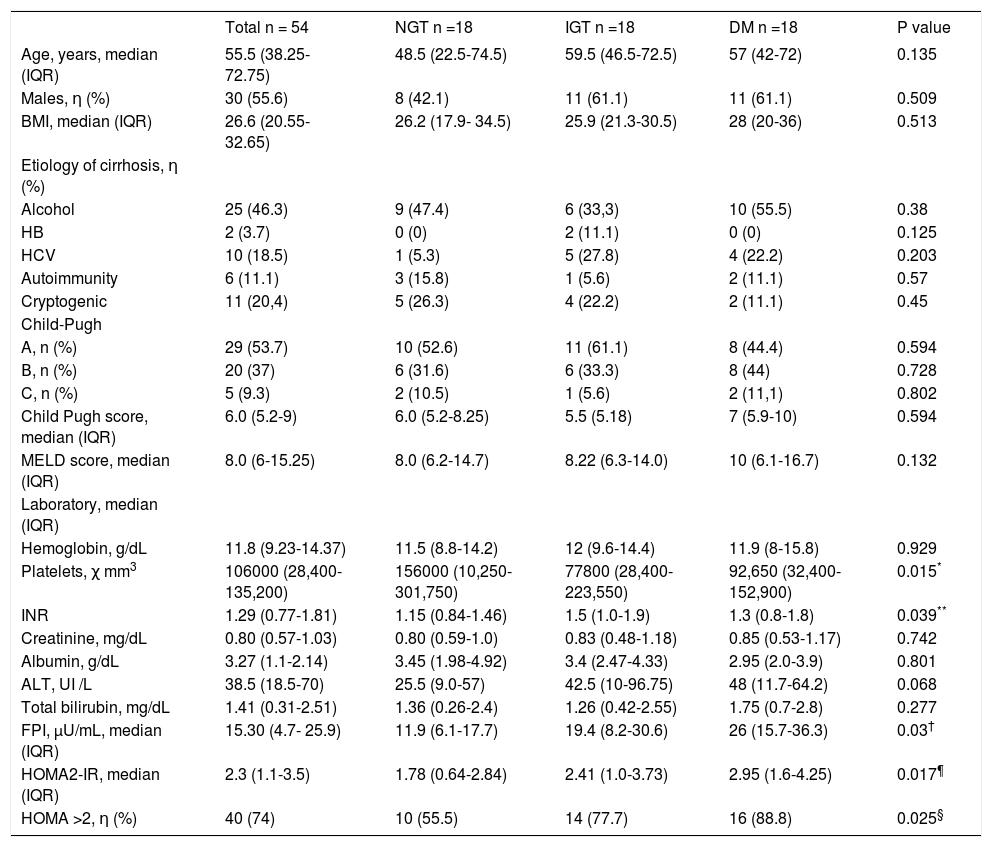
ResultsPatientsDemographic and clinical characteristics of the 54 patients with LC according to the results of the OGTT (NGT, IGT or DM) are shown in table 1. Overall, patients had a median age of 55.5 years (IQR: 38.25-72.75) and 30 were males (55.6%). Median BMI value was 26.6 (IQR: 20.5-32.6). Liver biopsy was performed in 23 (42.5%) patients. The etiology of cirrhosis was alcoholic in 25 (46.3%) and cryptogenic in 11 (20.4%) patients. The Child-Pugh classification score was 6 (IQR: 5.2-9) and the MELD score was 8 (IQR: 6.1-15.25). IR was detected in 74% of the patients.
Clinical and biochemical characteristics of cirrhotic patients with NGT, IGT and DM.
| Total n = 54 | NGT n =18 | IGT n =18 | DM n =18 | P value | |
|---|---|---|---|---|---|
| Age, years, median (IQR) | 55.5 (38.25-72.75) | 48.5 (22.5-74.5) | 59.5 (46.5-72.5) | 57 (42-72) | 0.135 |
| Males, η (%) | 30 (55.6) | 8 (42.1) | 11 (61.1) | 11 (61.1) | 0.509 |
| BMI, median (IQR) | 26.6 (20.55-32.65) | 26.2 (17.9- 34.5) | 25.9 (21.3-30.5) | 28 (20-36) | 0.513 |
| Etiology of cirrhosis, η (%) | |||||
| Alcohol | 25 (46.3) | 9 (47.4) | 6 (33,3) | 10 (55.5) | 0.38 |
| HB | 2 (3.7) | 0 (0) | 2 (11.1) | 0 (0) | 0.125 |
| HCV | 10 (18.5) | 1 (5.3) | 5 (27.8) | 4 (22.2) | 0.203 |
| Autoimmunity | 6 (11.1) | 3 (15.8) | 1 (5.6) | 2 (11.1) | 0.57 |
| Cryptogenic | 11 (20,4) | 5 (26.3) | 4 (22.2) | 2 (11.1) | 0.45 |
| Child-Pugh | |||||
| A, n (%) | 29 (53.7) | 10 (52.6) | 11 (61.1) | 8 (44.4) | 0.594 |
| Β, n (%) | 20 (37) | 6 (31.6) | 6 (33.3) | 8 (44) | 0.728 |
| C, n (%) | 5 (9.3) | 2 (10.5) | 1 (5.6) | 2 (11,1) | 0.802 |
| Child Pugh score, median (IQR) | 6.0 (5.2-9) | 6.0 (5.2-8.25) | 5.5 (5.18) | 7 (5.9-10) | 0.594 |
| MELD score, median (IQR) | 8.0 (6-15.25) | 8.0 (6.2-14.7) | 8.22 (6.3-14.0) | 10 (6.1-16.7) | 0.132 |
| Laboratory, median (IQR) | |||||
| Hemoglobin, g/dL | 11.8 (9.23-14.37) | 11.5 (8.8-14.2) | 12 (9.6-14.4) | 11.9 (8-15.8) | 0.929 |
| Platelets, χ mm3 | 106000 (28,400-135,200) | 156000 (10,250-301,750) | 77800 (28,400-223,550) | 92,650 (32,400-152,900) | 0.015* |
| INR | 1.29 (0.77-1.81) | 1.15 (0.84-1.46) | 1.5 (1.0-1.9) | 1.3 (0.8-1.8) | 0.039** |
| Creatinine, mg/dL | 0.80 (0.57-1.03) | 0.80 (0.59-1.0) | 0.83 (0.48-1.18) | 0.85 (0.53-1.17) | 0.742 |
| Albumin, g/dL | 3.27 (1.1-2.14) | 3.45 (1.98-4.92) | 3.4 (2.47-4.33) | 2.95 (2.0-3.9) | 0.801 |
| ALT, UI /L | 38.5 (18.5-70) | 25.5 (9.0-57) | 42.5 (10-96.75) | 48 (11.7-64.2) | 0.068 |
| Total bilirubin, mg/dL | 1.41 (0.31-2.51) | 1.36 (0.26-2.4) | 1.26 (0.42-2.55) | 1.75 (0.7-2.8) | 0.277 |
| FPI, μU/mL, median (IQR) | 15.30 (4.7- 25.9) | 11.9 (6.1-17.7) | 19.4 (8.2-30.6) | 26 (15.7-36.3) | 0.03† |
| HOMA2-IR, median (IQR) | 2.3 (1.1-3.5) | 1.78 (0.64-2.84) | 2.41 (1.0-3.73) | 2.95 (1.6-4.25) | 0.017¶ |
| HOMA >2, η (%) | 40 (74) | 10 (55.5) | 14 (77.7) | 16 (88.8) | 0.025§ |
NGT: normal glucose tolerance. IGT: impaired glucose tolerance. DM: diabetes mellitus. BMI: body mass index. HOMA: homeostatic model assessment. IQR: interquartile range.
The patients having NGT, IGT, and DM were demographically and clinically similar. Those with DM and IGT showed significantly less blood platelet counts than those with NGT (p = 0.038 and 0.042 respectively) while those with IGT had increased INR values compared to those with NGT (p = 0.039). On the other hand, compared to NGT patients, those with DM showed significant higher FPI levels (26 μU/mL, IQR: 15.7-36.3 vs. 11.9 μU/mL, IQR: 6.1-17.7, p = 0.03), higher HOMA2-IR values (2.95, IQR: 1.6-4.25 vs. 1.78, IQR: 0.64-2.84, p = 0.017) and greater IR frequency (88.8 vs. 55.5%, p = 0.025) (Table 1).
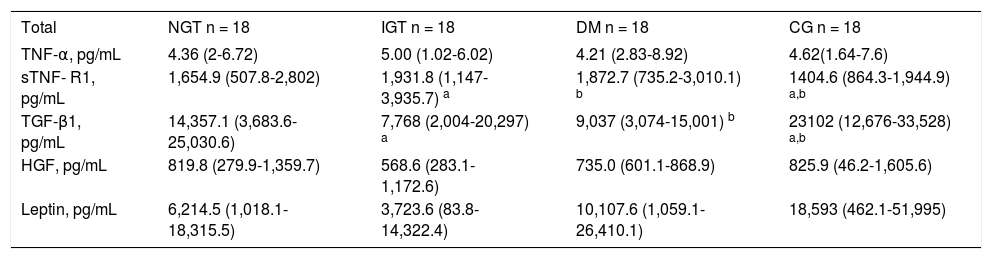
Plasma levels of cytokinesPlasma cytokines values are shown in table 2. Compared to controls, patients with DM and IGT showed significantly higher plasma sTNF-R1 levels (DM: 1872.7 pg/mL, IQR: 735.2-3,010.1, IGT: 1,931.8 pg/mL, IQR: 1147-3935.7 and controls: 1404.6 pg/mL, IQR: 864.3-1,944.9) (IGT vs. controls, p = 0.0043 and DM vs. controls p = 0.0045) (Figure 1A). Non significant differences were observed between control group patients compared to cirrhotic patients with NGT. By contrast, compared to controls, serum TGF-β1 levels were significantly lower in patients with DM and IGT (DM: 9,037, pg/mL IQR: 3,074-15,001, IGT: 7,768 pg/mL, IQR: 2,004-20,297 and controls 23,102 pg/mL, IQR: 12,676-33,528) (DM vs. controls and IGT vs. controls p = 0.0001) (Figure 1B). Again, non significant differences were observed between control group patients compared to cirrhotic patients with NGT. On the other hand non statistically significant differences were found in TNF-α, leptin and HGF among all study groups.
Plasma cytokines levels of cirrhotic patients with NGT, IGT and DM and controls (median and interquartile range).
| Total | NGT n = 18 | IGT n = 18 | DM n = 18 | CG n = 18 |
|---|---|---|---|---|
| TNF-α, pg/mL | 4.36 (2-6.72) | 5.00 (1.02-6.02) | 4.21 (2.83-8.92) | 4.62(1.64-7.6) |
| sTNF- R1, pg/mL | 1,654.9 (507.8-2,802) | 1,931.8 (1,147-3,935.7) a | 1,872.7 (735.2-3,010.1) b | 1404.6 (864.3-1,944.9) a,b |
| TGF-β1, pg/mL | 14,357.1 (3,683.6-25,030.6) | 7,768 (2,004-20,297) a | 9,037 (3,074-15,001) b | 23102 (12,676-33,528) a,b |
| HGF, pg/mL | 819.8 (279.9-1,359.7) | 568.6 (283.1-1,172.6) | 735.0 (601.1-868.9) | 825.9 (46.2-1,605.6) |
| Leptin, pg/mL | 6,214.5 (1,018.1-18,315.5) | 3,723.6 (83.8-14,322.4) | 10,107.6 (1,059.1-26,410.1) | 18,593 (462.1-51,995) |
NGT: normal glucose tolerance. IGT: impaired glucose tolerance. DM: diabetes mellitus. CG: control group. TNF-α: tumor necrosis factor alpha. sTNF-R1: soluble tumor necrosis factor receptor type 1. TGF-β1 : transforming growth factor-β1. HG F: hepatocyte growth factor.
 showing significantly elevated plasma levels of sTNF-R1 (A) and TGF-β1 (B) in patients with impaired glucose tolerance (IGT) and DM compared with controls.")
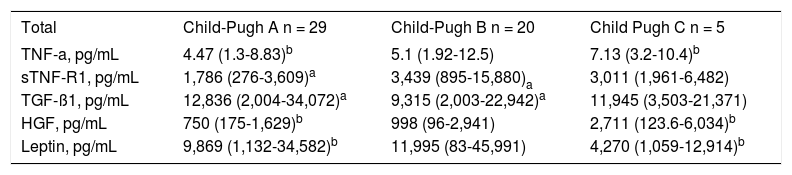
Plasma cytokine values according the groups A, B and C of Child-Pugh classification are shown in table 3. Serum TNFa levels were increased in patients from groups B and C, however only significant differences were observed in group C compared to Group A (p = 0.040). Serum sTNF-R1 levels were also increased in patients from groups B and C, but only significant differences were found comparing group B vs. A (p = 0.033). Serum TGF β1 levels were reduced in groups B and C but significant differences were seen in group B compared to A (p = 0.038). Significant differences of HGF levels were found between Child-Pugh group C compared to A (p = 0.029) and finally plasma leptin levels were significantly lower in group C compared to A (p = 0.029).
Plasma cytokines levels of cirrhotic patients according to Child-Pugh classification (median and interquartile range).
| Total | Child-Pugh A n = 29 | Child-Pugh B n = 20 | Child Pugh C n = 5 |
|---|---|---|---|
| TNF-a, pg/mL | 4.47 (1.3-8.83)b | 5.1 (1.92-12.5) | 7.13 (3.2-10.4)b |
| sTNF-R1, pg/mL | 1,786 (276-3,609)a | 3,439 (895-15,880)a | 3,011 (1,961-6,482) |
| TGF-ß1, pg/mL | 12,836 (2,004-34,072)a | 9,315 (2,003-22,942)a | 11,945 (3,503-21,371) |
| HGF, pg/mL | 750 (175-1,629)b | 998 (96-2,941) | 2,711 (123.6-6,034)b |
| Leptin, pg/mL | 9,869 (1,132-34,582)b | 11,995 (83-45,991) | 4,270 (1,059-12,914)b |
TNF-a: tumor necrosis factor alpha. sTNF-R1: soluble tumor necrosis factor receptor type 1. TGF-ß1: transforming growth factor-ß1. HGF: hepatocyte growth factor.
a,bp < 0.05.
A correlation between sTNF-R1 and HOMA2-IR values (r = 0.32, p = 0.043 and between leptin and HOMA2-IR (r = 0.057, p = 0.001) were observed in cirrhotic patients. No correlation was shown between the other cytokines and HOMA2-IR.
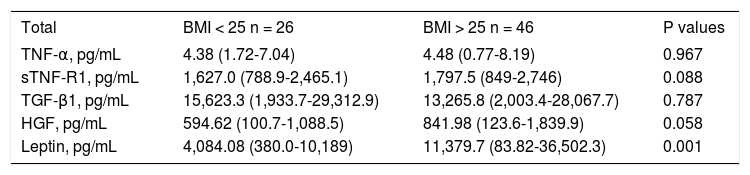
Cytokines and BMITable 4 shows cytokines values in cirrhotic patients and controls with normal or abnormal BMI. Only plasma levels of leptin showed a significant increment in patients with BMI > 25 (p = 0.001).
Plasma cytokine levels of cirrhotic patients with normal and abnormal BMI (median and interquartile range).
| Total | BMI < 25 n = 26 | BMI > 25 n = 46 | P values |
|---|---|---|---|
| TNF-α, pg/mL | 4.38 (1.72-7.04) | 4.48 (0.77-8.19) | 0.967 |
| sTNF-R1, pg/mL | 1,627.0 (788.9-2,465.1) | 1,797.5 (849-2,746) | 0.088 |
| TGF-β1, pg/mL | 15,623.3 (1,933.7-29,312.9) | 13,265.8 (2,003.4-28,067.7) | 0.787 |
| HGF, pg/mL | 594.62 (100.7-1,088.5) | 841.98 (123.6-1,839.9) | 0.058 |
| Leptin, pg/mL | 4,084.08 (380.0-10,189) | 11,379.7 (83.82-36,502.3) | 0.001 |
In this selected cohort of cirrhotic patients without overt DM, it was found that plasma sTNF-R1 and TGF-ß1 levels were significantly impaired in those with IGT and DM as compared to controls. Soluble forms of TNF-R1 (sTNF-R1) are present in serum as a result of receptor shedding after cellular activation by stimuli of TNF-α,16 therefore, high serum sTNF-R1 levels are reliable indicators of TNF-system activation.17 An increase of sTNF-R1 levels has been observed in patients with acute alcoholic hepatitis and cirrhosis.15 In addition, high sTNF-R1 levels were predictive of death at 3 months.15 In our study, increased sTNF-R1 observed in patients with IGT and DM may reflect liver inflammation.24 Significant elevations of TNF α and sTNF R1 were also found in Child-Pugh C and B groups of patients. Clinical DM and IGT are more frequently observed in patients with advanced liver cirrhosis.32 In our study patients with DM had significantly lower levels of serum platelets and higher values of INR compared to NGT patients, abnormalities that reflect liver dysfunction (Table 1).
Our findings suggest that DM and IGT may induce progressive liver failure through liver inflammation. The correlation between sTNF-R1 and HOMA2-IR suggests a link between this cytokine and DM. The possibility that DM and IGT may emerge as a result of liver function deterioration has to be also considered. Nevertheless, the appearance of IR and subclinical forms of DM since early stages of chronic liver disease does not support this theory.
It has to be taken into account that, in diverse conditions frequently associated to DM such as en-dotoxemia33 and bacterial infections,34 increments of serum sTNF-R1 have been observed.
The significant reduction of TGF-β1 observed in our patients with IGT and DM is difficult to explain. This cytokine has been known for many years for its fibrogenic effect. However, it also has anti-inflammatory and immunosuppressive effects. The TGF-β1 is the most abundant isoform of this cytokine family.25–26 It is readily expressed in Kupffer cells, HSC and endothelial cells in normal and cirrhotic liver, activating HSC with an increased production of collagen type I and III, fibronectin, and other extracellular matrix proteins.26 Several studies carried out in cirrhotic patients have described increase in serum TGF-β1 levels. A correlation between TGF-β1 levels and Child-Pugh classification groups has also been described, being this correlation higher in group C.35 However, other studies made in cirrhotic patients have yielded conflicting results. For example, it was reported that serum TGF-β1 levels were significantly higher in patients with fatty liver and NASH than in those with chronic hepatitis C virus who had a higher degree of fibrosis.26 Similarly higher TGF-β1 levels were observed in patients with nonalcoholic steatohepatitis (NASH) compared to healthy controls. In this study, plasma insulin was the most important factor affecting TGF-β1 as determined by multiple regression analysis.36 In our study, the significant reduction in serum TGF-β1 levels observed in cirrhotic patients with IGT and DM may be the effect of HGF-mediated down-regulation or it may be the result of other factors linked to liver failure. In this context, TGF-β1 levels were low and HGF levels were high in our patients from Child-Pugh groups B and C compared to those from group A. In summary, TGF-β1 might be higher in pre fibrotic inflammatory liver injury (such as NASH, acute inflammatory processes of viral or alcoholic etiology and early stages of cirrhosis) than in advanced liver cirrhosis.
We did not observe differences of leptin levels among cirrhotic patients and controls. Nevertheless some studies have shown that leptin may be affected in patients with liver cirrhosis depending on the etiology and metabolic states. It was observed that leptin is elevated in patients with alcoholic cirrhosis regardless of BMI.37 However, no correlation of leptin with alcoholic cirrhosis was observed in other studies when BMI was adjusted.38 Others studies have shown a decrease of leptin in viral cirrhosis compared with alcoholic one.39 Regardless of the etiology of cirrhosis of our patients, we observed a significant reduction of leptin in Child-Pugh group C patients compared to group A. We also found a correlation between leptin and HOMA2-IR and an association of leptin with BMI > 25. Leptin may be in free form in plasma or forming binding complexes with one of its specific receptors (ObRe).40 Similar serum free leptin levels were observed in patients with and without cirrhosis in a study measuring both forms of leptin. Free leptin was positively correlated with metabolic parameters (BMI and IR), while receptor bound leptin was correlated with inflammatory conditions.41
The HGF is a cytokine involved in liver regeneration.14 It has antifibrosing effect which appears to be due to suppression of the TGF-β1 expression.42 In our study plasma levels of HGF did not show significant differences among patients with IGT or DM compared to NGT. Nevertheless our patients from Child-Pugh C showed significant increase of this cytokine compared to group A. This finding is in accordance with some published studies which have shown a positive correlation of serum HGF levels with the degree of fibrosis and the degree of liver failure in patients with HCV cirrhosis.43
This study has some limitations: the sample size of patients is low, additionally we did not measure the degree of hepatic fibrosis which would have been useful for TGF-β1 correlations (nevertheless, the most important aim of our study was correlation of cytokines with IGT or DM), and finally we did not search for subclinical bacterial infections which may impair cytokines plasma levels.
In conclusion, this study showed that in cirrhotic patients, both IGT and DM were associated with significant changes in plasma sTNF-R1 and TGF-β1 levels compared to non cirrhotic, non-diabetic patients. Those in Child-Pugh B and C groups showed significant increases of TNFα, sTNF-R1 and HGF while they had a significant reduction of TGF-β1 and leptin compared to group A. Correlation between sTNF-R1 and leptin with IR and a correlation of leptin with BMI were also observed. These findings suggest that IGT and DM may be causally implicated in liver inflammation process and progressive liver dysfunction.


