


Primary biliary cholangitis (PBC), formerly known as primary biliary cirrhosis, is a disease with a wide range of severity and variable rate of progression, which is characterized by a cycle of immune-mediated destruction of intrahepatic bile ducts [1]. Ursodeoxycholic acid (UDCA), the first-line therapy for PBC, has been shown to delay the development of liver-related outcomes and death [2,3]. However, one-third of PBC patients have an incomplete response to UDCA, in which the course of liver fibrosis is relatively rapid [4]. The diagnosis of advanced liver fibrosis/cirrhosis portends an increased risk of liver-related morbidity and mortality [5]. Fibrosis stage is an independent predictor of outcome in PBC despite a satisfactory response to UDCA. That is, patients with advanced histological fibrosis have ongoing poor outcomes despite a biochemical response to treatment [6]. Liver biopsy (LB) is currently the gold standard for liver fibrosis staging in chronic liver disease. However, due to its invasiveness and potential sampling error, it is not routinely recommended for staging purposes at diagnosis and not for indicated as a means to monitor response to therapy [7,8]. Since there are still no reliable alternative markers for staging liver fibrosis in PBC. There is still a need to develop non-invasive methods for liver fibrosis assessment and monitoring. Liver stiffness measurement (LSM) using Transient Elastography (TE) appears as one of the most promising methods, and the effectiveness of which has been well established in various chronic liver diseases such as Metabolic dysfunction-associated steatotic liver disease (MASLD) and chronic viral hepatitis [9–11]. However, there is limited evidence on its accuracy at the assessment of liver fibrosis in PBC.
The aim of this study was to develop a noninvasive model for predicting histologic staging in patients with PBC based on TE and to compare the value of it to the known serum surrogate markers for the assessment of liver fibrosis by taking liver histology as the reference method.
2Material and Methods2.1Patients laboratory testingA total of 144 patients with PBC who underwent liver biopsy from January 10th, 2012, to May 8th, 2024, at the Beijing Ditan Hospital, Capital Medical University, were enrolled in this study. Inclusion criteria include: (1) meeting the diagnostic criteria for PBC published by the American Association for the Study of Liver Diseases (AASLD) in 2018 [7]; (2) being treated with or without UDCA, regardless of response to UDCA. Patients were excluded from the study for the following reasons: hepatotropic virus infection, histological overlap syndrome with AIH and MASLD, a history or active alcohol abuse, and any other causes of liver injuries other than PBC. According to Chinese guidelines and practice guidance from the AASLD [7,12,13], liver biopsy was performed in the following situations: i) Those with abnormal biochemical indicators of cholestasis but negative results for antimitochondrial antibody (AMA) or PBC-specific antinuclear antibodies, including anti-glycoprotein 210 (anti-gp210) and anti-sp100. ii) PBC patients with unexplained elevation of transaminases (AST or ALT ≥ 5 × ULN), or those with clinical suspicion of concurrent other diseases (such as AIH, MASLD, or DILI, etc.); iii) PBC patients with poor biochemical response to UDCA.
The laboratory data and TE were acquired within one week prior to biopsy. Age, gender, hemoglobin (HGB), red cell distribution width (RDW), platelet (PLT), aspartate aminotransferase (AST), alanine aminotransferase (ALT), gamma-glutamyl transpeptidase (GGT), alkaline phosphatase (ALP), albumin (ALB), globulin (GLB), total bilirubin (TBil), direct bilirubin (DBil), total bile acid (TBA), international normalized ratio (INR), and prothrombin time (PT). Five surrogate blood indices of liver fibrosis were calculated according to published formulas: Aspartate aminotransferase to Platelet Ratio Index (APRI) = AST (U/L)/AST Upper limit of normal value (U/L) × 100 / PLT(× 109 L−1), Fibrosis Index-4(FIB-4) = age (in years) × AST (U/L) / [PLT (× 109 L−1) × ALT (U/L)1/ 2], Albumin-Bilirubin score (ALBI) = 0.66 × log10 [TBil (μmol / L)] - 0.085 × ALB (g/L), International Normalized ratio-to-Platelet Ratio (INPR) = INR/ PLT(× 109 L−1) × 100, Aspartate aminotransferase-to-Alanine aminotransferase Ratio (AAR) = AST (U/L)/ALT(U/L).
2.2Histological assessmentInformed consent was obtained from all of the patients before liver biopsy. Under ultrasonographic supervision, a needle biopsy was carried out using a 16 G disposable needle. The liver specimens were pierced, and at least 1.5 cm of the length was required. Slides were analyzed independently by two qualified pathologists who were blinded to each other’s reading and to the patient’s clinical data and LSM. Fibrosis was staged according to the Ludwig staging system on a 1–4 scale: I= portal hepatitis with little or no periportal inflammation or piecemeal necrosis; II= periportal hepatitis with piecemeal necrosis; absence of bridging necrosis and of septal fibrosis; III= septal fibrosis or bridging necrosis, or both are present; IV= cirrhotic stage: fibrous septa and regenerative nodules [14].
2.3Vibration-controlled transient elastography (FibroScan®)VCTE examination by FibroScan® (Echosens, Paris, France) was performed by physicians trained and certified by manufacturer. An automatic probe selection tool was embedded in the device software that recommends the appropriate probe for each patient according to the real-time assessment of the skin-to-liver capsule distance. All LSM included in the study has been performed after at least 4 h of fast by scanning the right liver lobe through an intercostal space by an experienced operator. LSM were expressed in kiloPascal (kPa) and Boursier criteria performance as a quality control for FibroScan® were evaluated in this cohort that was classified in three reliability categories: very reliable (interquartile range/median (IQR/M)≤0.1), reliable (IQR/M > 0.1 and ≤0.3 or IQR/M > 0.3 with LSM<7.1 kPa), and poorly reliable (IQR/M > 0.3 in patients with LSM>7.1 kPa). Only examinations with at least 10 valid individual measurements and classified as reliable and very reliable according to Boursier criteria were deemed valid.
2.4Statistical analysisSPSS 25.0 and GraghPad Prism 9.0 software were applied for statistical analysis and graphing of data. Continuous variables were summarized by median, first and third quartiles. Multiple groups were compared by One-way ANOVA or K independent samples nonparametric test. Categorical variables were described by absolute frequencies and percentages; to compare groups, we used the χ2 test (or Fisher exact test in the case of sparse tables). Multivariable analysis was undertaken using logistic regression. The receiver operating curve (ROC) was applied to assess the predictive value of each noninvasive model. The best cutoff points were selected according to the Youden index from the ROC curve. Area under the ROC curve (AUROC) was reported together with its 95 % CI. The accuracy of the constructed model was evaluated by accuracy (ACC), sensitivity (SEN), specificity (SPE), positive predictive value (PPV), negative predictive value (NPV). ROC curves were compared using DeLong test. P values< 0.05 was considered statistically significant.
2.5Ethical statementsThe study was in accordance with the Helsinki Declaration of 1975, as revised in 2000. The study protocol was approved by the Ethics Committee of Beijing Ditan Hospital, Capital Medical University (No. DTEC-KY2025–029–01). Written informed consent was obtained from each individual before the liver biopsy.
3Result3.1Patients characteristicsThis study included 144 PBC patients, including 126 females (87.5 %) and 18 males (12.5 %). The ratio of male vs. female was 1:7.0, and the median age was 50.4 (50.4 ± 10.6) years. Fifty-five patients had histological stage Ludwig I (38.2 %), forty-four had Ludwig II (30.6 %), thirty-seven had Ludwig III (25.7 %) and eight had Ludwig IV (5.6 %). The clinical characteristics of all patients with different pathological stages are shown in Table 1. All patients were randomly divided into a model group (n = 96) and a validation group (n = 48). The general information of the two groups was shown in Table S1, which showed that there was no statistically significant difference between the model group and the validation group. The clinical characteristics of patients with different pathological stages in the model group are shown in Table S2. All indicators except age, sex, HB, RDW, GGT, INR and PT differed among different pathological stages (P < 0.05). The block diagrams of the above clinical characteristics according to the histological stage are shown in Fig. 1. It could be seen that LSM, AST, TBiL, DBiL, ALB, ALP and TBA were statistically different in different pathologic stages and the levels of LSM gradually increased with the progression of the histological stage.
Baseline characteristics of enrolled patients with PBC.
HGB, hemoglobin; RDW, red cell distribution width; PLT, platelet; AST, aspartate aminotransferase; ALT, alanine aminotransferase; GGT, gamma-glutamyl transpeptidase; ALP, alkaline phosphatase; ALB, albumin; TBil, total bilirubin; DBil, direct bilirubin; TBA, total bile acid; INR, international normalized ratio; PT, prothrombin time; LSM, Liver stiffness measurement; kPa, Kilopascals;.

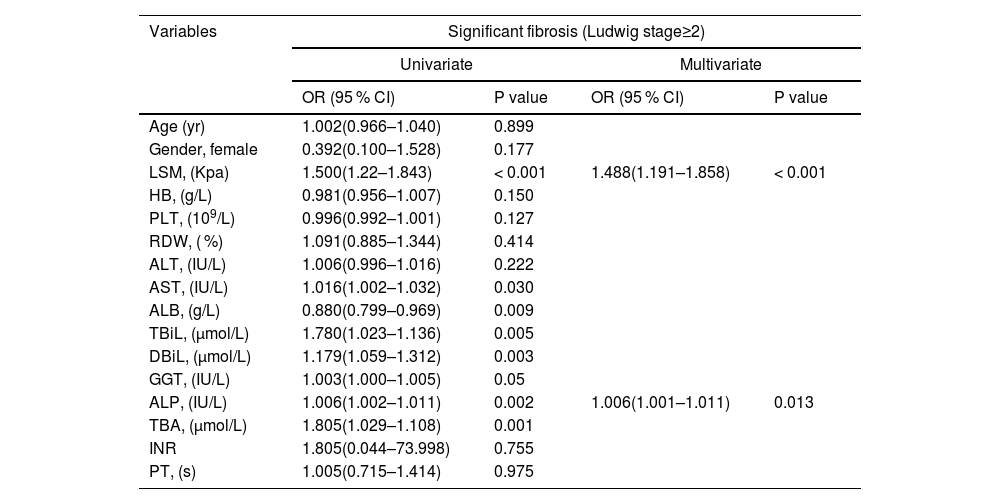
Variables including age, sex, LSM, HB, PLT, RDW, AST, ALT, TBiL, DBiL, ALB, GGT, ALP, TBA, INR and PT were included in the univariate analysis. The presence of significant liver fibrosis (Ludwig stage ≥2) was associated with LSM, AST, TBiL, DBiL, ALB, GGT, ALP and TBA. Multivariate analysis identified only LSM and ALP as independent predictors of significant liver fibrosis (Table 2). In addition, the advanced fibrosis (Ludwig stage ≥3) was linked with LSM, AST, TBiL, DBiL, ALB, GGT, ALP, TBA and INR. Multivariate analysis identified only LSM and ALP as independent predictors of advanced fibrosis (Table 3).
Univariate and multivariate analyses of significant fibrosis (Ludwig stage ≥2) in patients with PBC.
HGB, hemoglobin; RDW, red cell distribution width; PLT, platelet; AST, aspartate aminotransferase; ALT, alanine aminotransferase; GGT, gamma-glutamyl transpeptidase; ALP, alkaline phosphatase; ALB, albumin; TBil, total bilirubin; DBil, direct bilirubin; TBA, total bile acid; INR, international normalized ratio; PT, prothrombin time; LSM, Liver stiffness measurement; kPa, Kilopascals;.
Univariate and multivariate analyses of advanced fibrosis (Ludwig stage ≥3) in patients with PBC.
HGB, hemoglobin; RDW, red cell distribution width; PLT, platelet; AST, aspartate aminotransferase; ALT, alanine aminotransferase; GGT, gamma-glutamyl transpeptidase; ALP, alkaline phosphatase; ALB, albumin; TBil, total bilirubin; DBil, direct bilirubin; TBA, total bile acid; INR, international normalized ratio; PT, prothrombin time; LSM, Liver stiffness measurement; kPa, Kilopascals;.
The LSM-based noninvasive prediction models for predicting significant liver fibrosis and advanced fibrosis were as follows respectively.
- •
Model A = 0.397 × LSM + 0.006 × ALP - 4.713
- •
Model B = 0.588 × LSM + 0.012 × ALP - 7.410
The ROC curves of noninvasive prediction models for predicting significant fibrosis, and advanced fibrosis were shown in Fig. 2A and 2B. The AUROCs from Model A and Model B were significantly greater than those of the five serum indices for the prediction of significant fibrosis and advanced fibrosis. To predict significant fibrosis, the AUROC of model A was higher than APRI (0.870 vs. 0.655, P<0.001), FIB-4 (0.870 vs. 0.618, P<0.001), INPR (0.870 vs. 0.565, P<0.001), AAR (0.870 vs. 0.512, P<0.001), and ALBI (0.870 vs. 0.685, P<0.001) (Table 4). By maximizing Youden’s index, the optimal cutoffs of Model A were 0.624 for the diagnosis of significant fibrosis (the corresponding ACC, SEN, SPE, PPV and NPV were 77.08 %, 70.18 %, 87.18 %, 88.89 % and 66.67 %, respectively) (Table 4).
 and S3-S4 (B) in model group. ROC generated by Model A and Model B for prediction of S2-S4 (C) and S3-S4 (D) in validation group. APRI, Aspartate aminotransferase to Platelet Ratio Index; FIB-4, Fibrosis Index-4; ALBI, Albumin-Bilirubin score; INPR, International Normalized ratio-to-Platelet Ratio; AAR, Aspartate aminotransferase-to-Alanine aminotransferase Ratio.")
Comparison of the diagnostic performance between noninvasive prediction models and other serological markers. ROC generated by Model A and Model B for prediction of S2-S4 (A) and S3-S4 (B) in model group. ROC generated by Model A and Model B for prediction of S2-S4 (C) and S3-S4 (D) in validation group. APRI, Aspartate aminotransferase to Platelet Ratio Index; FIB-4, Fibrosis Index-4; ALBI, Albumin-Bilirubin score; INPR, International Normalized ratio-to-Platelet Ratio; AAR, Aspartate aminotransferase-to-Alanine aminotransferase Ratio.
Diagnostic performances of the Model A, Model B, and other five serum indices in the model group.
AUROC, area under the ROC curve; ACC, accuracy; SEN, sensitivity; SPE, specificity; PPV, positive predictive value; NPV, negative predictive value; APRI, Aspartate aminotransferase to Platelet Ratio Index; FIB-4, Fibrosis Index-4; ALBI, Albumin-Bilirubin score; INPR, International Normalized ratio-to-Platelet Ratio; AAR, Aspartate aminotransferase-to-Alanine aminotransferase Ratio.
To predict advanced fibrosis, the AUROC of Model B was higher than APRI (0.943 vs. 0.708, P < 0.001), FIB-4 (0.943 vs. 0.740, P = 0.001), INPR (0.943 vs. 0.655), AAR (0.943 vs. 0.669, P < 0.001), and ALBI (0.943 vs. 0.749, P = 0.002) (Table 4). The optimal cutoff value of Model B was 0.550 for the diagnosis of advanced fibrosis (the corresponding ACC, SEN, SPE, PPV and NPV were 94.79 %, 80.77 %, 100 %, 100 % and 93.33 %, respectively) (Table 4).
3.4Diagnostic performances of noninvasive prediction models for significant fibrosis and advanced fibrosis in validation groupThe ability of the Model A and Model B to predict the histological stage was analyzed in 48 patients in the validation group. The ROC curves were shown in Fig. 2C and 2D The AUROC of Model A (0.914, 95 %CI: 0.803–1.000) was equivalent to APRI (0.857, 95 %CI: 0.731–0.984, P = 0.342) and superior to FIB-4 (0.813, 95 %CI: 0.662–0.963, P = 0.019), INPR (0.641, 95 %CI: 0.473–0.808, P < 0.001), AAR (0.588, 95 %CI: 0.417–0.759, P < 0.001), ALBI (0.676, 95 %CI: 0.512–0.839, P = 0.004) (Table S3). The optimal cutoff value of Model A 0.624 was used as the diagnostic criteria for distinguishing histological manifestations of the significant liver fibrosis in validation group, and the ACC, SEN, SPE, PPV and NPV were 85.42 %, 84.38 %, 87.50 %, 93.10 % and 73.68 %, respectively. Using the optimal cutoff value of Model B 0.550 as the diagnostic criteria for predicting advanced liver fibrosis in validation group, the ACC, SEN, SPE, PPV and NPV were 70.83 %, 89.47 %, 58.62 %, 58.62 % and 89.47 %, respectively. The AUROC of Model B (0.906, 95 %CI: 0.824–0.987) was equivalent to FIB-4 (0.808, 95 %CI: 0.683–0.933, P = 0.117), INPR (0.782, 95 %CI: 0.647–0.917, P = 0.114) and superior to APRI (0.719, 95 %CI: 0.569–0.868, P00.003), AAR (0.641, 95 %CI: 0.482–0.800, P = 0.002), ALBI (0.713, 95 %CI: 0.564–0.863, P = 0.007) (Table S3).
4DiscussionPBC is a chronic progressive cholestatic liver disease that can progress to cirrhosis if lacking effective and timely therapeutic interventions. It has been shown that the fibrotic stage was an independent predictor of prognosis in PBC [6] and the efficacy of UDCA treatment decreased in the late histological stage [15]. In order to evaluate patient prognosis and adjust the treatment plan timely, the accurate staging of patients throughout the course of the disease, ideally using noninvasive tests, is extremely necessary. Although some guidelines regard TE as a noninvasive standard for the measurement of liver stiffness [16], extensive studies have explored its diagnostic thresholds for discriminating fibrosis stages However, TE has only been well validated in viral hepatitis, with comparable performance in both hepatitis B and hepatitis C. Clinical guidelines for viral hepatitis provide clear diagnostic cutoffs, but there is a lack of definite and reliable clinical diagnostic cutoffs for PBC [8,16,17]. The aim of this study was to find a simple and accurate noninvasive model based on LSM measurements for predicting histologic staging of PBC.
A total of 144 patients with PBC were included in this study, with a ratio of male to female of 1:7. Binary Logistic Regression analysis identified LSM and ALP as independent predictors of PBC histologic stage. ALP is a representative clinical marker of cholestasis. The definitions of inadequate biochemical response to UDCA, however, vary but all encompass an evaluation of ALP activity [8,18]. Patients with inadequate biochemical response to UDCA have the higher risk of future disease progression. Previous researches have shown that elevated ALP at diagnosis was identified as associated risk factor for incomplete response to UDCA [19] and ALP ≥1.5 × ULN was the factor independently associated with having cirrhosis in PBC [20], which was consistent with our research. Assessment of LSM by TE (FibroScan) is an easy, safe and rapid non-invasive procedure, which is applied in the evaluation of patients with PBC. Several researches have described that vibration-controlled transient elastography (VCTE) performed well for diagnosing severe fibrosis or cirrhosis in PBC [21–24]. TE performance compared with liver biopsy in adult patients with PBC was excellent for staging advanced fibrosis (stage F3 and stage F4) and was able to rule out cirrhosis in clinical practice [24]. Consistent with previous studies, the present study found a progressive increase in LSM with the progression of liver fibrosis stage (Fig. 1) and LSM was the independent variable associated with significant fibrosis and advanced fibrosis.
This study showed that Model A and Model B were excellent in predicting the histological stages of PBC. In predicting significant fibrosis (Ludwig stage ≥2) and advanced fibrosis (Ludwig stage ≥3), the AUROC was 0.870 (95 % CI, 0.802–0.939) for model A and 0.943 (95 % CI, 0.888–0.998) for model B, which were higher than all the other 5 surrogate markers of liver fibrosis included in this study. Among the other 5 surrogate markers, APRI and FIB-4 performed well in predicting fibrosis stage of chronic viral hepatitis and non-alcoholic fatty liver disease [25–28]. However, these serological markers were shown to be effective or ineffective as noninvasive method for differentiating the fibrosis stage of PBC in different studies [23,29]. Similar to the findings of Sehmus et al. [30], our result found that APRI and FIB-4 performed moderately well in differentiating advanced fibrosis of PBC (APRI: 0.708, 95 %CI: 0.597–0.819; FIB-4: 0.740, 95 %CI: 0.632–0.848). ALBI was mostly considered a noninvasive predictor of PBC prognosis [31,32]. Consistent with previous study [4], the present study found that ALBI performed well in differentiating advanced fibrosis of PBC (0.749, 95 %CI: 0.632–0.867). AAR was the first serologic marker reported to identify cirrhosis in PBC [33]. However, in subsequent studies, the predictive effect of AAR on the staging of PBC fibrosis has been inconsistent [23,34]. Similar to the findings of Annarosa et al. [23], we found that AAR performed less well in differentiating significant liver fibrosis of PBC (0.512, 95 %CI: 0.393–0.630).
In the validation group, the Model A continued to perform well in differentiating advanced fibrosis of PBC. Its AUROC was still as high as 0.914 (95 % CI, 0.803–1.000), which was better than the other 5 surrogate markers. The accuracy (85.42 %), sensitivity (84.38 %) and specificity (87.50 %) of the Model A were the highest among the non-invasive tests of our study. Similarly, the AUROC of Model B was higher than the other 5 serologic markers (AUROC: 0.906, 95 %CI: 0.824–0.987).
This study still has some limitations. This study was a retrospective study of a single center and the total number of patients was insufficient. Therefore, more patients in different centers are needed to validate the effects of the Models.
5ConclusionsA combination of LSM plus ALP can improve diagnostic accuracy for assessing fibrotic stage compared with the other five serologic markers in both the model and validation groups.
Author contributionsGuarantor of the article: Hongshan Wei; Xiaohui Ye, and Lingling He designed the study; Xiaohui Ye and Caihong Deng collected data; Xiaohui Ye, Lingling He, and Junru Yang were responsible for the methodology and participated in statistical analysis; Xiaohui Ye wrote the original draft; Ping Li and Hongshan Wei reviewed the final manuscript.
Data availabilityThe authors confirm that the data supporting the findings of this study are available within the article.
FundingThis research was supported by the Capital's Funds for Health Improvement and Research (CFH2024–1-4081).
None


