


Portal vein thrombosis (PVT) is a critical complication in cirrhotic patients. We explored the role of the activated factor VII-antithrombin (FVIIa-AT) complex and enhanced monocytic tissue factor (TF) expression in the development and prediction of non-neoplastic PVT in cirrhotic patients.
Material and methodsA total of 30 HCV-cirrhosis patients were included in our study. They were compared to 35 cirrhotic patients without PVT, 15 non-cirrhotic patients with PVT, and 15 healthy controls. The plasma level of the FVIIa-AT complexes was analyzed by ELISA. MIF CD142, CD86, and HLA-DR on monocytes (CD14) were determined by flow cytometry.
ResultsCompared with cirrhotic patients without PVT, cirrhotic patients with PVT had comparable plasma values of FVIIa, AT, and the FVIIa-AT complex. However, they had significantly lower values compared to non-cirrhotic patients with PVT and healthy controls. Cirrhotic patients with PVT had increased monocytic TF expression (MIF CD142) compared to non-PVT cirrhotic patients and healthy controls [86.5 (93.5) vs. 18 (32.0) and 11.0 (6.0), respectively; p < 0.001 for each]. However, cirrhosis PVT could not be distinguished from non-cirrhosis PVT. The area under the ROC curve of MIF CD142 was 0.759 (0.641-0.876; p = 0.000) at an optimal cut-off value of 45, which yielded a sensitivity of 60% and a specificity of 77.1%, as well as a PPV and NPV of 69.2% for each.
ConclusionEnhanced expression of monocytic TF may have a role in the development and prediction of non-neoplastic PVT in HCV-cirrhosis patients. Large multicenter studies are necessary to validate our results.
Portal vein thrombosis (PVT) is a common complication of liver cirrhosis. It is prevalent in approximately 1% of patients with compensated cirrhosis,1 and this rate increases to 8-25% in patients waiting to undergo liver transplantation.2 A further rise was reported (10-40%) with the development of hepatocellular carcinoma.3
To date, the main pathogenic factor of PVT in liver cirrhosis is not completely understood, however, decreased portal blood flow,4 vascular damage,5 hepatic carcinogenesis,3 and complex derangement of the hemostasis system due to liver cell damage6 are pivotal contributors.
The blood coagulation process is triggered when circulating activated factor VII (FVIIa) forms a complex with tissue factor (TF). The TF-FVIIa complex activates factor X which allows the conversion of prothrombin to thrombin resulting in abundant formation of fibrin and clotting.7 FVIIa is inhibited by antithrombin (AT) only when it is bound to TF, which causes the accelerated dissociation of FVIIa from TF; the former can bind to AT which results in the formation of the FVIIa-AT complex. The plasma levels of this complex have been reported to directly correlate with TF mRNA expression and could indirectly reflect the TF-FVIIa interaction and TF exposure, which might have a clinical relevance.8 However, the prominent inhibitor of the TF-FVIIa complex is the TF pathway inhibitor, a kunitz-type protease that binds to TF-FVIIa and to the activated factor X present in the plasma, and on the endothelium. The resulting stable quaternary complex prevents factor X activation and the conversion of prothrombin to thrombin.9
TF is a transmembrane glycoprotein that belongs to the human class II cytokine receptor family.10 It is a potent stimulator of the extrinsic coagulation cascade and is an essential mediator of coagulation.7 TF is not exposed to circulating blood in a resting state, but it becomes exposed on the surface of mononuclear and endothelial cells when they are stimulated by bacteria or by bacterial products such as lipopolysaccharides and proinflammatory cytokines. However, TF located on extravascular sites can become exposed to blood at sites of vascular injury or disruption of the endothelium.11 TF in its active form resides in microparticles (MPs),12 which are submicron membrane fragments derived from activated and apoptotic cell surfaces by proteolytic cleavage of the cytoskeleton. They are derived from a variety of cell types, including mono-cytes, platelets, and endothelial and tumor cells.13 Mono-cytes are considered the main source of TF-bearing MPs.14 All MPs are procoagulant; however, their procoagulant activity is increased by the presence of TF.13
Currently, the plasma level of the FVIIa-AT complex has been reported to be a reliable marker of hypercoagulability in a variety of thrombotic disorders.8,15-17 However, the clinical significance of plasma concentrations of this complex in cirrhotic patients with non-neoplastic PVT, has not yet been clarified.
The aims of this work was to elucidate the plasma levels of the FVIIa, AT and FVIIa-AT complex in hepatitis C virus (HCV)-cirrhosis patients with non-neoplastic PVT and to test the hypothesis that enhanced monocytic TF expression may play a role in the development and prediction of this disease.
Material and MethodsEligible SubjectsThis prospective, hospital-based, case-controlled study was conducted at the Internal Medicine Department at Minia University Hospital, Egypt, between September 2013 and June 2015. A series of patients with non-neoplas-tic PVT and a background of HCV-related liver cirrhosis was recruited from those referred by outpatient clinics. This group of patients was compared to a group of cirrhosis patients without PVT, a group of non-cirrhotic patients with PVT, and a group of healthy subjects.
Cirrhotic patients with non-neoplastic PVT (group I)To obtain a power of at least 80%, a sample of 30 cirrhotic patients with non-neoplastic PVT was enrolled in this study,18 and included 17 (56.7%) males and 13 (43.3%) females. Liver cirrhosis was defined histologically19 or by clinical, laboratory, and ultrasonographic evaluation. A diagnosis of chronic hepatitis C infection was based on the presence of anti-HCV and detectable serum HCV-RNA for 6 months or more. PVT was suspected by the presence of a filling defect in the portal vein and/or its branches by abdominal color Doppler-ultrasound and confirmed by contrast-enhanced computerized tomography scanning.
The exclusion criteria for cirrhotic patients included: diabetes mellitus, pregnancy, breast feeding, hormonal contraception, concomitant hepatitis B virus, human immunodeficiency virus and Schistosoma infection, any recent history of abdominal surgery, any history of blood transfusion within the last 3 days, any history of sclerotherapy within the last 6 months, any recent history of invasive procedures such as transjugular intrahepatic portosystemic shunts or needle aspiration, patients with other causes of liver disease, and those with hepatocellular carcinoma relying on the National Guidelines for Hepato-cellular Carcinoma.20 PVT patients on anticoagulant therapy or those who withdrew from therapy less than 3 months prior to the participation in the study were also excluded.
Cirrhotic patients without PVT (group II)There were 35 patients, with: 23 (65.7%) males and 12 (34.3%) females. These patients were selected from attendants of the Hepatology and Gastrointestinal Unit during the same period of time.
Non-cirrhotic PVT patients (group III)There were 15 patients who experienced non-cirrhotic PVT. These patients were selected from those referred by the Nephrology and Hematology Units of our University Hospital during the same period of time. This group included 8 (53.3%) males and 7 (46.7%) females.
Healthy volunteers (group IV)A total of 15 healthy individuals were randomly selected from the medical and paramedical staff of the same hospital as a control group, including 7 (46.7%) males and 8 (53.3%) females.
Informed consentThe present study was approved by the Institutional Ethics Committee of the School of Medicine, Minia University, Egypt. The study was performed according to the guidelines and regulations of the 1975 Helsinki Declaration and International Conference on Harmonization Guidelines for Good Clinical Practice. Informed written consent was obtained from all subjects.
Clinical and laboratory assessmentAll subjects were asked to fill out a standardized questionnaire to obtain their age, sex, exposure information including both alcohol and tobacco, and any current history of type 2 diabetes mellitus, diagnosed according to the American Diabetes Association Classification Criteria.21
After hospital admission, venous blood was drawn to determine complete blood count, liver function tests, prothrombin time (PT), international normalized ratio (INR), activated partial thromboplastin time (APTT), fasting and two-hour postprandial blood glucose, serum creatinine, alpha fetoprotein, Creactive protein, and anti-Schistosoma mansoni antibodies using commercial kits according to respective manufacturer's instructions.
- •
Virological assays. Anti-HCV was detected using second generation ELISA kits (Ortho-Clinical Diagnostics Co. Inc, Tokyo, Japan). Hepatitis B surface antigen was assessed by radioimmunoassay kits (Lumiplus II hepatitis B surface antigen, Fujirebio Co. Inc. Tokyo, Japan), and HCV-RNA was measured using a standardized autometal qualitative real time polymerase chain reaction, with a lower detection limit of 12 IU of HCV-RNA/mL.
- •
The severity of liver cirrhosis. Severity was quantified according to the Child-Pugh classification22 and the Model for End-Stage Liver Disease (MELD) scoring system.23
- •
Measurements of plasma FVIIa, AT and the FVIIa-AT complexes. These complexes were assessed by a quantitative sandwich enzyme immunoassay technique, using the commercially available kits from Assaypro, Missouri state, USA for FVIIa, and AT, and a kit from Diagnostica Stago, Asnieres, France for the FVIIa-AT complexes.
- •
Analysis of monocytic cluster differentiation (CD) 14 (monocytes), CD142 (TF), CD86 and HLA-DR expression. These expressions were quantified by flow cytometric analysis according to the method described in detail in a previous study.24 To determine the total amount of TF (CD142) expression on monocytes, a histogram of anti-CD142 fluorescence and median intensity of fluorescence (MIF) was recorded.
Abdominal ultrasonography was performed to assess the stigmata of liver cirrhosis, portal vein diameter (PVD), patency, and mean peak systolic velocity (PSV). PVT was suspected by the occurrence of endoluminal material in the main trunk of the portal vein and/or its branches by greyscale ultrasonography or by the presence of a filling defect during color Doppler-ultrasonography. In all cases, the diagnosis was confirmed by abdominal contrast-enhanced computerized tomography scanning.
Statistical analysisData were entered using Microsoft Excel 2013 and were further analyzed using IBM SPSS for Windows (version 21). Categorical data were presented using frequencies and percentages, and compared using the χ2 test. For quantitative data, a one-sample Kolmogorov-Smirnov test was used to test for normality. Age, serum albumin, Child-Pugh score, MELD score, APTT, PVD and HLA-DR were found to be normally distributed. These variables were presented as the mean ± standard deviation (SD) and compared using Student's t-test. The remaining variables were not normally distributed. They were expressed as median and interquartile range (IQR) and compared using the Mann-Whitney U test. Stepwise multiple regression analysis was performed to detect the most constant independent variables in relation to PVT as a dependent variable in cirrhotic patients. With the duplex study as a gold standard test, the receiver operating characteristic (ROC) curves for the FVIIa-AT complex and for CD142 were constructed, and the area under each receiver operating characteristic curve was calculated. Furthermore, the sensitivity, specificity, positive predictive value (PPV), and negative predictive value (NPV) were estimated. A p-value ≤ 0.05 was considered to be significant.
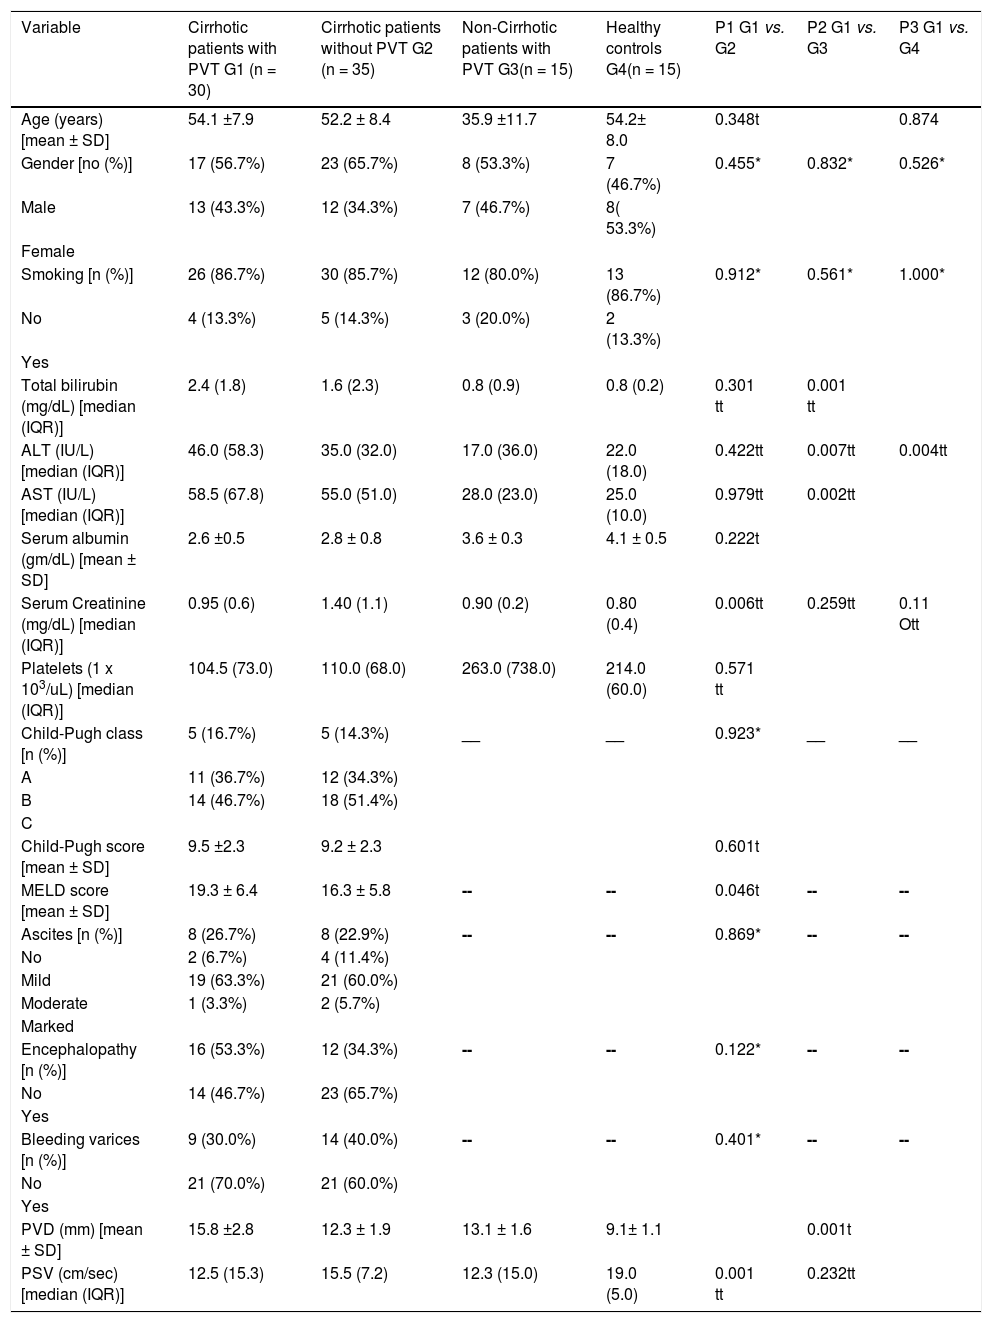
RESULTSThe current study was conducted on a group of cirrhotic patients with non-neoplastic PVT, 17 (56.7%) of whom were male. The mean age was 54.1 ± 7.9 years. Based on the Child-Pugh class, 5 (16.7%) patients belonged to class A, 11 (36.7%) patients belonged to class B, and 14 (46.7%) patients belonged to class C. All recruited patients were positive for HCV antibodies and PCR for HCV RNA. This group of patients was compared to three other groups: HCV-related cirrhotic patients without PVT, non-cirrhotic patients with non-neoplastic PVT and healthy controls (c.f., Table 1).
Demographic, clinical, laboratory and imaging characteristics of the study groups.
| Variable | Cirrhotic patients with PVT G1 (n = 30) | Cirrhotic patients without PVT G2 (n = 35) | Non-Cirrhotic patients with PVT G3(n = 15) | Healthy controls G4(n = 15) | P1 G1 vs. G2 | P2 G1 vs. G3 | P3 G1 vs. G4 |
|---|---|---|---|---|---|---|---|
| Age (years) [mean ± SD] | 54.1 ±7.9 | 52.2 ± 8.4 | 35.9 ±11.7 | 54.2± 8.0 | 0.348t | 0.874 | |
| Gender [no (%)] | 17 (56.7%) | 23 (65.7%) | 8 (53.3%) | 7 (46.7%) | 0.455* | 0.832* | 0.526* |
| Male | 13 (43.3%) | 12 (34.3%) | 7 (46.7%) | 8( 53.3%) | |||
| Female | |||||||
| Smoking [n (%)] | 26 (86.7%) | 30 (85.7%) | 12 (80.0%) | 13 (86.7%) | 0.912* | 0.561* | 1.000* |
| No | 4 (13.3%) | 5 (14.3%) | 3 (20.0%) | 2 (13.3%) | |||
| Yes | |||||||
| Total bilirubin (mg/dL) [median (IQR)] | 2.4 (1.8) | 1.6 (2.3) | 0.8 (0.9) | 0.8 (0.2) | 0.301 tt | 0.001 tt | |
| ALT (IU/L) [median (IQR)] | 46.0 (58.3) | 35.0 (32.0) | 17.0 (36.0) | 22.0 (18.0) | 0.422tt | 0.007tt | 0.004tt |
| AST (IU/L) [median (IQR)] | 58.5 (67.8) | 55.0 (51.0) | 28.0 (23.0) | 25.0 (10.0) | 0.979tt | 0.002tt | |
| Serum albumin (gm/dL) [mean ± SD] | 2.6 ±0.5 | 2.8 ± 0.8 | 3.6 ± 0.3 | 4.1 ± 0.5 | 0.222t | ||
| Serum Creatinine (mg/dL) [median (IQR)] | 0.95 (0.6) | 1.40 (1.1) | 0.90 (0.2) | 0.80 (0.4) | 0.006tt | 0.259tt | 0.11 Ott |
| Platelets (1 x 10³/uL) [median (IQR)] | 104.5 (73.0) | 110.0 (68.0) | 263.0 (738.0) | 214.0 (60.0) | 0.571 tt | ||
| Child-Pugh class [n (%)] | 5 (16.7%) | 5 (14.3%) | __ | __ | 0.923* | __ | __ |
| A | 11 (36.7%) | 12 (34.3%) | |||||
| B | 14 (46.7%) | 18 (51.4%) | |||||
| C | |||||||
| Child-Pugh score [mean ± SD] | 9.5 ±2.3 | 9.2 ± 2.3 | 0.601t | ||||
| MELD score [mean ± SD] | 19.3 ± 6.4 | 16.3 ± 5.8 | -- | -- | 0.046t | -- | -- |
| Ascites [n (%)] | 8 (26.7%) | 8 (22.9%) | -- | -- | 0.869* | -- | -- |
| No | 2 (6.7%) | 4 (11.4%) | |||||
| Mild | 19 (63.3%) | 21 (60.0%) | |||||
| Moderate | 1 (3.3%) | 2 (5.7%) | |||||
| Marked | |||||||
| Encephalopathy [n (%)] | 16 (53.3%) | 12 (34.3%) | -- | -- | 0.122* | -- | -- |
| No | 14 (46.7%) | 23 (65.7%) | |||||
| Yes | |||||||
| Bleeding varices [n (%)] | 9 (30.0%) | 14 (40.0%) | -- | -- | 0.401* | -- | -- |
| No | 21 (70.0%) | 21 (60.0%) | |||||
| Yes | |||||||
| PVD (mm) [mean ± SD] | 15.8 ±2.8 | 12.3 ± 1.9 | 13.1 ± 1.6 | 9.1± 1.1 | 0.001t | ||
| PSV (cm/sec) [median (IQR)] | 12.5 (15.3) | 15.5 (7.2) | 12.3 (15.0) | 19.0 (5.0) | 0.001 tt | 0.232tt |
Group I consisted of 30 cirrhotic patients with PVT, and group II consisted of 35 cirrhotic patients without PVT. The baseline demographic, clinical, and laboratory characteristics, in addition to the findings obtained from the portal vein duplex study, for both groups are summarized in table 1. There were no statistically significant differences in age, gender, serum levels of total bilirubin, liver enzymes and albumin, platelet count, Child-Pugh criteria (class and score), prevalence of smokers or events of liver decompensation such as variceal bleeding, ascites, and hepatic encephalopathy. Cirrhotic patients with PVT were found to have significantly higher MELD scores and PVD values, but significantly lower serum creatinine and portal mean PSV values compared to cirrhotic patients without PVT.
Cirrhotic patients with PVT vs. non-cirrhotic PVT patientsDiagnoses of PVT in non-cirrhotic patients included the following: connective tissue diseases (n = 2), hormonal replacement therapy (n = 3), abdominal inflammation (n = 5), post-splenectomy (n = 3), and idiopathic (n = 2). Both PVT groups were comparable with regard to sex, prevalence of smoking, serum creatinine, and mean portal PSV. However, cirrhotic patients with PVT had statistically significant higher values in terms of age, serum bilirubin, liver enzymes, platelet count and PVD compared with non-cirrhotic patients with PVT. However, they had significantly lower levels of serum albumin compared with non-cirrhotic patients with PVT (c.f., Table 1).
Cirrhotic patients with PVT vs. healthy volunteersNo significant difference in age, sex, prevalence of smoking, and serum levels of creatinine could be found between the groups. The serum levels of total bilirubin, liver enzymes, and PVD were significantly higher, where-as the serum albumin, platelet count, and PSV were significantly lower in cirrhotic patients with PVT compared to the healthy control group (c.f., Table 1).
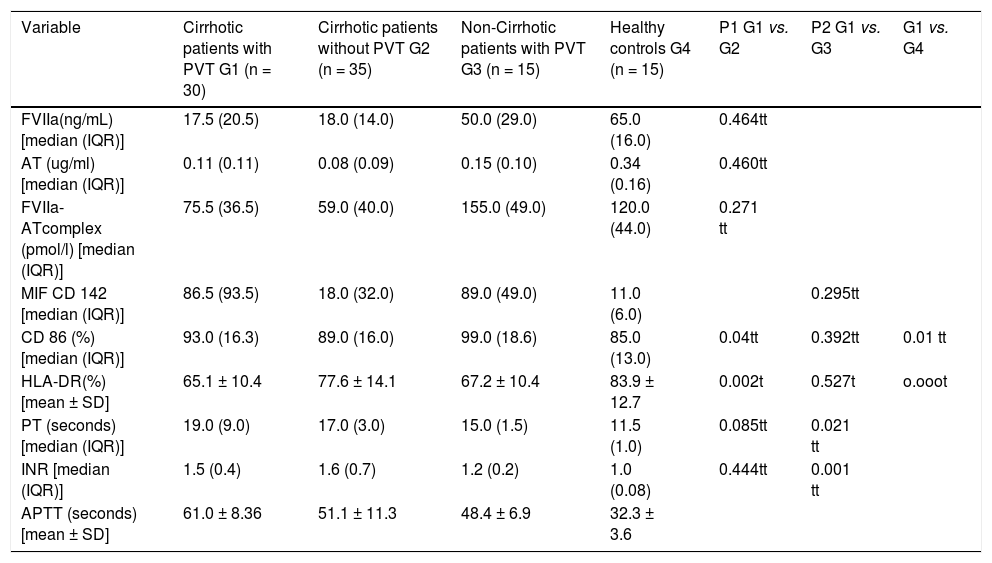
Plasma levels of studied hemostatic factors, MIF CD142, and costimulatory moleculesCirrhotic patients with and without PVT showed no significant differences in FVIIa, AT, the FVIIa-AT complex, and PT and INR plasma levels (17.5 (20.5) ng/mL vs. 18 (14.0) ng/mL, p = 0.464; 0.11 (0.11) μg/mL vs. 0.08 (0.09) μg/mL, p = 0.460; 75.5 (36.5) pmol/L vs. 59 (40.0) pmol/L, p = 0.271; 19.0 (9.0) second (sec.). vs. 17.0 (3.0) sec., p = 0.085 and 1.5 (0.4) vs. 1.6 (0.7), p = 0.444, respectively), whereas cirrhotic patients with PVT had statistically significant higher values of APTT than did cirrhotic patients without PVT (61 ± 8.36 sec. vs. 51.1 ± 11.3 sec., p < 0.001). When cirrhotic patients with PVT were compared with non-cirrhotic patients with PVT, the former group had statistically significant lower values of FVIIa, AT and the FVIIa-AT complexes [17.5 (20.5) ng/mL vs. 50 (29) ng/mL, p < 0.001; 0.11 (0.11) μg/mL vs. 0.15 (0.10) μg/ mL, p < 0.001 and 75.5 (36.5) pmol/L vs. 155 (49) pmol/L, p < 0.001, respectively], and statistically significant higher values of PT, INR, and APTT [19 (9.0) sec. vs. 15 (1.5) sec., p = 0.021; 1.5 (0.4) vs. 1.2 (0.2), p = 0.001, and 61 ± 8.36 sec. vs. 48.4 ± 6.9 sec., p < 0.001) respectively. Similar relations were found when cirrhotic patients with PVT were compared with healthy controls, as they had statistically significant lower values of FVIIa, AT and the FVIIa-AT complex [17.5 (20.5) ng/mL vs. 65.0 (16.0) ng/mL, p < 0.001; 0.11 (0.11) μg/mL vs. 0.34 (0.16) μg/mL, p < 0.001, and 75.5 (36.5) pmol/L vs. 120 (44) pmol/L, p < 0.001, respectively] and statistically significant higher values of PT, INR, and APTT [19.0 (9.0) sec. vs. 11.5 (1.0) sec., 1.5 (0.4) vs. 1.0 (0.08), and 61 ± 8.36 sec. vs. 32.3 ± 3.6 sec., respectively, p < 0.001 for each] (c.f., Table 2).
Comparison of the studied hemostatic factors, monocytic tissue factor expression and other markers of monocytic activation in the study groups.
| Variable | Cirrhotic patients with PVT G1 (n = 30) | Cirrhotic patients without PVT G2 (n = 35) | Non-Cirrhotic patients with PVT G3 (n = 15) | Healthy controls G4 (n = 15) | P1 G1 vs. G2 | P2 G1 vs. G3 | G1 vs. G4 |
|---|---|---|---|---|---|---|---|
| FVIIa(ng/mL) [median (IQR)] | 17.5 (20.5) | 18.0 (14.0) | 50.0 (29.0) | 65.0 (16.0) | 0.464tt | ||
| AT (ug/ml) [median (IQR)] | 0.11 (0.11) | 0.08 (0.09) | 0.15 (0.10) | 0.34 (0.16) | 0.460tt | ||
| FVIIa-ATcomplex (pmol/l) [median (IQR)] | 75.5 (36.5) | 59.0 (40.0) | 155.0 (49.0) | 120.0 (44.0) | 0.271 tt | ||
| MIF CD 142 [median (IQR)] | 86.5 (93.5) | 18.0 (32.0) | 89.0 (49.0) | 11.0 (6.0) | 0.295tt | ||
| CD 86 (%) [median (IQR)] | 93.0 (16.3) | 89.0 (16.0) | 99.0 (18.6) | 85.0 (13.0) | 0.04tt | 0.392tt | 0.01 tt |
| HLA-DR(%)[mean ± SD] | 65.1 ± 10.4 | 77.6 ± 14.1 | 67.2 ± 10.4 | 83.9 ± 12.7 | 0.002t | 0.527t | o.ooot |
| PT (seconds) [median (IQR)] | 19.0 (9.0) | 17.0 (3.0) | 15.0 (1.5) | 11.5 (1.0) | 0.085tt | 0.021 tt | |
| INR [median (IQR)] | 1.5 (0.4) | 1.6 (0.7) | 1.2 (0.2) | 1.0 (0.08) | 0.444tt | 0.001 tt | |
| APTT (seconds) [mean ± SD] | 61.0 ± 8.36 | 51.1 ± 11.3 | 48.4 ± 6.9 | 32.3 ± 3.6 |
The MIF CD142 was significantly higher in cirrhotic patients with PVT than in both cirrhotic patients without PVT and the healthy controls [86.5 (93.5) vs. 18 (32.0) and 11.0 (6.0), p < 0.001 for both), whereas there was no significant difference between patients with PVT with or without liver cirrhosis [86.5 (93.5) vs. 89.0 (49.0), p = 0.295]. Similarly, monocytic expression of CD86 was significantly higher in cirrhotic patients with PVT than in cirrhotic patients without PVT [93.0 (16.3)% vs. 89.0 (16.0)%; p = 0.04], and the healthy controls [93 (16.3)% vs. 85.0 (13.0)%, p = 0.01). No significant difference was found between PVT patients with and without liver cirrhosis [93.0 (16.3)% vs. 99.0 (18.6)%, p = 0.392). The levels of monocytic HLA-DR expression were significantly lower in cirrhotic patients with PVT than in cirrhotic patients without PVT and the healthy controls (65 ± 10.4% vs. 77.6 ± 14.1% and 83.9 ± 12.7%, p = 0.0002 and 0.000, respectively). However, there was no significant difference between cirrhosis and non-cirrhosis PVT (65.1 ± 10.4% vs. 67.2 ± 10.4%, p = 0.527) (c.f., Table 2).
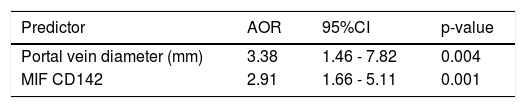
Factors associated with PVT by multivariate analysisWhen a multiple stepwise logistic regression analysis was performed on the parameters that differed significantly in univariate analyses between cirrhotic patients with and without PVT, only PVD (AOR = 3.38, 95% CI = 1.46-7.82 mm, p = 0.004) and MIF CD142 (AOR = 2.91, 95% CI = 1.66-5.11, p = 0.001) were independently associated with PVT occurrence in cirrhotic patients (c.f., Table 3).
Best fitting multiple stepwise logistic regression predictors of non-neoplastic portal vein thrombosis among cirrhotic patients.
| Predictor | AOR | 95%CI | p-value |
|---|---|---|---|
| Portal vein diameter (mm) | 3.38 | 1.46 - 7.82 | 0.004 |
| MIF CD142 | 2.91 | 1.66 - 5.11 | 0.001 |
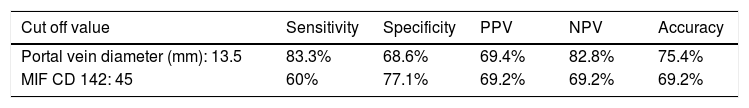
The area under the ROC curve for PVD was 0.872 (95% CI = 0.791-0.953 mm, p < 0.001), whereas that obtained by MIF CD142 was 0.759 (95% CI = 0.641-0.876, p = 0.000) (c.f., Figures 1 and 2). The sensitivity, specificity, PPV, NPV, and accuracy of PVD in cirrhotic patients were 83.3%, 68.6%, 69.4%, 82.8%, and 75.4%, respectively, at a cut-off value of 13.5 mm. MIF CD142, at a cut-off value of 45, exhibited a sensitivity of 60% and a specificity of 77.1%. The PPV and NPV had 69.2% (c.f., Table 4).
 curve for portal vein diameter (PVD) in cirrhotic patients.")
 curve for median inten-sity fluorescence of tissue factor (MIFCD142) in cirrhotic patients.")
Predictive accuracy of the best cut off value of portal vein diameter and MIF CD142 in the diagnosis of non-neoplastic portal vein thrombosis in patients with liver cirrhosis.
| Cut off value | Sensitivity | Specificity | PPV | NPV | Accuracy |
|---|---|---|---|---|---|
| Portal vein diameter (mm): 13.5 | 83.3% | 68.6% | 69.4% | 82.8% | 75.4% |
| MIF CD 142: 45 | 60% | 77.1% | 69.2% | 69.2% | 69.2% |
In the current study, cirrhosis patients with PVT displayed attenuated plasma levels of FVIIa, AT and the FVI-Ia-AT complex compared to non-cirrhotic patients with PVT and healthy controls. However, these parameters could not discriminate cirrhotic patients with PVT from those without. Another single study reported similar results.25 The decreased plasma concentrations of the FVIIa-AT complex during the acute phase of thrombus formation were explained in a previous study by Spiezia, et al.8 They proposed that the presence of the TF pathway inhibitor-activated factor X complex lead to the formation of TF-FVIIa-TF pathway inhibitor-activated factor X stable quaternary complexes, which might restrain the formation of the FVIIa-AT complex. Furthermore, they found that the main determinant of FVIIa-AT complex plasma levels was FVIIa which is the first clotting factor to decrease in patients with decompensated cirrhosis,6 therefore, the FVIIa-AT complex is not a reliable biomarker for the occurrence of PVT in our cirrhosis population. However, FVIIa-AT is considered an ideal biomarker of hypercoag-ulability in patients with a previous thrombotic event.8,16 After FVIIa-AT formation, intravascular TF is left exposed, which may cause adverse clinical implications.8,26
In clinical practice, cirrhosis is accompanied by prolonged PT (INR) and APTT due to the impaired synthesis of most coagulation factors; however, cirrhotic patients rarely exhibit clinical bleeding events. Surprisingly, thrombotic events can occur in these patients, even if the prolonged PT and APTT results suggest hemorrhagic tendency.27 In line with this study, we confirmed prolonged PT and APTT in cirrhotic patients with PVT. It has been reported that these conventional coagulation tests are not suitable to monitor the hemostatic status in patients with liver cirrhosis because; they could not evaluate the entire coagulation system. They are sensitive to variations in the levels of coagulation factors, but are insensitive to variations in the coagulation inhibitor.28
To our knowledge, this is the first study to describe an increased expression of monocyte TF in cirrhotic patients with non-neoplastic PVT compared to those without non-neoplastic PVT and healthy controls.
There are three potential sources of blood-borne TF: peripheral blood cells, MPs, and soluble spliced variant of TF.10 Although monocytes have been considered the main source of TF-bearing MPs, there is emerging evidences indicating the possible implication of other cell populations. Neutrophils release large amounts of TF in the form of neutrophil extracellular traps. Neutrophil extracellular traps are chromatin filaments that form a network of DNA, histones and several cytoplasmic and granule proteins with antibacterial or immune-modulating roles. In addition, the local intraluminal exposure of high levels of thrombogenic TF in neutrophil extracellular traps, is essential for both arterial and venous thrombus initiation and propagation.29 In cirrhosis, some investigators described an increased production of MPs, derived from leukocytes, lymphocytes, erythrocytes, hepatocytes,30 and activated endothelial cells of portal vein radicles that were induced by endotoxemia.31
Additionally, TF has been implicated in several non-thrombotic models, such as inflammation, fibrosis, angiogenesis, tumor growth, and metastasis, via interactions with protease-activated receptors that produce intracellular signals, resulting in the secretion of many cytokines and chemokines.32 Thrombin is also a pivotal player in the activation of protease-activated receptors.33 Cirrhosis patients have increased plasma levels of thrombin due to low protein C and high factor VIII.34
Another striking finding of this study concerns the significant reduction in the expression of monocyte HLA-DR in cirrhotic patients with PVT compared to cirrhotic patients without PVT and healthy controls. PH results in the alteration of gut microcirculation and the formation of microthrombosis,35 thus causing damage to enterocytes, increased intestinal permeability, and bacterial translocation.36 A lipopolysaccharide is a bacterial product that induces the production of tumor necrosis factor-alpha by Kupffer cells, followed by further inflammatory cell recruitment. If this process is not interrupted, the interleukin-10 that is secreted to counteract the damaging effect of the inflammatory cytokines may over-shoot its target, leading to a severe inhibition of monocyte HLA-DR expression.37 Recently, low HLA-DR expression on monocytes was reported in patients with advanced cirrhosis.24 HLA-DR expression plays a central role in antigen presentation and the adaptive immune response.38 Therefore, reduced monocyte HLA-DR expression together with an increased capacity of lipopolysaccharide-stimulated tumor necrosis factor-alpha induction are hallmarks of immune-paralysis that may cause increased portal hypertension, impaired liver function, severe infections and worsening of hemostasis.39 In contrast, we found an increased monocyte CD86 expression in cirrhotic patients with PVT compared to those without PVT and healthy subjects. CD86 is one of the co-stimulatory molecules of human peripheral blood monocytes.40 It plays a role in transmitting stimulatory signals to both immunological and inflammatory cells.41 In the present study, the expression of TF, CD86 and HLA-DR on blood monocytes was not able to distinguish PVT patients with liver cirrhosis from those with-out, probably due to a shared immune-inflammatory process.
A comparison between cirrhosis PVT and cirrhosis non-PVT patients in the present study, showed a significant wider PVD (a well-known marker for PH) in cirrhotic patients with PVT. PH is a frequent clinical syndrome that is most commonly caused by chronic liver disease.42 PH results in reduced portal flow velocity, which seems to be the most important predictive variable for the development of PVT in cirrhosis.43 PVT may adversely affect the disease outcome.3 In support of this finding, the group of cirrhotic patients with PVT in the present study had significantly lower values of mean PSV and worse liver status as indicated by the MELD score.
The link between the development of PH and the immune system has been known since the identification of hepatic stellate cells as innate immune cells.44 It has been reported that agonists of innate immune receptors, including Toll-like receptor 4, lead to hepatic stellate cell activation, which is the key for sinusoidal constriction and matrix deposition.45 This is of particular-internist because lipopolysaccharide is a well-known ligand for Toll-like receptor 4, and because the lipopolysaccharide derived from the gut lumen has long been implicated in the processes of liver injury, fibrosis, and PH development.46 Interestingly, the innate immune function of hepatic stellate cells can also contribute to PH development through ligands that reside within the hepatic sinusoids and are released by injured hepatic cells such as, high mobility group box 1.47 box 1.47
Development of PVT in non-cirrhotic patients with PVT in the present study was not determined by portal hypertension, but mainly by the underlying prothrombotic disorders.
Thrombocytopenia is one of the clinical features of portal hypertension.48 Platelet numbers were matched in both groups of liver cirrhosis in our study, in spite of the more evident manifestation of portal hypertension in the group of cirrhotic patients with PVT. In cirrhosis, throm-bocytopenia is multifactorial; it may result in hypersplenism,48 an immune-mediated mechanism due to increased levels of immunoglobulin G,49 or defective hepatic thrombopoietin production.50
In a multivariate analysis, we found that a wider PVD and increased monocytic TF expression were the only parameters that were independently associated with the development of non-neoplastic PVT in cirrhotic patients. The areas under ROC curves for PVD and monocytic TF expression were 0.872 (95% CI = 0.791-0.953; p < 0.001) and 0.759 (95% CI = 0.641-0.876; p = 0.000), respectively, at an optimal cut-off value of > 13.5 mm for PVD and 45 for MIF CD142. These findings indicated that the enhanced expression of monocytic TF might be used as effectively as a wide PVD for predicting PVT in cirrhotic patients.
This study had several limitations. First is, the relatively small number of the sample size. Second, our study was case-controlled and hospital-based, with samples collected from a clinical series of patients, therefore, the possibility of over-estimating the studied markers could not be completely excluded. Third, the thrombophilic work-up was not performed in PVT cirrhotic patients. Fourth, the peripheral blood monocyte expression of CD142, CD86, and HLA-DR was evaluated by flow cytometric analysis, however, better methodologies, such as immunehistochemistry and western blotting could be employed. Finally, the study results were obtained from one center.
In conclusion, non-neoplastic PVT in cirrhotic patients is an immune-inflammatory disorder, rather than a hypercoagulable state, and enhanced monocytic TF expression appears to be a reliable diagnostic marker. However, other large, multicenter studies are needed to validate our results. Our findings may offer further clues for a recent therapeutic modality.
AbbreviationsAPPT: activated partial thromboplastin test.
AT: antithrombin.
CD: cluster differentiation.
FVIIa: activated factor VII.
HCV: hepatitis C virus.
INR: international normalized ratio.
IQR: interquartile range.
MELD: model of end stage liver disease.
MIF: median intensity fluorescence.
MPs: microparticles.
NPV: negative predictive value.
PH: portal hypertension.
PPV: positive predictive value.
PSV: peak systolic velocity.
PT: prothrombin time.
PVD: portal vein diameter.
PVT: portal vein thrombosis.
ROC: receiver operating characteristic.
SD: standard deviation.
Sec.: second.
TF: tissue factor.
Financial SupportNone.
Potential Competing InterestsNone.


