


Non-Alcoholic Fatty Liver Disease (NAFLD) is a metabolic liver disease related to insulin resistance, which requires invasive methods for diagnosis. The aim of this study was to analyze whether the use of an algorithm involving both clinical indices and hepatic ultrasound measurements improves the accuracy for the non-invasive diagnosis of NAFLD.
Patients and methodsCross-sectional study with patients undergoing elective cholecystectomy. We collected anthropometric, metabolic, liver biopsy, and liver ultrasonography data. We calculated unpaired t-test and Pearson’s coefficient, and areas under the receiver-operating characteristic curves (AUROC) for the Fatty Liver Index (FLI), Lipid Accumulation Product (LAP) indexes, right liver index diameter, and for predictive models constructed with discriminant analysis.
ResultsOne hundred patients in groups with and without NAFLD. FLI, LAP, right and caudate liver lobe diameters, and congestion index were higher in NAFLD group (p = 0.011, p = 0.011, p = 0.001, p = 0.027, p = 0.009). The right liver lobe diameter had the highest AUROC. Predictive models that combined sensitivity and specificity for the clinical indexes and liver ultrasound had an AUROC over 0.7.
ConclusionThe ultrasonography measure of right liver lobe diameter by itself can reliably identify patients with NAFLD with a good sensitivity and specificity, however, this can be improved by adding the LAP mathematical index in our population.
Non-Alcoholic Fatty Liver Disease (NAFLD) is a metabolic liver disease that is closely related to insulin resistance (IR) and highly linked with comorbidities like the metabolic syndrome [1] and gallstone disease [2]. In recent years the prevalence of NAFLD has increased rapidly, emerging as a public health problem worldwide. In Mexicans, the frequency of NAFLD is between 14.3–17.2% in asymptomatic people, while the prevalence associated to metabolic syndrome is 22.8% [3,4]
Liver biopsy is the current clinical gold standard for assessing liver fat content [5], in which presence of steatosis, hepatocellular injury in the form of ballooning, lobular inflammation and perisinusoidal fibrosis, usually with a zone 3 distribution are considered to be most important histological features of adult NAFLD [6]. However, this method is invasive and subject to sampling errors, being not optimal for screening, monitoring, and clinical decision-making. Noninvasive methods that accurately and objectively quantify liver fat are needed. In that context, Clinical Indexes and Doppler Hepatic ultrasound have been recently proposed as alternative methods for non-invasively diagnosing NAFLD.
Several Clinical Indexes incorporating multiple biochemical and clinical parameters have been evaluated for the diagnosis of simple steatosis. To date, perhaps the most promising is the Fatty Liver Index (FLI), which incorporates readily available parameters [body mass index (BMI), waist girth and serum levels of triglycerides and γ-glutamyl-transpeptidase (GGT)] to detect hepatic steatosis [7]. FLI has shown a good predictive capacity of NAFLD compared to ultrasound in different populations, with an accuracy of 0.827 to 0.84 (95% CI 0.822−0.831 and 0.81–0.87) [7–9]. A similar accuracy has been demonstrated using magnetic resonance as a standard test (0.86, 95% CI 0.72−0.99) [10].
The Lipid Accumulation Product (LAP) is an even simpler algorithm that takes into account gender, waist girth and fasting triglyceride levels [11], which has been validated to identify patients with hepatic steatosis compared to 1H-magnetic resonance spectroscopy with accuracy of 0.78 (95% CI 0.72−0.83) [12].
Moreover, ultrasonography is widely used to diagnosing hepatic steatosis, based on the idea that fat accumulation increases the echogenicity of the liver [13]. The use of Hepatic Doppler Ultrasound has also been proposed as a determinant of diagnosis and prognosis of NAFLD, due to the fact that hepatic disease is associated with hemodynamic changes in portal and hepatic artery flow. Several mechanisms have been proposed to explain these changes, including inflammation and regeneration mechanisms [14,15].
Despite the above, currently available methods, both clinic indexes and imaging, cannot obviate the need for liver biopsy for diagnosing NAFLD, due to their substantial false positive and false negative rates. Therefore, the purpose of this study is to analyze whether the use of an algorithm that involves both clinical indices and hepatic ultrasound, improves the accuracy for the diagnosis of NAFLD.
2Patients and methods2.1Patient informationWe carried out a cross-sectional study in 100 patients recruited from the surgery service of the General Hospital Leon, Mexico. The patients underwent elective laparoscopic cholecystectomy, due to an ultrasonographic diagnosis of cholecystitis. Participants did not have history of previously known hepatic diseases, and had not an alcohol consumption ≥30 g/day in men and ≥20 g/day in women [16] and Metabolic Syndrome criteria were evaluated according the harmonizing criteria [17].
2.2Data collectionWaist girth, weight and standing height were obtained before the surgery, by trained personnel, and BMI was calculated. Visceral fat was measured with BC-568 Inner Scan Segmental Body Composition Monitor. A venous blood sample was obtained after 12 h fasting to measure triglycerides and γ-glutamyl-transpeptidase by conventional methods.
2.3Biopsy and hepatic histologyLiver biopsy samples were obtained by intraoperative incisional biopsy and were formalin-fixed and paraffin-embedded. Serial paraffin sections were cut at 4 μm. The slides were stained with hematoxylin and eosin, Masson trichrome stain and PAS- after diastase digestion. All liver biopsies were interpreted by experienced pathologist; only biopsies samples at least 10 mm long and six portal tracts were included for analysis. Histological assessment was based on NAFLD activity score according to Kleiner et al with a range 0−8. The score is defined as the unweighted sum of the scores for steatosis (0–3), lobular inflammation (0–3), and ballooning (0–2). Participants were divided in two groups of NAFLD activity score, the group without NAFLD (with activity index of 0–4) and the group with NAFLD (activity index of 5 or higher) [18].
2.4Clinical indexesFLI was calculated based on the following formula [7]:
The FLI values were measured into a range from 0 to 100 and classified into three categories: <30 considered no steatosis, 30–59 in intermediate state and ≥60 with hepatic steatosis [7].
LAP was calculated by expressing waist enlargement as the measured Waist Circumference that exceeded a sex-specific minimum Waist Circumference value and then multiplying waist enlargement by the concentration of fasting triglycerides [11] :
We used the LnLAP in order to discriminate between intermediate and severe steatosis with the up limited t values of 4.0 in males and 4.4 in females [11].
2.5Liver ultrasonographyB-Mode and Color Doppler were performed by an experienced radiologist, using Philips HD7 Ultrasound Machine, with a convex multifrequency transducer from 2 to 5 MHz. Each subject was examined after 8–12 h fasting in the supine and 60° left lateral positions during quiet inspiration and asked to stop breathing during shallow inspiration for recording the correct spectral Doppler for at least 6 s.
Measurement of the diameters of the right and caudate lobes were made in the largest longitudinal extension of each one of them, considering as normal less than 150 mm and 50 mm respectively [19].
Diameter of the portal vein was measured as the largest anteroposterior size at the intersection with the hepatic artery during suspended respiration [20]. Diameters less than 12 mm were considered normal. No patient presented aberrant anatomy of the portal vein.
The mean maximum portal vein flow velocity (PFV), was measured with respiration suspended, in the center of the vessel at the intersection of the hepatic artery and portal vein, at an angle <60°. The peak velocity curve of the Doppler spectrum from a single cardiac cycle was calculated manually. The five best quality spectral Doppler traces were considered. Each result was the average of five measurements. Normal PFV was estimated as ≥24 cm/s [21]
Congestion index (CI) of the portal vein was calculated by the equation
The normal index was considered <0.1 [22]
The hepatic artery was visualized by positioning the ultrasound probe below the left costal margin and/or right intercostal space. The color Doppler was positioned to visualize the right and left branches of the hepatic artery. Each result was the average of three to five measurements. The mean of the values obtained in the right and left branches of the hepatic artery yielded the hepatic artery resistive (HARI) and pulsatility index (HAPI), according to the following formulate:
The hepatic artery velocity was performed, considering the normal range 30−70 cm/s.
2.6Statistical analysisThe statistical analysis was performed with Statistics 13.0 version. The significance of statistical test was defined at p < 0.05. For comparison between with and without NAFLD groups, unpaired t-test was used. Correlation analysis with Pearson’s coefficient was used to define the relationship between NAFLD activity score and quantitative variables. To test the predictive value of the methods, receiver operating characteristic curves (ROC) were performed with NAFLD activity index obtained by biopsy as the reference method. The areas under the receiver-operating characteristic curves (AUROC) were calculated for significance variables of Correlation test, LAP, FLI and right liver index diameter. With the statistically significant variables in the Pearson’s correlation test, discriminant analysis was performed, and four predictive models were constructed for the clinical diagnosis of NAFLD, and the AUROC were calculated.
2.7Ethical considerationsThe participants signed and informed consent. The study meets the standards of the Declaration of Helsinki and was approved by the Institutional Committee on Bioethics in Research (CIBIUG-P03-2017) and Committee on Research Ethics at General Hospital Leon.
3ResultsA total of 100 patients of which 37 patients had diagnosis of metabolic syndrome undergoing elective laparoscopic cholecystectomy were recruited, and liver biopsy was obtained to classify NAFLD activity score. The range of the score was 0–6 because we did not have patients whose histological classification exceeded this punctuation. A first analysis classifying patients with and without metabolic syndrome, showed that the degree of NAFLD activity, is independent of the presence of metabolic syndrome, so in the rest of the analyzes the total group of patients was taken.
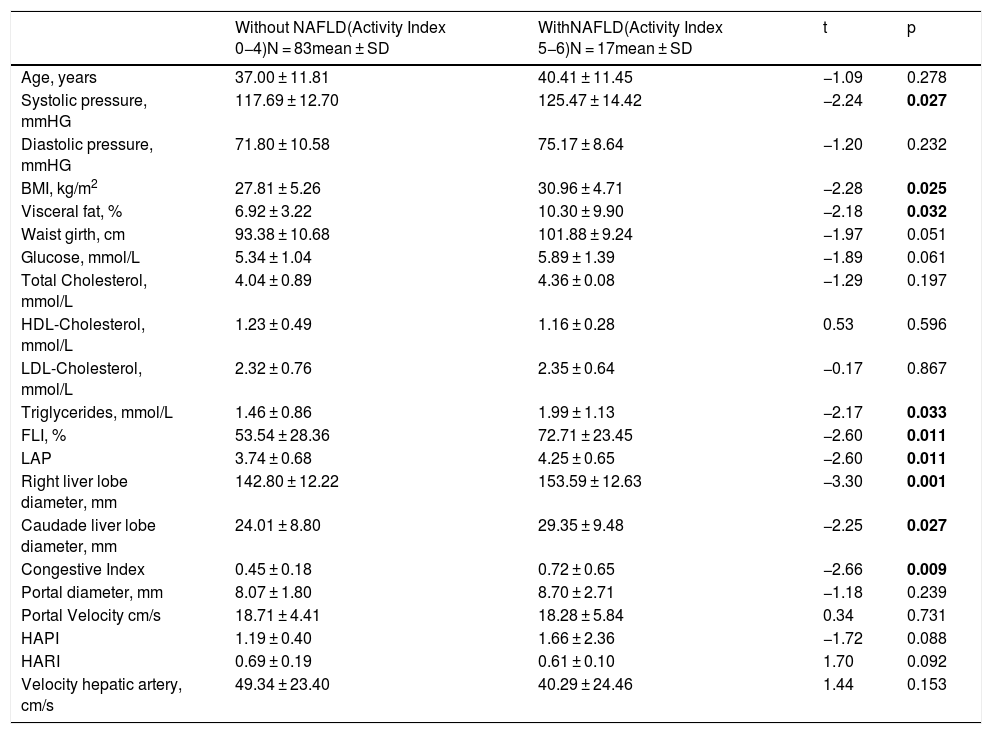
Participants were divided in two groups of NAFLD activity score, the group without NAFLD (with activity index of 0–4) and the group with NAFLD (activity index of 5–6). Systolic pressure, BMI, visceral fat and serum triglyceride levels were higher in the group with NAFLD (p = 0.027, p = 0.025, p = 0.032 and p = 0.033 respectively). With respect to the clinical indexes, FLI and LAP were higher in the NAFLD group with the same statistical significance (p = 0.011). The liver ultrasound measurements showed that the right and caudate liver lobe diameters and congestion index were higher in the NAFLD group (p = 0.001, p = 0.027, and p = 0.009 respectively) (Table 1).
Characteristics of patients with and without NAFLD.
| Without NAFLD(Activity Index 0−4)N = 83mean ± SD | WithNAFLD(Activity Index 5−6)N = 17mean ± SD | t | p | |
|---|---|---|---|---|
| Age, years | 37.00 ± 11.81 | 40.41 ± 11.45 | −1.09 | 0.278 |
| Systolic pressure, mmHG | 117.69 ± 12.70 | 125.47 ± 14.42 | −2.24 | 0.027 |
| Diastolic pressure, mmHG | 71.80 ± 10.58 | 75.17 ± 8.64 | −1.20 | 0.232 |
| BMI, kg/m2 | 27.81 ± 5.26 | 30.96 ± 4.71 | −2.28 | 0.025 |
| Visceral fat, % | 6.92 ± 3.22 | 10.30 ± 9.90 | −2.18 | 0.032 |
| Waist girth, cm | 93.38 ± 10.68 | 101.88 ± 9.24 | −1.97 | 0.051 |
| Glucose, mmol/L | 5.34 ± 1.04 | 5.89 ± 1.39 | −1.89 | 0.061 |
| Total Cholesterol, mmol/L | 4.04 ± 0.89 | 4.36 ± 0.08 | −1.29 | 0.197 |
| HDL-Cholesterol, mmol/L | 1.23 ± 0.49 | 1.16 ± 0.28 | 0.53 | 0.596 |
| LDL-Cholesterol, mmol/L | 2.32 ± 0.76 | 2.35 ± 0.64 | −0.17 | 0.867 |
| Triglycerides, mmol/L | 1.46 ± 0.86 | 1.99 ± 1.13 | −2.17 | 0.033 |
| FLI, % | 53.54 ± 28.36 | 72.71 ± 23.45 | −2.60 | 0.011 |
| LAP | 3.74 ± 0.68 | 4.25 ± 0.65 | −2.60 | 0.011 |
| Right liver lobe diameter, mm | 142.80 ± 12.22 | 153.59 ± 12.63 | −3.30 | 0.001 |
| Caudade liver lobe diameter, mm | 24.01 ± 8.80 | 29.35 ± 9.48 | −2.25 | 0.027 |
| Congestive Index | 0.45 ± 0.18 | 0.72 ± 0.65 | −2.66 | 0.009 |
| Portal diameter, mm | 8.07 ± 1.80 | 8.70 ± 2.71 | −1.18 | 0.239 |
| Portal Velocity cm/s | 18.71 ± 4.41 | 18.28 ± 5.84 | 0.34 | 0.731 |
| HAPI | 1.19 ± 0.40 | 1.66 ± 2.36 | −1.72 | 0.088 |
| HARI | 0.69 ± 0.19 | 0.61 ± 0.10 | 1.70 | 0.092 |
| Velocity hepatic artery, cm/s | 49.34 ± 23.40 | 40.29 ± 24.46 | 1.44 | 0.153 |
BMI: Body Mass Index, FLI: Fatty Liver Index, LAP: Lipid Accumulation Product, HAPI: hepatic artery pulsatility index, HARI: hepatic artery resistive index. Data are presented as mean ± SD.
Values in bold are statistically significant figures.
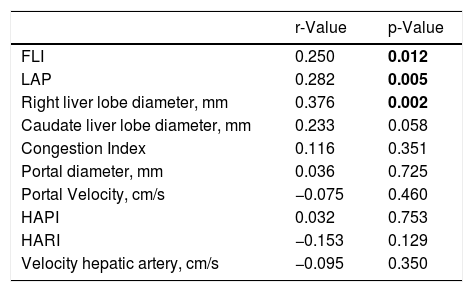
Then, we evaluated the correlating factors with NAFLD activity score, and found positive correlation with FLI (p = 0.012), LAP (p = 0.005), and right liver lobe diameter (p = 0.002) (Table 2)
Correlating factors with NAFLD activity score.
| r-Value | p-Value | |
|---|---|---|
| FLI | 0.250 | 0.012 |
| LAP | 0.282 | 0.005 |
| Right liver lobe diameter, mm | 0.376 | 0.002 |
| Caudate liver lobe diameter, mm | 0.233 | 0.058 |
| Congestion Index | 0.116 | 0.351 |
| Portal diameter, mm | 0.036 | 0.725 |
| Portal Velocity, cm/s | −0.075 | 0.460 |
| HAPI | 0.032 | 0.753 |
| HARI | −0.153 | 0.129 |
| Velocity hepatic artery, cm/s | −0.095 | 0.350 |
FLI: Fatty Liver Index, LAP: Lipid Accumulation Product, HAPI: hepatic artery pulsatility index, HARI: hepatic artery resistive index.
Values in bold are statistically significant figures.
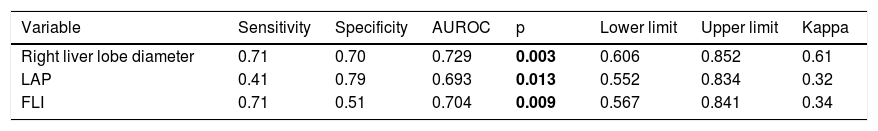
We calculated the AUROC for the variables and we found that FLI, LAP and right liver lobe diameter had larger AUROC values and p < 0.05 (Table 3). The other parameters had an AUROC value smaller and p > 0.05.(Caudate liver lobe diameter AUROC = 0.653, p = 0.126; Congestion Index AUCROC = 0.649, p = 0.135; Portal diameter AUROC = 0.593, p = 0.351; Portal Velocity AUROC = 0.384, p = 0.246; HAPI AUROC = 0.461, p = 0.699; HARI AUROC = 0.330, p = 0.088; Velocity hepatic artery = 0.263, p = 0.18).
Sensitivity and specificity of NAFLD correlated factors.
| Variable | Sensitivity | Specificity | AUROC | p | Lower limit | Upper limit | Kappa |
|---|---|---|---|---|---|---|---|
| Right liver lobe diameter | 0.71 | 0.70 | 0.729 | 0.003 | 0.606 | 0.852 | 0.61 |
| LAP | 0.41 | 0.79 | 0.693 | 0.013 | 0.552 | 0.834 | 0.32 |
| FLI | 0.71 | 0.51 | 0.704 | 0.009 | 0.567 | 0.841 | 0.34 |
LAP: Lipid Accumulation Products. FLI: Fatty Liver Index. AUROC: Areas Under the Receiver-Operating characteristic Curves.
Values in bold are statistically significant figures.
FLI, LAP and right liver lobe diameter were tested to analyze their sensitivity and specificity (Fig. 1).

Then, we calculated the Kappa coefficient and found that the measurement of the right liver lobe diameter (RLLD) had the highest sensibility, specificity, AUROC and Kappa compared to FLI and LAP (Table 3).
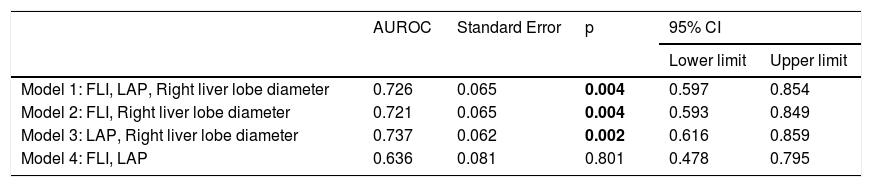
Using the discriminant analysis, three models were constructed to analyze the combined sensitivity and specificity for the clinical indexes and liver ultrasound measurements. The results are shown in the Table 4. The first model was constructed using FLI, LAP and Right liver lobe diameter, the second one used FLI and Right liver lobe diameter, the third was constructed using LAP and Right liver lobe diameter and the fourth used FLI and LAP. The three models that used both clinical indexes and liver ultrasound measurements have and AUROC over 0.7 (Table 4 and Fig. 2).
NAFLD Predictive Models AUROC.
| AUROC | Standard Error | p | 95% CI | ||
|---|---|---|---|---|---|
| Lower limit | Upper limit | ||||
| Model 1: FLI, LAP, Right liver lobe diameter | 0.726 | 0.065 | 0.004 | 0.597 | 0.854 |
| Model 2: FLI, Right liver lobe diameter | 0.721 | 0.065 | 0.004 | 0.593 | 0.849 |
| Model 3: LAP, Right liver lobe diameter | 0.737 | 0.062 | 0.002 | 0.616 | 0.859 |
| Model 4: FLI, LAP | 0.636 | 0.081 | 0.801 | 0.478 | 0.795 |
FLI: Fatty Liver Index. LAP: Lipid Accumulation Product. AUROC: Areas Under the Receiver-Operating characteristic Curves.
Values in bold are statistically significant figures.

ROC curve for NAFLD Predictive Models. Model 1: Fatty Liver Index, Lipid Accumulation Products and Right Liver Lobe Diameter. Model 2: Fatty Liver Index and Right Liver Lobe Diameter. Model 3: Lipid Accumulation Products and Right Liver lobe Diameter. Model 4: Fatty Liver Index and Lipid Accumulation Products.
The progression of NAFLD is potentially reversible in the initial stages. Therefore, its early identification is of the utmost importance. NAFLD prevalence is increasing worldwide, remaining underdiagnosed in most populations. The search of non-invasive diagnostic methods for NAFLD has become important in recent times, however, to date none of them has been adequate to supply the liver biopsy.
Ultrasound represents a non-invasive and widely available tool in the detection of NAFLD. Several studies have reported that severity of fatty liver is associated with liver vascular injuries [23], proposing that the Doppler liver is a useful tool for NAFLD diagnosis. Our results show that, among the performed Doppler measurements, only the congestive index was higher in the group with NAFLD. This is in line with other study proposing that the increase of congestive index in presence of NAFLD is probably due to an increase in the portal diameter as a compensatory effect [24]. Other reports show that the portal vein flow velocity [25–27], hepatic artery resistive index [28–31] and hepatic artery pulsatility index [32] correlate negatively with NAFLD severity, however we did not find this measurements were associated with NAFLD.
Our results show that the simple measurement with conventional ultrasound of the right hepatic lobe diameter is a good clinical marker based on its AUROC value. There is increasing evidence of functional heterogeneity in the individual liver lobes in several hepatic diseases and toxic injury [33–35]. Few studies have compared the percentage of fat accumulated in the different lobes of the liver in patients with NAFLD, showing that in NAFLD the accumulation of fat within the liver tends to be diffuse but the distribution may be non-uniform, even in diabetic patients [36] as in not diabetic patients [37]. Recent data indicate that both adults and teenagers with NAFLD regardless of their age, hepatic fat is stored preferentially in the right lobe probably due to the streamline of blood flow to the right liver [38,39].
With respect to caudate lobe diameter, we found that this was higher in the group with NAFLD. Others reports indicate that an increase of volume caudate lobe is a main parameter of severe fibrosis in NAFLD [40], however we did not have patients presenting hepatic fibrosis.
With respect to mathematical clinical indexes, FLI proved to be a good marker for NAFLD, as reported in previous studies, which compared FLI to NAFLD diagnosis by hepatic ultrasound and H-magnetic resonance [41–43]. The LAP index showed low sensitivity and a limited AUROC for the diagnosis of NAFLD in our cohort. In contrast other studies have reported a higher AUROC of LAP, compared to NAFLD diagnosis with ultrasound [42] and and 1H-magnet resonance spectroscopy [12]. To our knowledge, this is the first study that evaluate the effectiveness of this mathematical index vs liver biopsy, and the first one in Mexican population analyzing these variables together.
We decided to examine predictive models in order to identify the best combination of variables that improve the AUROC in our population. We tested four algorithm models including the parameters that best correlated with the NAFLD activity score. Only three models which included both clinical indexes and liver ultrasound measurements, have AUROC over 0.7, considered an acceptable discriminative capacity for a clinical test. The model that include LAP and right liver lobe diameter exceeded the effectiveness of isolated measurement of the right liver lobe diameter. We propose that development of a new predictive score of NAFLD, involving LAP and the diameter of the right hepatic lobe, could be an easily accessible, non-invasive measurement for the early diagnosis of the disease, reducing costs and increasing the viability of the timely management of the disease. This non-invasive tool could be used in first level medical care by limiting the progression of the disease.
In conclusion, according our results, ultrasonographic measure of right liver lobe diameter by itself is able to reliably identify patients with NAFLD with a good sensitivity and specificity. Moreover, its diagnostic efficiency can be improved by adding the LAP mathematical index in our population.AbbreviationsNAFLD Non-Alcoholic Fatty Liver Disease Insulin Resistance Fatty Liver Index Body mass index γ-glutamyl-transpeptidase Lipid Accumulation Product Portal vein flow velocity Congestion index Hepatic artery resistive Pulsatility index receiver operating characteristic curves Areas under the receiver-operating characteristic curves Right liver lobe diameter
This work was supported by Secretaría de Innovación, Ciencia y Educación Superior del Estado de Guanajuato (Investigadores Jovenes: SICES/CONV/101/2017, and SICES/CONV/243/2019).
Conflict of interestThe authors have no conflicts of interest to declare.
None.


