


With approximately 900,000 new cases annually, primary liver cancer (PLC) ranks as the third most common cause of cancer-related death globally [1,2]. Hepatocellular carcinoma (HCC) and cholangiocarcinoma (CCA) are the two predominant types, constituting about 90 % of primary liver cancers [3]. Despite potential similarities in imaging, their treatments and survival rates differ significantly. Compared to CCA, HCC exhibits a much lower post-resectional relapse rate and advanced stages can be managed with systemic targeted therapies, such as VEGF inhibitors and tyrosine-kinase inhibitors as first-line options [4–6]. Combined hepatocellular-cholangiocarcinoma (cHCCCC) constitutes 1.0 % to 14.2 % of primary liver cancers and is often viewed as an intermediary between these two entities in terms of diagnostic findings and prognosis [7–9]. Histologically, this tumor presents with both cancer cell types and cells displaying intermediate morphology [10]. Imaging findings are typically nonspecific and variable, often exhibiting features characteristic of both HCC and CCA [11,12].
Tumor biopsy significantly enhances diagnostic accuracy, guiding appropriate management strategies such as liver resection for resectable cases and immuno-/TKI or immuno/platinum-based therapy for unresectable cHCCCCs [10,13,14]. However, current guidelines suggest that the diagnosis of HCC can rely solely on imaging [15–17]. This approach may lead to misdiagnosis, contradicting the principle of personalized treatment. Our objective is to evaluate the accuracy of radiologists and the usefulness of radiomic features in distinguishing between HCC, CCA, and cHCCCC.
2Materials and methods2.1Patients enrollmentPatients (n = 68) diagnosed with HCC, CCA, or cHCCCC at Beijing University Cancer Hospital and Institute, China between June 2010 and September 2020 were recruited for this study. Inclusion criteria required an MRI scan within four weeks before or after the pathological diagnosis. The majority of pathological diagnoses (75 %, 51/68) were based on resection specimens and the rest were from multiple core biopsies. Patients with low-quality images, respiratory artifacts, or those who only underwent CT scans were excluded.
2.2Qualitative image analysisSeven radiologists from Asia, Europe, North America, and South America, comprising abdominal imaging experts (AIEs) and non-abdominal imaging experts (NIEs) or trainees, conducted independent and blinded assessments of the MRI scans. They were tasked with providing a diagnosis of either HCC, CCA, or cHCCCC after evaluating predominantly qualitative radiological findings including biliary dilation, capsular retraction, cirrhosis, tumor diameter, number of tumors, number of segments infiltrated, intralesional fat, hemorrhage, peripheral rim enhancement, progressive enhancement, arterial enhancement, tumor thrombus, washout. They also evaluated subjective features including level of confidence in spotting the diagnosis, quality and contrast of the image, as well as its trustability.
MRI quality, contrast, and diagnostic confidence were rated on a scale of 1 to 5, where 1 = non-diagnostic, 2 = severely impaired, 3 = impaired, 4 = minor artifacts, and 5 = excellent. The confidence in diagnosis was rated as 1 = low, 2 = medium, or 3 = high. For T1 characteristics, the categories were 1 = hypointense, 2 = heterogeneous, 3 = isointense / not seen. For T2 characteristics, 1 meant homogeneously intermediate/ hyperintense, 2 peripheral hyperintense, central hypointense, 3 = heterogeneous, 4 = isointense / not seen. For the presence of cirrhosis, the categories were 0 = no, 1 = yes, 3 = not clear. For arterial enhancement, the categories were 0 = hypoenhancement, 1 = mild enhancement, and 2 = strong enhancement. The remaining categorical variables were binary (the feature is present/absent).
2.3Radiomic feature extractionFrom the portal venous phase of contrast-enhanced MRI, the region of interest (ROI) was delineated as the biggest tumor within the liver. Segmentation was performed by a physician (I.R., with two years of experience in segmentation) and reviewed and refined by a clinical radiologist (M.F., with five years of experience in oncologic imaging) using a semi-automated approach with 3D Slicer (version 4.10.2) [18].
Automatic preprocessing was standardized for each case, involving resampling (downsampling to voxel size 1 × 1 × 1 mm to mitigate the influence of varying layer thicknesses and employing linear interpolation), intensity normalization (z-score), and discretization (with a binwidth set to 20). Radiomics feature extraction was conducted in Python using the pyradiomics framework [19]. From each ROI, a total of 107 radiomic features were extracted following the Image Biomarker Standardisation Initiative guidelines [20]. These encompassed 18 first-order metrics, 14 shape features, and 85 texture features including 24 gray level run length matrix (GLCM), 16 gray level run length matrix (GLRLM), 16 gray level size zone matrix (GLSZM), 5 neighboring gray-tone difference matrix (NGTDM), 14 gray level dependence matrix (GLDM).
2.4Model training and testingWe used Python version 3.12. and the scikit-learn library version 1.2. to develop a model for classifying the three tumor types. We evaluated accuracy and area under the receiver operating characteristic curve (AUROC) to compare the performance of different models. First, all features were scaled using the Min-Max method. Feature selection was conducted using the univariate SelectKBest method to rank the features by their F-values (from analysis of variance). These features were then combined in a Random Forest model using stratified 75 % of the dataset for training and validation while the rest was for testing (hold-out set). The class weights were adjusted according to their frequency. We used the random forest algorithm, one of the most popular and precise algorithms in conventional machine learning [21]. The 5 main hyperparameters (criterion, max depth, min samples leaf, min samples split, number of estimators), that we optimized by comparing the AUROCs in grid search. The hyperparameter grid was defined rationally, concerning the number of samples (2–50 estimators, max depth 2–10, min samples leaf 1–10, samples split 1–10). The optimal number of features (k) was based on comparing the AUROCs in 5-fold cross-validation and limited to 6 due to the sample size. The selected model’s performance on the test dataset was evaluated with optimized hyperparameters.
2.5Statistical analysisStatistical analysis was performed in Python 3.12. Quantitative variables were analyzed either by t-test/ analysis of variance (ANOVA) or by their non-parametric variants in case of non-normal distribution. For categorical variables (high vs. low feature value, radiologists vs. radiomics), we calculated p-values by Fisher’s exact test, and odds ratios from a contingency table (in case of a zero value, Haldane-Anscombe correction was applied). Optimal feature cutoffs were calculated by a function maximizing the Youden Index. Cohen’s kappa values were employed to assess the consistency of the radiologists' qualitative (categorical) findings of the MRI images. A kappa value of <0.01 indicated no agreement, 0.01 to 0.20 slight agreement, 0.21 to 0.40 fair agreement, 0.41 to 0.60 moderate agreement, 0.61 to 0.80 substantial agreement, and >0.80 almost perfect agreement [22]. For quantitative continuous features (diameter, number of lesions, number of segments infiltrated), we calculated an interclass correlation coefficient (ICC), where <0.50 indicated poor agreement, 0.50 to 0.75 fair agreement, 0.75 to 0.90 good agreement, and >0.90 excellent agreement [23].
2.6Ethical statementEthical review and approval were waived for this study, due to the retrospective nature of the study. Participant consent was waived due to this study was conducted retrospectively from data obtained for clinical purposes.
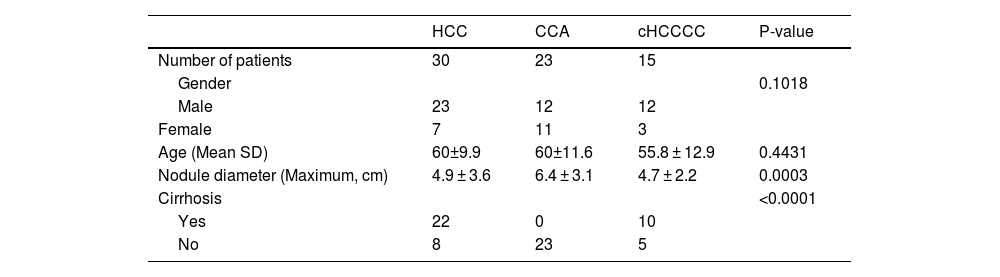
3Results3.1Patient collectiveA total of 120 patients were initially identified for the study. After excluding those with inadequate MRI scans, 68 patients remained eligible for inclusion. This remaining patient cohort for further analysis comprised 30 patients with HCC, 23 with CCA, and 15 with cHCCCC. A flowchart outlining this selection process is summarized in Fig. 1.

Regarding gender distribution, both HCC and cHCCCC exhibited a predominance of male patients (23 males for HCC and 12 for cHCCCC) compared to females (7 females for HCC and 3 for cHCCCC). In contrast, CCA presented an almost equal gender distribution (12 males and 11 females). However, this did not represent any statistical difference (p = 0.10). The age of the patients was fairly consistent across the three tumor types, although those with cHCCCC were, on average, slightly younger (55.8 years) compared to 60 years for the other tumor types (p = 0.44). Nodule size was similar between HCC and cHCCCC, averaging 4.9 cm and 4.7 cm, respectively, whereas CCA tumors were larger, averaging 6.4 cm (p = 0.0003; post hoc HCC vs CCA p = 0.0001, HCC vs cHCCCC p = 0.29, CCA vs cHCCCC p = 0.08). Cirrhosis was more common among patients with HCC (22 patients) and cHCCCC (10 patients), while none of the CCA patients had cirrhosis (p < 0.0001). These findings were summarized in Table 1.
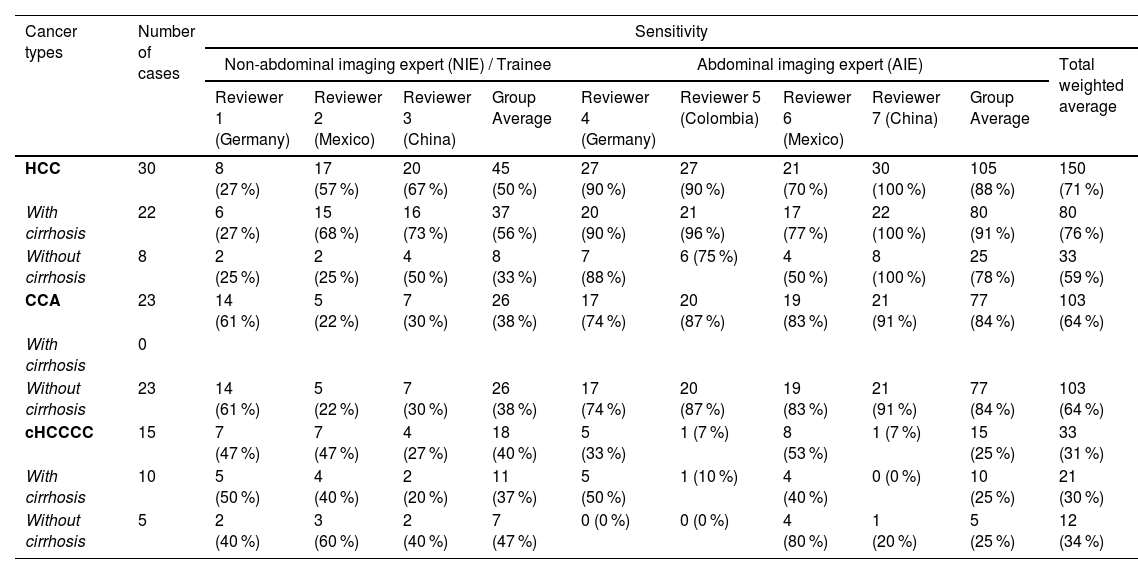
3.2Blinded radiological diagnosis of liver cancerThe qualitative radiological assessment of MRI scans achieved almost perfect agreement (kappa >0.80) for biliary dilation, tumor diameter, and hemorrhage in HCC; for tumor diameter and absence of cirrhosis in CCA; and for the presence of tumor thrombus in cHCCCC. Despite their importance in distinguishing HCC from CCA, characteristics such as the presence of intralesional fat and progressive enhancement demonstrated only fair to moderate agreement. For HCC and CCA, the radiologists agreed excellently on the tumor diameter, while the agreement was only fair for cHCCCC. Similarly, the agreement was poor for the number of lesions and infiltrated segments in the cHCCCC class (Fig. 2).
 among radiologists. For categorical variables, a kappa value of <0.01 indicated no agreement, 0.01 to 0.20 slight agreement, 0.21 to 0.40 fair agreement, 0.41 to 0.60 moderate agreement, 0.61 to 0.80 substantial agreement, and >0.80 almost perfect agreement. For continuous quantitative variables, an ICC of <0.50 indicated poor agreement, 0.50 and 0.75 fair agreement, 0.75 and 0.90 good agreement, and >0.90 excellent agreement.")
Correlation matrix of radiological characteristics and MRI reliability evaluation depicting Cohen’s kappa values or interclass correlation coefficients (ICC) among radiologists. For categorical variables, a kappa value of <0.01 indicated no agreement, 0.01 to 0.20 slight agreement, 0.21 to 0.40 fair agreement, 0.41 to 0.60 moderate agreement, 0.61 to 0.80 substantial agreement, and >0.80 almost perfect agreement. For continuous quantitative variables, an ICC of <0.50 indicated poor agreement, 0.50 and 0.75 fair agreement, 0.75 and 0.90 good agreement, and >0.90 excellent agreement.
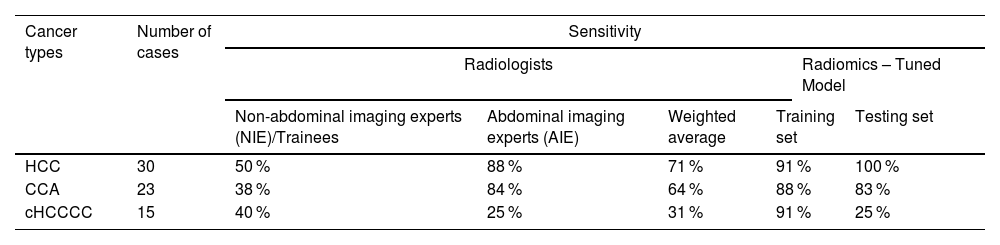
AIEs demonstrated the highest proficiency in diagnosing HCC and CCA, achieving a sensitivity of 88 % and 84 %, respectively. However, their performance in detecting cHCCCC was notably less effective, with sensitivity ranging between 7 % and 53 %, resulting in an average of 25 % (Table 2A).
Sensitivity of radiologists and the tuned radiomics-based model in classifying the three tumor types.
Radiologists were categorized as abdominal imaging experts (AlE) or non-abdominal imaging experts (NIE)/trainees.
On the other hand, NIEs displayed significantly lower detection rates of HCC and CCA. For HCC, their average sensitivity was 50 %, indicating a need for further training in the detection of this common liver cancer (AIE vs NIE p = 0.03). The average sensitivity for CCA was even lower among NIEs, 38 % (AIE vs NIE p = 0.0076). The detection of cHCCCC by NIEs also showed limited success, with rates between 27 % and 47 %, nevertheless, this did not reach statistical significance (AIE vs NIE p = 0.59).
Among the AIEs, the sensitivity in diagnosing HCC or CCA compared to cHCCCC was significantly better (HCC vs cHCCCC p = 0.0029, CCA vs cHCCCC p = 0.0026) (Fig. 3A). The presence of cirrhosis did not have any significant influence on the proportion of correct diagnoses between the different liver tumor types (p = 0.79 for HCC and p > 0.99 for cHCCCC) (Fig. 3B). There was no significant difference between the different geographical locations, neither as a whole (p = 0.99) nor when stratified according to the different types of liver tumors (all p > 0.05) (Fig. 3C-D).
, cirrhosis (B), and reviewers’ country of origin (C, D).")
NIEs achieved a slightly higher sensitivity of 40 % compared to AIEs at 25 %. This suggests that while AIEs are generally more effective, cHCCCC tumors remain a challenging area for both groups (Fig. 4).
3.3Radiomics performance to differentiate the different types of tumors and NIEs (B) clearly highlighting the higher ability of AIEs to correctly diagnose HCC and CCA, nevertheless, both groups showed a low performance diagnosing cHCCCC.")
Given the inability of radiologists to effectively distinguish cHCCCC from HCC and CCA, standard machine learning techniques were employed to further characterize radiomic features for HCC, CCA, and cHCCCC. In a univariate analysis of all these three classes, 'Shape Sphericity', 'First-order Minimum', ‘Shape Maximum2DDiameterSlice’, and ‘Shape Maximum3DDiameter’ were the only four features with a significant difference (p = 0.003, 0.027, 0035, and 0.050, respectively), however, the last two were influenced by different tumor sizes (see Table 1). ‘Shape sphericity’ was significantly higher in the HCCs than in the CCAs (p = 0.001), with an AUROC of 0.76, and an odds ratio of 7.79 for the cut-off value of 0.72 (Fig. 5A, C). ‘FirstOrder Minimum’ was significantly higher in the HCCs than in the cHCCs-CCs (p = 0.027), with an AUROC of 0.70, and an odds ratio of 5.50 for the cut-off value of 42 (Fig. 5B, D), and it was also higher in the HCCs than the CCAs (p = 0.031). No feature differed significantly between CCA and cHCCCC.
 and ‘First-order Minimum’(B) according to tumor type (HCC, CCA, or cHCCCC). These two features showed a significant difference in a univariate analysis (Kruskal-Wallis test) of these three groups. In subgroup analyses, Shape Sphericity displayed a significant difference between HCC vs. CCA with an optimal threshold of 0.72 (C). First-order Minimum differed significantly between HCC vs. cHCCCC, with an optimal threshold of 42.0 (D), and between HCC vs. CCA.")
Boxplots for ‘Shape Sphericity’(A) and ‘First-order Minimum’(B) according to tumor type (HCC, CCA, or cHCCCC). These two features showed a significant difference in a univariate analysis (Kruskal-Wallis test) of these three groups. In subgroup analyses, Shape Sphericity displayed a significant difference between HCC vs. CCA with an optimal threshold of 0.72 (C). First-order Minimum differed significantly between HCC vs. cHCCCC, with an optimal threshold of 42.0 (D), and between HCC vs. CCA.
The pipeline for feature selection based on tuned model performance (multivariate analysis) repeatedly displayed that two features, namely 'Shape Sphericity' and 'GLCM ClusterShade', lead to the best model performance. Both features contributed to the model similarly (46 % vs. 54 %, respectively). The initial model with default hyperparameters was strongly overfitting, displaying an accuracy of 100 % and 65 % and AUROC of 1.00 and 0.82 in the training and testing set, respectively (Fig. 6). The model with optimized hyperparameters (criterion: entropy, max depth: 10, min samples leaf: 1, min samples split: 5, number of estimators: 25) showed an accuracy of 90 % and 76 % and AUROC of 0.98 and 0.91 in the training and testing set, respectively (Fig. 6). The recall and precision in the testing set were 100 % and 83 % for HCC, 83 % and 70 % for CCA, but only 25 % and 100 % for cHCCCC.
 curves in the training and testing set before feature selection (A), after feature selection (B), and after hyperparameter tuning (C). The confusion matrix (D) shows predictions made by the tuned model on the samples in the testing set.")
Performance of three models built by random forest: Receiver Operating Characteristic (ROC) curves in the training and testing set before feature selection (A), after feature selection (B), and after hyperparameter tuning (C). The confusion matrix (D) shows predictions made by the tuned model on the samples in the testing set.
Our radiomic-based model demonstrated sensitivity for detecting HCC comparable to the AIEs (p = 0.604), but significantly better than NIEs (p = 0.002). For CCA, the sensitivity of AIEs and the radiomic model was similar (p = 1.0), whereas NIEs showed significantly lower sensitivity (p = 0.010). In the case of cHCCCC, our model did not achieve superior sensitivity compared to radiologists in either group (p = 1.0 for both AIEs and NIEs). Overall, when considering radiologists as a whole, our model did not outperform them in any of the three classes (p = 0.065 for HCC, p = 0.426 for CCA, and p = 1.0 for cHCCCC) (see Table 2B).
Correct diagnoses and sensitivity for each radiologist.
Detailed table showing the number of correct diagnoses and sensitivity for each radiologist and tumor type as a whole, with, and without cirrhosis.
Radiological imaging plays an essential role in the diagnosis and staging of HCC. In fact, it is likely the only cancer to be diagnosed solely on the basis of radiological imaging. This is mostly due to the typical characteristics of HCC on multiphase CT and Gd-enhanced MRI, which led to the development of the widely accepted LI-RADS scoring system [24]. Although some clinicians have controversially discussed the approach of a solely imaging-based diagnosis of HCC [25], current guidelines have widely accepted non-invasive diagnosis of HCC in high-risk patients [15–17]. However, the definition of high-risk patients varies. For example, the EASL considers high-risk only patients with cirrhosis [15] and APASL guidelines also include patients with chronic viral hepatitis B or C (HBV, HBC) [17]. The recent AASLD guidelines present a compromised solution, incorporating PAGE-B risk score for HBV patients and excluding patients with cirrhosis of vascular etiology [16]. Even though in most cases imaging detects HCC with high accuracy, radiology-based liver cancer diagnosis still has its limitations. Sensitivity is relatively low in nodules <20 mm, and the recommendations cannot be applied to nodules <10 mm at all [26]. A diagnostic biopsy should be performed in low-risk patients or when the findings are inconclusive on both MRI and CT scans (LI-RADS categories 4 and M) [15–17].
In contrast, in CCA tumor biopsy was still considered necessary either from biopsy or resection [5,6,27]. This allows not only histological verification but also genetic testing as more than 40 % of advanced CCAs may harbor druggable molecular targets [28].
Combined HCCCC may represent only a small fraction of primary liver cancers, which still corresponds to thousands of new patients worldwide every year [29]. Furthermore, the disease may be underdiagnosed, as it may resemble other liver malignancies, especially HCC, where the diagnosis can be made without histological assessment.
However, evidence shows that around 40 % of histologically proven cHCCCCs were radiologically assigned to LI-RADS category 4 or 5 [30,31]. In another study, 54 % met all the major criteria for HCC although 88 % of those had at least one ancillary feature favoring non-HCC malignancy [32]. Overall, there is no reliable method for cHCCCC recognition and as a result, the sensitivity by contrast-enhanced CT or MRI is reported to be only 33 % [11]. A similar number was achieved by our international group of radiologists, where the mean sensitivity reached 31 %. Interestingly, the low diagnostic accuracy was consistent between all countries and levels of expertise. Thus overall, cHCCCC might be easily misclassified as HCC and standard imaging seems insufficient for cHCCCC diagnosis.
Given the difficulties of radiologists in detecting cHCCCC by means of conventional radiology procedures, we applied machine learning and radiomics algorithms in order to potentially enhance diagnostic accuracy. Those radiomics approaches certainly offer new avenues for classifying liver cancer and represent the current cutting edge of oncology research, with rapidly growing popularity [21]. Over the past several years, multiple models were developed to classify HCC and CCA from standard imaging methods, outperforming radiologic evaluation in diagnostic accuracy [33–36]. Li et al. included cHCCCC cases in a contrast-enhanced ultrasound-based model [12]. Unfortunately, it was only trained to discriminate between HCC and non-HCC (including CCA + cHCCCC) tumors. Guo et al. developed a logistic regression model using clinical and radiomic features from a large cohort and various MRI sequences [37]. Their hybrid model, based on the portal venous phase, achieved an accuracy of 80 % and an AUROC of 0.88. However, it only differentiated between HCC and cHCCCC, excluding the significant class of CCA. Furthermore, a study by Zhen et al. integrated radiomics features with clinical data and demonstrated the potential for comprehensive diagnostic algorithms to be capable of accurately classifying different tumor types [38]. Also, Xia et al. highlight the utility of radiomics in predicting microvascular invasion, a key determinant of HCC prognosis, and its association with recurrence-free and overall survival [39].
In an univariate analysis, only one feature (first-order minimum) was significantly different between HCC and cHCCCC and no one between CCA and cHCCCC. In a multivariate analysis, our optimized random forest model successfully classified most HCC and CCA cases while the sensitivity for cHCCCC was low. These results suggest that current standard machine learning-based radiomic approaches will not even come close to substantial clinical support in imaging-based diagnosis of cHCCCC when both CCA and HCC are considered differential diagnoses. This underscores the need for further refinement of machine learning approaches or the exploration of advanced algorithms that might improve the diagnostic accuracy of radiomics-based characterization in liver cancers.
Our study encountered several limitations, including the relatively small sample size of cHCCCC tumors, potential bias from imaging resampling, and overfitting risk suggested by pre-tuning 100 % training accuracy. Further exploration and validation in multicenter and larger cohorts is warranted. Despite these limitations, we consider that liver biopsy remains indispensable for the diagnosis and management of liver cancer, particularly for cHCCCC, until more advanced radiomics algorithms and biomarkers become available. While radiomics techniques hold promise for non-invasive characterization of liver lesions [40], they may currently not provide sufficient information to guide clinical decision-making, especially in complex cases such as cHCCCC cancers, in order to support radiologist and increase diagnostic accuracy. However, as the treatment of HCC and CCA and thus also cHCCCC significantly differs, efforts to further improve radiology and machine learning-based diagnosis of liver cancer should continue to improve the accuracy while also exploring novel non-invasive diagnostic approaches to enhance its urgently needed clinical utility.
5ConclusionsCurrent standard imaging and machine learning-based radiomics analysis algorithms were insufficient to reliably characterize cHCCCC. Therefore, combing imaging with biopsy of liver cancer remains critical to the detection, diagnosis, and effective treatment of these cancers.
FundingAT received grants from the Sino-German Center for Research Promotion (grant numbers: GZ-1546 and C-0012), the State Ministry of Baden-Wuerttemberg for Sciences, Research and Arts supporting the Clinical Cooperation Unit Healthy Metabolism at the Center for Preventive Medicine and Digital Health (grant identifier: CCU Healthy Metabolism), the Foundation for Biomedical Alcohol Research (grant identifier: N/A), the Baden-Wuerttemberg Center for Digital Early Disease Detection and Prevention (grant identifier: BW- ZDFP), and the Federal Ministry of Science and Education of Germany (identifier: Q-HCC, 01KD2214).
Authors contributionsImage Acquisition: YQ, QL, YS. Data analysis: YQ, IR, XM, MÜ, GC, AS, MH, PW, AV, CRA, AGM, ZG, CW, MF, AT. Expert advice: SS, ME. Manuscript writing and revision: IR, MV, YQ, AT
Final approval: all authors
None.
articles


![]()