


Introduction and aims. Alcoholic hepatitis is the most severe manifestation of alcoholic liver disease. Unfortunately, there are still some unresolved issues in the diagnosis and management of this disease, such as the need of histological diagnosis, an accurate prognostic stratification, and the development of novel targeted therapies. The present study aimed at addressing these issues by means of metabolomics, a novel high-throughput approach useful in other liver diseases.
Material and methods. 64 patients with biopsy-proven alcoholic hepatitis were included and compared with 26 patients with decompensated alcoholic cirrhosis without superimposed alcoholic hepatitis, which was ruled out by liver biopsy.
Results. The comparison of the metabolic profiles of patients with alcoholic hepatitis and decompensated cirrhosis showed marked differences between both groups. Importantly, metabolic differences were found among alcoholic hepatitis patients when subjects were stratified according to 90-day survival. Based on these findings, two non-invasive signatures were developed. The first one allowed an accurate non-invasive diagnosis of alcoholic hepatitis (AUROC 0.932; 95% CI 0.901-0.963). The second signature showed a good performance in the prognostic stratification of patients with alcoholic hepatitis (AUROC 0.963; 95% CI 0.895-1.000).
Conclusions. Signatures based on metabolomics allowed an accurate non-invasive diagnosis and prognostic stratification of alcoholic hepatitis. The differences observed in the metabolic profile of the patients according to the presence and severity of alcoholic hepatitis are related with different mechanisms involved in the pathophysiology of alcoholic hepatitis such as peroxisomal activity, synthesis of inflammatory mediators or oxidation. This information could be useful for the development of novel targeted therapies.
Alcoholic liver disease is one of leading causes of liver disease worldwide.1 Alcoholic hepatitis (AH), the most severe form of alcoholic liver disease is characterized by an acute derangement of liver function that can occur at any stage of the disease in patients with heavy alcohol consumption.2 The clinical spectrum of AH ranges from asymptomatic forms to severe liver failure with a high mortality rate. The diagnosis of AH can be suspected by clinical and analytical data, but a definitive diagnosis often requires histological confirmation.3 The need of liver biopsy for the diagnosis of AH in the clinical practice is still a matter of controversy. Liver biopsy is an invasive procedure not exempt of complications and sampling error. Moreover, liver biopsy in patients with severe AH usually should be done by transjugular approach that is not available in many hospitals and, on the other hand, the cost-benefit of this technique is questioned by some practitioners. In patients with clinical suspicion, it is difficult to differentiate only by means of clinical data between AH and an acute decompensation of a cirrhosis and thus, AH often remains misdiagnosed without histological confirmation. Therefore, the development novel non-invasive diagnostic methods for AH is urgently needed.
AH carries a high short-term mortality, up to 40% at 90 days from admission in its severe forms.4 The therapeutic approach depends on the severity of the AH. Therefore, an accurate prognostic stratification is of great importance for the correct management of patients with AH. Prognostic models based on clinical or biochemical variables are usually used, such as Maddrey’s discriminant function (DF), model for end-stage liver disease (MELD), Glasgow and age, serum bilirubin, international normalized ratio (INR) and creatinine (ABIC) scores.5-8 Recently, a histologic index for the assessment of the severity and short-term prognosis has also been developed, allowing the classification of patients into mild, moderate and severe AH.9
Metabolomics entails the study of the molecular species smaller than 1,500 Da in any biological fluid, cell or tissue, aiming to determine possible alterations in the metabolism due to physiological and pathological changes, or disturbances in the biological system. This rapidly expanding research field is set up on high-throughput technologies such as soft-ionization mass spectrometry (MS) combined with well-established separation techniques, in particular liquid chromatography. Metabolomics offers clinical applications, such as disease diagnosis or stratification, as well as important information for clinical research in terms of hypothesis generation. The usefulness of metabolomics has been demonstrated in a wide range of medical conditions, including liver diseases. In this field, several applications of metabolomics have been reported, such as the potential to discriminate between different forms of liver disease10 or the non-invasive diagnosis of idiopathic portal hypertension.11 It has also been identified a metabolic profile able to distinguish simple steatosis from steatohepatitis in patients with non-alcoholic fatty liver disease.12
The aims of the present study were:
- •
To identify a metabolic profile as a non-invasive method for an accurate diagnosis of AH and
- •
To assess the utility of metabolomics to stratify AH according to its severity in order to optimize the management of these patients.
Sixty-four consecutive patients with biopsy-proven AH admitted to the Liver Unit of the Hospital Clinic of Barcelona, Spain between 2010 and 2012 were prospectively included, as well as 26 patients with decompensated alcoholic cirrhosis admitted in the same period. The clinical and biochemical suspicion criteria of AH were an abrupt worsening of liver function, high bilirubin (> 3 mg/dL) and elevated levels of aminotransferases (aspartate aminotransferase higher than alanine aminotransferase) and gammaglutamyl transferase in the presence of an excessive alcohol intake. According to the center’s protocol, all patients in whom AH was clinically suspected underwent a liver. The histological criteria of AH were hepatocellular necrosis, inflammatory infiltrate (mainly polimorphonuclear) and pericellular fibrosis. Patients with severe AH, defined as a Maddrey’s DF > 32 and/or ABIC score > 6.71, and no contraindications, were treated with 40 mg/ day of prednisone for 4 weeks, followed by a 2-week taper period, with or without treatment discontinuation at 7 days in non-responding patients assessed by the Lille model.13 The decompensated cirrhosis (DC) group included those patients with clinical and biochemical suspicion of AH that underwent liver biopsy and did not fulfill histological criteria of AH. In all cases, serum samples were obtained from peripheral blood at the time of liver biopsy, which was performed within the first 48 h of hospitalization, and they were stored at -80¯C until the metabolomic analysis. Major decompensations of cirrhosis and bacterial infections were diagnosed and treated according to International guidelines and the Liver Unit protocols. The study was approved by the Hospital Clínic Ethics Committee and written informed consent was obtained from all the participants.
Metabolic profilingSerum metabolic profiles were analyzed as previously described.12 Briefly, ultra-high performance liquid chromatography (UHPLC)-single quadruple-MS amino acid analysis system was combined by two separate UHPLCtime-of-flight-MS based platforms analyzing methanol and chloroform/methanol extracts. Identified ion features in the methanol extract platform included non-esterified fatty acids (FA), acyl carnitines, bile acids, steroids, oxidized FA, monoacylglycerophospholipids and monoetherglycerophospholipids. The chloroform/methanol extract platform provided coverage over glycerolipids, cholesteryl esters, sphingolipids, diacylglycerphospholipids, acylether-glycerophospholipids and primary fatty amides. Lipid nomenclature and classification follows the LIPID MAPS convention, www.lipidmaps.org.
Data and statistical analysisAll data were processed using the TargetLynx application manager for MassLynx 4.1 (Waters Corp., Milford, MA). Intraand interbatch normalization followed the procedure described by Martinez-Arranz, et al.14
Continuous variables were described by mean (95% confidence interval CI). Categorical variables were described by means of counts and percentages. Comparisons between AH and DC patients, and between AH patients alive or deceased at 90 days were performed by the Student t test or the Mann-Whitney U test when appropriate. The two-tailed Wilcoxon signed-rank test was used for assessing the metabolic differences. Differences between categorical variables were assessed by the χ2 test or the Fisher’s exact test. The threshold of significance was 0.05. Survival curves were created by the Kaplan-Meier method and compared using the log-rank test. The main endpoints of the study were the diagnosis of AH in the case of non-invasive diagnosis of AH, and the 90-day mortality in the case of prognostic stratification of AH.
A logistic regression (LR) was performed to identify a predictive signature capable of distinguishing between AH and DC. A forward stepwise method was used as variable selection criterion, where the analysis started with an empty model and variables were added one at a time as long as these inclusions were worthy. Once a variable was added, the model was evaluated to ensure its discriminatory capability. This process ended when no more variables could be added. Variables with missing values were not included in the analysis as they would provide useless information in this classification method. The model was constructed in order to assign a score to each patient. In relation to this score, the probability (from 0 to 1) that an observation belonged or did not belong to a certain class was calculated. If the probability was 0, it did not belong to that class (patient without alcoholic hepatitis), while if the probability was 1, then it belonged to that class (patient with alcoholic hepatitis). In order to provide an unbiased evaluation of the model’s discrimination and accuracy, a bootstrap method was used, where patients were randomly divided into estimation (80% of the subjects, n = 72) and validation (20% of all subjects, n = 18) sets, with proportional representation of patients with AH and DC. This process was repeated 1,000 times. Receiver operating characteristic (ROC) curve analysis was used to assess the discriminatory power. Overall diagnostic accuracy for a given two-class comparison was done by the area under the ROC curve (AUROC) with its associated standard error. Sensitivity, specificity and positive and negative predictive values were calculated as averages over all 1,000 random subsampling cross-validation. The same procedure was followed to determine a predictive model of the severity of AH. The 90-day mortality was defined as the criterion for the severity of the disease. Therefore, the metabolic profile of patients that survived shorter than 90 days was compared with the metabolic profile of those with a survival longer than 90 days. As in the previous model, estimation and validation data sets were considered as the 80% and the 20% of the AH patients (51 and 13 patients, respectively), with proportional representation of the studied groups.
These calculations were performed using R v.2.14.1 (R Development Core Team, 2011) with caret, caTools and receiver operating characteristic R (ROCR) packages to produce ROC curves and AUROC estimate, and MASS package to generate the LR, or the SPSS statistical package (version 18.0; SPSS, Inc., Chicago, IL).
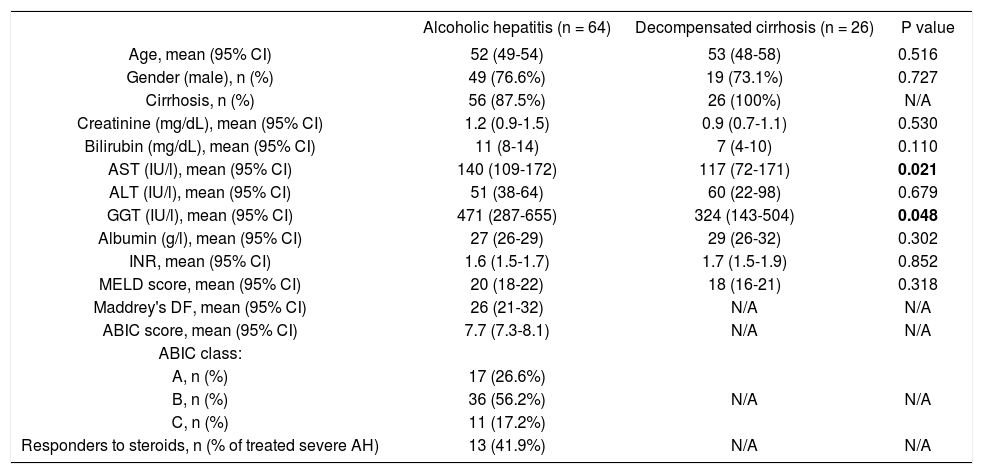
ResultsCharacteristics of the patientsMain baseline characteristics of the patients with AH and DC are listed in table 1. Age and gender were similar in both groups. Patients with AH showed higher levels of aspartate aminotransferase and gammaglutamyl transferase, while liver bilirubin and albumin levels, INR, creatinine levels and MELD score were similar in both groups. 87.5% of the patients with AH fulfilled histological criteria of liver cirrhosis. Among the patients with AH, 26.6% were classified in the low risk group, 56.2% in the moderate risk group, and 17.2% in the high risk group, according to the ABIC score. 31 out of the patients with severe AH were treated with corticosteroids, and 41.9% were considered responders as defined by a Lille model > 0.45. Overall 90-day mortality of patients with AH was 23.4%.
Baseline characteristics of patients with alcoholic hepatitis or decompensated alcoholic cirrhosis included in the study.
| Alcoholic hepatitis (n = 64) | Decompensated cirrhosis (n = 26) | P value | |
|---|---|---|---|
| Age, mean (95% CI) | 52 (49-54) | 53 (48-58) | 0.516 |
| Gender (male), n (%) | 49 (76.6%) | 19 (73.1%) | 0.727 |
| Cirrhosis, n (%) | 56 (87.5%) | 26 (100%) | N/A |
| Creatinine (mg/dL), mean (95% CI) | 1.2 (0.9-1.5) | 0.9 (0.7-1.1) | 0.530 |
| Bilirubin (mg/dL), mean (95% CI) | 11 (8-14) | 7 (4-10) | 0.110 |
| AST (IU/l), mean (95% CI) | 140 (109-172) | 117 (72-171) | 0.021 |
| ALT (IU/l), mean (95% CI) | 51 (38-64) | 60 (22-98) | 0.679 |
| GGT (IU/l), mean (95% CI) | 471 (287-655) | 324 (143-504) | 0.048 |
| Albumin (g/l), mean (95% CI) | 27 (26-29) | 29 (26-32) | 0.302 |
| INR, mean (95% CI) | 1.6 (1.5-1.7) | 1.7 (1.5-1.9) | 0.852 |
| MELD score, mean (95% CI) | 20 (18-22) | 18 (16-21) | 0.318 |
| Maddrey's DF, mean (95% CI) | 26 (21-32) | N/A | N/A |
| ABIC score, mean (95% CI) | 7.7 (7.3-8.1) | N/A | N/A |
| ABIC class: | |||
| A, n (%) | 17 (26.6%) | ||
| B, n (%) | 36 (56.2%) | N/A | N/A |
| C, n (%) | 11 (17.2%) | ||
| Responders to steroids, n (% of treated severe AH) | 13 (41.9%) | N/A | N/A |
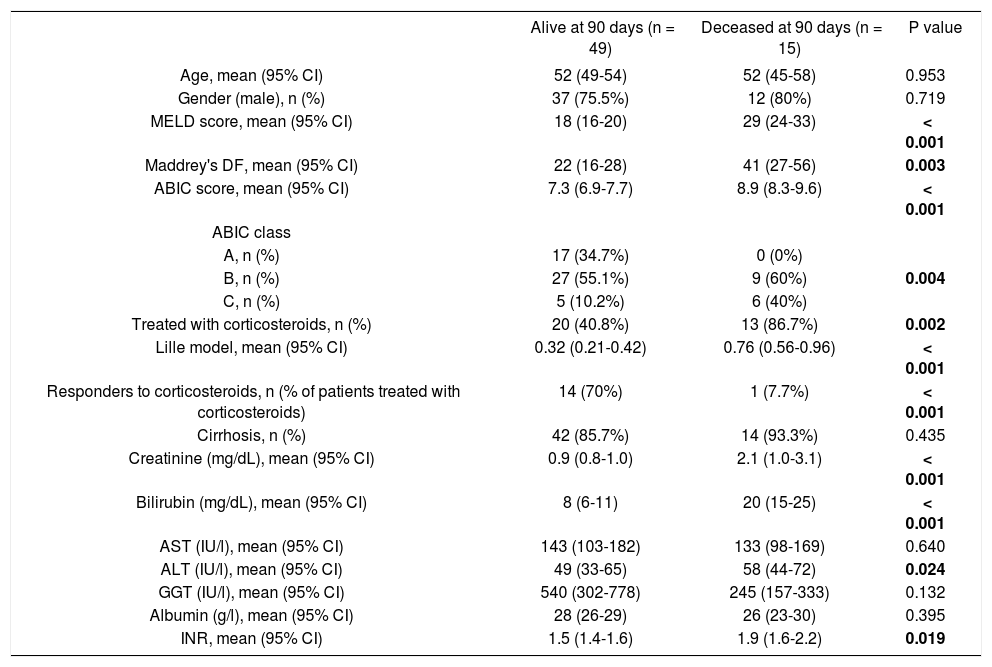
When focusing on patients with AH, there were no differences in age, gender or proportion of cirrhotic patients between those who died before the 90-day follow up and those who remained alive. However, early death patients had higher bilirubin, aspartate aminotransferase and creatinine levels and enlarged INR than those who survived, resulting in higher ABIC and MELD scores as well as in higher Maddrey’s DF (Table 2). Among the patients that were treated with corticosteroids, the proportion of responders according to the Lille model was higher in patients with a survival period longer than 90 days.
Baseline characteristics of patients with alcoholic hepatitis according to 90-day survival. Alive
| Alive at 90 days (n = 49) | Deceased at 90 days (n = 15) | P value | |
|---|---|---|---|
| Age, mean (95% CI) | 52 (49-54) | 52 (45-58) | 0.953 |
| Gender (male), n (%) | 37 (75.5%) | 12 (80%) | 0.719 |
| MELD score, mean (95% CI) | 18 (16-20) | 29 (24-33) | < 0.001 |
| Maddrey's DF, mean (95% CI) | 22 (16-28) | 41 (27-56) | 0.003 |
| ABIC score, mean (95% CI) | 7.3 (6.9-7.7) | 8.9 (8.3-9.6) | < 0.001 |
| ABIC class | |||
| A, n (%) | 17 (34.7%) | 0 (0%) | |
| B, n (%) | 27 (55.1%) | 9 (60%) | 0.004 |
| C, n (%) | 5 (10.2%) | 6 (40%) | |
| Treated with corticosteroids, n (%) | 20 (40.8%) | 13 (86.7%) | 0.002 |
| Lille model, mean (95% CI) | 0.32 (0.21-0.42) | 0.76 (0.56-0.96) | < 0.001 |
| Responders to corticosteroids, n (% of patients treated with corticosteroids) | 14 (70%) | 1 (7.7%) | < 0.001 |
| Cirrhosis, n (%) | 42 (85.7%) | 14 (93.3%) | 0.435 |
| Creatinine (mg/dL), mean (95% CI) | 0.9 (0.8-1.0) | 2.1 (1.0-3.1) | < 0.001 |
| Bilirubin (mg/dL), mean (95% CI) | 8 (6-11) | 20 (15-25) | < 0.001 |
| AST (IU/l), mean (95% CI) | 143 (103-182) | 133 (98-169) | 0.640 |
| ALT (IU/l), mean (95% CI) | 49 (33-65) | 58 (44-72) | 0.024 |
| GGT (IU/l), mean (95% CI) | 540 (302-778) | 245 (157-333) | 0.132 |
| Albumin (g/l), mean (95% CI) | 28 (26-29) | 26 (23-30) | 0.395 |
| INR, mean (95% CI) | 1.5 (1.4-1.6) | 1.9 (1.6-2.2) | 0.019 |
The entire metabolic profile of the AH and DC patients is depicted in the heat map of figure 1A, containing all the relative ion abundance levels of the metabolites for each individual patient. A total of 468 metabolites were analyzed, involving 21 amino acids and 447 lipids (77 fatty acyls, 68 glycerolipids, 226 glycerophospholipids, 43 sphingolipids and 33 sterol lipids).
 the entire metabolic profile of patients with alcoholic hepatitis (AH) and decompensated alcoholic cirrhosis (DC). Each data point corresponds to the relative ion abundance of a given metabolite (vertical axis; ordered by metabolite chemical group and according to their carbon number and unsaturation degree of their acyl chains) in an individual patient’s (horizontal axis; ordered by disease: yellow, DC; green, AH) serum extract. The scale indicates for each metabolite, its relative ion abundance in the serum extract of a given subject with respect to that found in the rest of the study population, as represented by the 10th-100th percentiles; (B) the differences between AH and decompensated alcoholic cirrhosis; (C) the differences in patients with AH according to 90-day survival. The log2 transformed ion abundance ratios (colors from green to red show drops or elevations of the metabolite levels in AH patients or severe-AH, respectively) and unpaired Student’s t-test (or Welch’s t test where unequal variances were found) p-values (grey lines correspond to significant fold changes of individual metabolites) per metabolite are displayed for both comparisons. AA: amino acids. FA: fatty acids. oxFA: oxidized FA. AC: acylcarnitines. FAA: primary fatty amides. DG: diacylglycerols. TG: triacylglycerols. ChoE: cholesteryl esters. BA: bile acids. ST: steroids. DAPE: diacyl-phosphatidylethanolamines (PE). MEMAPE: monoacyl:monoether-PE. MAPE: monoacyl-PE. MEPE: monoether-PE. DAPC: diacyl-phosphatidylcholines (PC). MEMAPC: monoacyl:monoether-PC. MAPC: monoacyl-PC. MEPC: monoether-PC. DAPI: diacyl-phosphatidylinositols (PI). MAPI: monoacyl-phosphatidylinositols. Cer: ceramides. SM: sphingomyelins. CMH: monohexosylceramides. FSB: free sphingoid bases.")
Heatmaps of (A) the entire metabolic profile of patients with alcoholic hepatitis (AH) and decompensated alcoholic cirrhosis (DC). Each data point corresponds to the relative ion abundance of a given metabolite (vertical axis; ordered by metabolite chemical group and according to their carbon number and unsaturation degree of their acyl chains) in an individual patient’s (horizontal axis; ordered by disease: yellow, DC; green, AH) serum extract. The scale indicates for each metabolite, its relative ion abundance in the serum extract of a given subject with respect to that found in the rest of the study population, as represented by the 10th-100th percentiles; (B) the differences between AH and decompensated alcoholic cirrhosis; (C) the differences in patients with AH according to 90-day survival. The log2 transformed ion abundance ratios (colors from green to red show drops or elevations of the metabolite levels in AH patients or severe-AH, respectively) and unpaired Student’s t-test (or Welch’s t test where unequal variances were found) p-values (grey lines correspond to significant fold changes of individual metabolites) per metabolite are displayed for both comparisons. AA: amino acids. FA: fatty acids. oxFA: oxidized FA. AC: acylcarnitines. FAA: primary fatty amides. DG: diacylglycerols. TG: triacylglycerols. ChoE: cholesteryl esters. BA: bile acids. ST: steroids. DAPE: diacyl-phosphatidylethanolamines (PE). MEMAPE: monoacyl:monoether-PE. MAPE: monoacyl-PE. MEPE: monoether-PE. DAPC: diacyl-phosphatidylcholines (PC). MEMAPC: monoacyl:monoether-PC. MAPC: monoacyl-PC. MEPC: monoether-PC. DAPI: diacyl-phosphatidylinositols (PI). MAPI: monoacyl-phosphatidylinositols. Cer: ceramides. SM: sphingomyelins. CMH: monohexosylceramides. FSB: free sphingoid bases.
Metabolic profiles of AH and DC serum samples revealed differences between both diseases, as well as among AH patients depending on the 90-day survival. Figures 1B and 1C illustrate these differences, showing the averageion abundance for the comparisons AH/DC and 90-day mortality/survival of AH patients, respectively. For the comparison between AH and DC cohorts, almost all ether-linked lysoglycerophospholipids levels were higher in DC patients than in those with AH, including all ether families analyzed in the serum samples: monoetherglycerophosphoethanolamines and monoetherglycerophosphocholines, considering both ether and vinyl ether lipids (Figures 1B). Cholesteryl esters showed the same trend, although only those with esterified acyl chains shorter than 18 carbons were significantly different. Interestingly, the essential polyunsaturated linoleic (18:2n-6) acid was significantly augmented in AH patients (p < 0.05). Linoleic acid is especially important because it is required for the synthesis of arachidonic acid (20:4n-6), the precursor of eicosanoids. Finally, the level of most of triacylglycerols was increased in patients with AH, being the most significant differences for those with longer esterified chains and unsaturations.
AH cohort also disclosed metabolic differences depending on the 90-day mortality (Figure 1C). Similarly to the previous comparison, differences in the cholesteryl esters were remarkable. Patients who died during the first 90 days showed significantly lower levels of most of the cholesteryl esters analyzed in comparison to those who survived. The same trend was observed for several diacyl-, monoacyl-, and mainly monoetherglycerophosphocholines, including both ether and vinyl ether lipids.
Non-invasive diagnostic and prognostic signaturesOnce the differences in the serum metabolic profiles were established, the predictive ability was assessed for both comparisons. Then, LR model was calculated to identify a predictive signature capable of distinguishing between AH and DC. The forward stepwise method finished after the inclusion of four metabolites, all of them lysoglycerophosphatidylcholines. The AUROC of the obtained model was 0.932 (95% CI 0.901-0.963). ROC curve was also calculated as the average over 1,000 random subsampling cross-validation (Figure 2A). As a result, the AUROC was 0.907 in the validation and the accuracy, sensitivity, specificity, positive and negative predictive values were 0.869, 0.742, 0.933, 0.834 and 0.897, respectively.
. The AUROC in the 1000 random subsampling cross-validation was 0.907 and the accuracy, sensitivity, specificity, positive and negative predictive values were 0.869, 0.742, 0.933, 0.834, and 0.897, respectively. B. ROC curve for the comparison of patients with alcoholic hepatitis according to 90-day survival. The AUROC was 0.963 (95% CI 0.895 1.000). The corresponding AUROC in the 1000 random subsampling cross-validation was 0.945, and the accuracy, sensitivity, specificity, positive and negative predictive values were 0.891, 0.733, 0.939, 0.757 and 0.920, respectively.")
ROC curve for the comparison of patients with alcoholic hepatitis and patients with decompensated alcoholic cirrhosis. The AUROC of the obtained signature was 0.932 (95% CI 0901 0.963). The AUROC in the 1000 random subsampling cross-validation was 0.907 and the accuracy, sensitivity, specificity, positive and negative predictive values were 0.869, 0.742, 0.933, 0.834, and 0.897, respectively. B. ROC curve for the comparison of patients with alcoholic hepatitis according to 90-day survival. The AUROC was 0.963 (95% CI 0.895 1.000). The corresponding AUROC in the 1000 random subsampling cross-validation was 0.945, and the accuracy, sensitivity, specificity, positive and negative predictive values were 0.891, 0.733, 0.939, 0.757 and 0.920, respectively.
The same procedure was followed to define a predictive model of 90-day mortality, as the criterion to determine the severity of the disease. Four lipid metabolites were included in the LR model, belonging to FA (one metabolite) and to lysoglycerophosphatidylcholines (three metabolites, one of them etherand other vinyl etherlinked) families. The AUROC of the obtained model was 0.963 (95% CI 0.895 1.000). As in the previous model, ROC curve was also calculated as the average over 1000 random subsampling cross-validation (Figure 2B). The corresponding AUROC was 0.945, and the accuracy, sensitivity, specificity, positive and negative predictive values were 0.891, 0.733, 0.939, 0.757 and 0.920, respectively.
The metabolic signature generated for the prognostic stratification of AH was a good predictor of mortality among patients with AH. 90-day mortality was 7.8% among patients classified as low risk according to the metabolic signature, while high risk patients showed a 90-day mortality of 84.6% (p = 0.001) (Figure 3). Among patients with high mortality risk according to the predictive signature, infections were the main immediate cause of death, often complicated with acute kidney injury or multiple organ failure. Four out of the eleven patients with a survival shorter than 90 days were diagnosed of respiratory infections, one of abdominal focus septic shock, one of spontaneous bacteremia and another one suffered multiple infections (in-hospital pneumonia, spontaneous bacterial peritonitis and urinary tract infection). Of note, two of the patients were diagnosed of aspergillosis, one of them with pulmonary involvement and the second one with pulmonary aspergillosis and brain abscesses. Two of the patients did not present an identifiable infection. In one case the death was attributed to type 1 hepatorenal syndrome and in the other case to sever liver failure, with hepatic encephalopathy and acute kidney injury. Among patients classified in the low risk group by the metabolic signature, four of the patients died by day 90. In two of the cases in hospital pneumonia was identified as the immediate cause of death, complicated with septic shock or multiple organ failure. One patient presented type 1 hepatorenal syndrome, and the last patient was diagnosed of multiple organ failure in the context of severe liver dysfunction.
.")
The signature also showed a good correlation with the current prognostic scores. High risk patients according to its metabolic profile showed significantly higher mean values of ABIC score (9.11 vs. 7.43, p < 0.001), MELD score (29 vs. 18, p < 0.001) and Maddrey’s DF (45 vs. 22, p = 0.001). When all the AH patients in the study cohort were considered, the metabolomic prognostic signature showed a significantly better performance than the usual AH prognostic scores for the prediction of 90-day mortality. The AUROC of the metabolomic signature was 0.963 (95% CI 0.917-1.000), while the AUROC of ABIC score, MELD score and Maddrey’s DF was 0.827 (95% CI 0.7220.931), 0.863 (0.767-0.958), and 0.754 (0.630-0.877), respectively (Figure 4). Moreover, when only considering ABIC class B patients (n = 36), the metabolomic prognostic model also predicted mortality in this subset of patients. Two out of 29 patients (6.9%) with a low risk metabolic profile died before 90 days, while 90-day mortality was 100% among the 7 patients classified in the high risk group (p < 0.001) (Figure 5A). The AUROC of the metabolomic prognostic signature to predict 90-day mortality in ABIC B patients was 0.967 (95% CI 0.907-1.000, p < 0.001) (Figure 5B). Finally, the prognostic signature also predicted the response to corticosteroids as assessed by the Lille model. 33 of the patients with alcoholic hepatitis received treatment with corticosteroids. 22 out of them were considered low risk by the prognostic signature, while 11 were stratified as high risk. According to the Lille model, the response rate was 64% in the low risk group vs. 9% among high risk patients (p = 0.003).
 for the prediction of 90-day mortality in alcoholic hepatitis. The corresponding AUROC were 0.963 (95% CI 0.917-1.000, p < 0.001), 0.827 (95% CI 0.722-0.931, p < 0.001), 0.863 (95% CI 0.767-0.958, p < 0.001) and 0.754 (95% CI 0.630-0.877, p = 0.003), respectively.")
Comparison of the ROC curves of the metabolomic prognostic signature, the ABIC score, the MELD score and Maddrey’s discriminant function (DF) for the prediction of 90-day mortality in alcoholic hepatitis. The corresponding AUROC were 0.963 (95% CI 0.917-1.000, p < 0.001), 0.827 (95% CI 0.722-0.931, p < 0.001), 0.863 (95% CI 0.767-0.958, p < 0.001) and 0.754 (95% CI 0.630-0.877, p = 0.003), respectively.
. B. ROC curve of the metabolomic prognostic signature for the prediction of 90-day mortality in patients with alcoholic hepatitis ABIC class B. The AUROC was 0.967 (95% CI 0.907-1.000, p < 0.001).")
90-day survival of patients with alcoholic hepatitis ABIC class B according to the metabolomic prognostic signature. 90-day survival was 93,1% in the low risk group vs. 0% in the high risk group (p < 0.001). B. ROC curve of the metabolomic prognostic signature for the prediction of 90-day mortality in patients with alcoholic hepatitis ABIC class B. The AUROC was 0.967 (95% CI 0.907-1.000, p < 0.001).
Most of the patients in with alcoholic hepatitis in our cohort had underlying liver cirrhosis. However, the presence or absence of cirrhosis did not seem to affect the accuracy of the prognostic signature. 44 out of the 56 patients with alcoholic hepatitis and underlying liver cirrhosis were classified in the low risk group while 12 patients were classified as high risk. 90 day mortality was significantly different between both groups: 9.1 vs. 83.3% in the low and high risk group, respectively (p < 0.001). Despite the low number of patients with alcoholic hepatitis without underlying cirrhosis present in the study cohort, the prognostic signature also found significant differences on 90-day mortality between low risk patients and those classified as high risk. All the 7 patients in the low risk group survived longer than 90 days, while the only patient with alcoholic hepatitis without underlying liver cirrhosis classified as high risk died by day 90 (p = 0.008).
DiscussionAlcoholic hepatitis is the most severe manifestation of alcoholic liver disease and despite the advances in the knowledge of its pathophysiology there are still important unresolved issues in the diagnosis and management of these patients. The need of histological diagnosis of AH remains controversial. However, histology enables differentiation of AH from decompensated alcoholic cirrhosis and, in addition, allows grading the severity of AH and to establish the prognosis as demonstrated by a recent score.9 Different non-invasive methods have been proposed to confirm the diagnosis of AH and, among them, a breath analysis of volatile organic compounds has been proposed recently.15 Several prognostic scores have been developed to predict short-term mortality and to identify patients who may benefit for specific therapy. However, sometimes it is difficult to establish the prognosis in patients with an intermediate severity. Metabolomics is a novel approach that combined with high-throughput technologies such as UHPLC-MS and could be very useful to address these remaining issues, and this was the aim of the current study.
One of the main results of the present study is the development of a non-invasive AH diagnostic model able to discriminate patients with a biopsy-proven AH from those with decompensated alcoholic liver cirrhosis without superimposed AH. This is a first step to develop a reliable metabolomic-based non-invasive AH diagnostic tool, which may avoid misdiagnosing this condition and homogenize the inclusion of patients in prospective studies when liver biopsy is not readily available. Moreover, this metabolomic profile provides important information about the physiopathology of AH. For example, the etherlinked phospholipids are synthesized in the peroxisomes.16 Because of peroxisomal and mitochondrial functions are strongly connected, changes in the ether lipids levels evidence an altered extramitochondrial / peroxisomal activity. In addition, the current results show evidence for the alterations of triacylglycerols, which were increased in AH in comparison to DC patients. Furthermore, the significant increase of several polyunsaturated FA (PUFA) may reveal alterations in the synthesis of inflammatory mediators. In fact, enzymes involved in PUFA synthesis are also important regulators among others of plasma and tissue fatty acid composition, de novo lipogenesis and gluconeogenesis.17 Further studies should investigate the pathogenic role of these mediators, which could represent new targets for therapy.
Another important finding of our study is the performance of our metabolomics signature in predicting patients’ short-term survival. This signature, which includes 4 metabolites, was able to accurately stratify AH patients into high and low mortality groups. Currently, models based on biochemical and/or clinical variables are used to establish the severity of an episode of AH. These methods are more simple and available than the model based on metabolic profiling. However, the metabolomic model has shown a better performance to predict mortality in AH than the current severity scores. Moreover, as aforementioned, these scores fail to accurately classify the severity of some cases of AH. The metabolomic signature may complement the previous scores and allow a more accurate prediction of mortality of patients with, otherwise, indeterminate prognosis, in a stepwise approach to risk stratification. For instance, ABIC class B patients, with intermediate mortality, can be accurately stratified in two well defined groups, with high and low mortality risk. In addition to risk stratification, AH prognostic scores are useful tools to indicate specific pharmacological therapy (i.e. corticosteroids). There are also models that assess the response to therapy such as the Lille score,13 which allows the stratification of severe AH patients treated with corticosteroids into responders and non-responders after one week of treatment. It would be of great interest to be able to predict the response to corticosteroids before starting the treatment, in order to better define which patients would benefit from them. The early identification of nonresponders may avoid the exposure to adverse events of these patients, who may be candidates for new therapeutic strategies in the setting of clinical trials. Although the prognostic signature predicts the response to corticosteroids as assessed by the Lille model, it is possible that it is a confounding bias, since both metabolic signature and Lille model predict mortality. Therefore, the usefulness of the metabolic profile to address the indication and the prediction of the response to steroid therapy is an extremely interesting clinical and practical point that deserves future research in specifically designed prospective studies.
In addition to its clinical relevance to assess the prognosis of patients with AH, the metabolic profile also provides important information about the metabolic routes related to the severity of an episode of AH. The implication of ether glycerophospholipid families in the inflammation and oxidation processes clearly highlights the importance of the changes observed in these metabolites in the prognosis of patients with AH. As the ether-linked lipids in plasma are predominantly synthesized in the liver, their measurement can reflect the severity of the hepatic alterations.18 Moreover, this information could be useful for the development of novel targeted therapies.
The different metabolic profiles of patients with alcoholic liver disease with and without superimposed AH found in the present study is consistent with those described in an article by Rachakonda, et al.19 Their results revealed alterations in pathways related to lipid metabolism, and an increment of bile acids and FA. They also found changes in the branched-chain amino acids composition that were not observed in the present study. However, our analytical approach is more complete and allows a broader coverage of the lipidome, including sphingolipids, triacylglycerols or ether-linked phospholipids that were not included in Rachakonda, et al. study. Noteworthy, there are several significant differences in the design of both studies, regarding the number, selection and diagnosis of patients. First, the sample size of the present study was larger, and included patients with AH regardless the severity as assessed by usual prognostic scores, while in the study by Rachakonda et al. only severe AH patients were included. Therefore, AH patients in the present study presented lower serum bilirubin (11 vs. 15 mg/dL) and INR (1.6 vs. 2.0) levels and higher albumin levels (27 vs. 20 g/L), resulting in a lower MELD score and Maddrey’s DF (20 vs. 26 and 26 vs. 52.9, respectively). Although the short-term mortality is relatively low in patients with non-severe AH, it is important to accurately diagnose this condition because it impacts in the long-term prognosis accelerating the progression to end stage liver disease. Moreover, the inclusion of patients covering the broad spectrum of AH allows identifying a prognostic metabolic profile which could improve the accuracy of the current clinical prognostic models. Another important difference is that in the present study all the subjects underwent a liver biopsy. Since in a non-negligible proportion of patients with clinically suspected AH the diagnosis is not confirmed by biopsy the histological confirmation of AH allows homogenizing the patient cohort and strengthening the conclusions derived from studies. Finally, in the present study decompensated alcoholic cirrhotic patients were included as control group, while the study by Rachakonda, et al. included clinically stable subjects with alcoholic cirrhosis. Many times it is difficult to establish if a cirrhotic patient with a rapid worsening of its disease has an episode of AH or only a progression of the disease, and the finding of a different metabolic profile in both conditions is clinically relevant, whereas AH can be easily differentiated from compensated cirrhosis. Another study described a metabolomic profiling of plasma capable oi accurately predicting survival in patients with DC.20 Interestingly, significantly lower levels of lysophosphatidylcholines and phosphatidylcholines were associated with 90-day mortality, which is consistent with the findings oi the present study.
Our study suggests that metabolomics is an interesting approach to non-invasively estimate the presence of AH in clinically suggestive cases and to assess the risk of mortality in patients with AH. However, although the above mentioned studies partially support our findings, the lack of an external validation cohort is an important limitation of the study, as well as a limited sample size, which may affed the statistical power and difficult the performance of subanalyses. Therefore, independent prospective studies with a bigger sample size are needed to confirm the utility of metabolomics in the setting of AH. It is worth mentioning that while the determination of both LR models was based on a complete metabolomics analysis including three different serum extracts, the resulting models include only FA and lysoglycerophosphatidylcholines, belonging to the same analytical platform. This circumstance simplifies the methodology, being more applicable into the clinica practice.
In conclusion, our study describes the metabolic signature of AH as compared with decompensated alcoholic cirrhosis as well as differences in the metabolic profile according to 90-day survival after an episode of AH. Accordingly, non-invasive AH diagnostic and prognostic signatures are proposed. These models have shown an excellent performance in the study cohort. However, further research is needed in order to confirm these findings in an independent cohort. The role of metabolomics for a better knowledge of the pathophysiology of AH and in assessing the potential benefit of steroid therapy in an individual patient also deserves further investigation.
Abbreviations- •
ABIC:age, bilirubin, INR and creatinine score.
- •
AH: alcoholic hepatitis.
- •
AUROC: area under the ROC curve.
- •
CI: confidence interval.
- •
DC: decompensated cirrhosis.
- •
FA: fatty acids.
- •
INR: international normalized ratio.
- •
LR: logistic regression.
- •
Maddrey’s DF: Maddrey’s discriminant function.
- •
MELD: model for end-stage liver disease.
- •
MS:mass spectrometry.
- •
PUFA: polyunsaturated fatty acids.
- •
ROC: receiver operating characteristic.
- •
ROCR: receiver operating characteristic R.
- •
UHPLC: ultra-high performance liquid chromatography.
The authors declares that there is no conflict of interest regarding the publication of this article.
Financial SupportThis work was supported by grants from Fondo de Investigación Sanitaria Carlos III (FIS), co-financed by Fondo Europeo de Desarrollo Regional (FEDER), Union Europea, “Una manera de hacer Europa” (FIS PI14/00320, PI12/00330, FIS PI09/01164, FIS PI12/01265 and FIS PI11/ 01990 to PS-B, PG, JC and RB respectively) and from the NIH (1U01AA021908-01-33490 to PS-B and 1U01AA021908 to RB). JM was enrolled in the Master on Research in Liver Diseases of the Universitat de Barcelona and received a Formacion del Profesorado Universitario grant of the Spanish Education Ministry. JA received a grant from Fundación Banco Bilbao Vizcaya Argentaria and was enrolled in the Master on Research in Liver Diseases of the Universitat de Barcelona. PS-B is funded by Instituto de Salud Carlos III, Miguel Servet (CP11/00071 and CON14/00129) and co-financed by Fondo Europeo de Desarrollo Europeo (FEDER), Unión Europea, “Una manera de hacer Europa”. PG is funded by Agencia de Gestió d’Ajuts Universitaris i de Recerca (AGAUR) 2014 SGR 708, Centro de Investigatión Biomedica en Red de Enfermedades Hepáticas y Digestivas (CIBEReHD) and Institució Catalana de Recerca i Estudis Avangats (ICREA). JA wishes to express his gratitude to the Mexican National Council of Science and Technology (CONACyT, Mexico City, Mexico) for partially supporting his predoctoral stay at IDIBAPS.


