


Rationale for the study. This cross-sectional multicenter study was conducted to investigate any difference in liver stiffness measurements (LSM), evaluated by transient elastography, between patients affected by β thalassaemia major, with and without hepatitis C virus (HCV) infection, and healthy blood donors (controls). Secondary aim was to assess any correlation between transient elastography and serum ferritin, liver magnetic resonance imaging (MRI) T2* or superconductive quantum interference device (SQUID) liver susceptometry values.
Materials and methods. The study involved three centers. Transient elastography and MRI T2* examinations were performed in all centers. SQUID liver susceptometry was performed in center1 and center2. T-test for independent data or Mann-Whitney U test was used to analyse differences between two groups. Univariate Pearson’s rcoefficient was used to test correlations between liver stiffness measurements and all other variables.
Results. In a study with 119 patients and 183 controls, patients who had never been infected with HCV showed significantly higher LSMs than controls [5.7 (95% CI, 5.2-6.2) kPa vs. 4.3 (95% CI, 4.1-4.4) kPa, p < 0.0001]. A moderate correlation between LSMs and ferritin values, adjusted for gender and age, was found in patients (r = 0.49, p < 0.0001) but not in controls (r = -0.22, p = 0.6). No correlation between LSMs and MRI T2* or SQUID liver susceptometry values was observed. In conclusion, compared to controls β thalassaemia major patients had a significant increase in LSMs independently from HCV infection.
Beta thalassaemia major (TM) is a hereditary anaemia caused by the absence of beta-globin chains that constrains patients to life-long periodical transfusion. Liver iron overload, both due to recurrent transfusion and increased iron gastrointestinal absorption, is a common consequence that can lead to the development of liver fibrosis.1 Patients who received blood transfusion before effective virological screening procedures were instituted could also be infected with hepatitis C virus (HCV) and their prognosis is related to the amount of fibrosis due to liver iron concentration and viral infection.1–5
Liver biopsy, which is the gold standard for the evaluation of liver fibrosis and hepatic iron overload, is an invasive and painful procedure which has several limitations. Additionally, inhomogeneous distribution of the hepatic iron can lead to under or over-estimation of the degree of iron amount.6,7
Serum ferritin is a parameter easy to obtain and it is widely used to indirectly evaluate the overall iron load. Several studies have assessed its correlation with a poor prognosis in TM patients.4,8,9 However, serum ferritin values can be influenced also by inflammation.10,11
Because liver iron concentration and total amount of iron in different tissue are critical parameters that determine clinical outcome in patients with TM, non-invasive methods for detecting iron overload -such as T2 star magnetic resonance imaging (MRI T2*) and superconductive quantum interference device (SQUID) liver susceptometry-have been developed.12–15 The parameters obtained with MRI T2* and SQUID liver susceptometry are well accepted surrogate of the liver iron concentration.16–20
The availability of new drugs for treating hepatic iron overload, together with the possibility to noninvasively diagnose iron overload, has improved the survival of patients with TM. However, the risk of developing liver fibrosis and cirrhosis is also associated with HCV infection and a correct estimate of liver fibrosis is important for accurate patient’s monitoring, prognosis assessment and follow-up. On this regard, several studies have proved that transient elastography (TE) is a reliable method to differentiate severe fibrosis from absent or milder degrees of fibrosis.21–26 Recently, it has been shown that TE is a reliable diagnostic tool to assess hepatic fibrosis also in TM patients.27–30 Nonetheless, the influence of iron overload on TE values in a large series of TM patients has not been clarified yet.
The main aim of our study was to investigate any difference in liver stiffness measurements -evaluated by transient elastography- between patients affected by β thalassaemia major, with and without HCV infection, and healthy blood donors. Secondary aim was to assess any correlation between TE, serum ferritin, MRI T2* or liver iron concentration (LIC) assessed with SQUID susceptometry.
Material and MethodsThis was a cross-sectional multicentre study. From May 2013 to January 2014, consecutive TM patients in clinical follow-up at paediatric department of Fondazione IRCCS Policlinico San Matteo (centre1), Microcitemie Unit of San Luigi Gonzaga University Hospital (centre2), and Microcitemie Unit of S. Martino Hospital (centre3) were enrolled.
Inclusion criterion was the presence of TM. Exclusion criteria were decompensated liver cirrhosis, pregnancy, and age younger than 10 years because for children under that age it could be difficult to stay still without sedation during the magnetic resonance examination. HCV infection status was assessed by HCV-RNA. One hundred and nineteen patients with TM were enrolled: 32 in centre1, 41 in centre2 and 46 in centre3.
Total iron load was evaluated by means of serum ferritin whereas the iron load in the liver was assessed with hepatic MRI T2* and SQUID liver susceptometry.
TE and MRI T2* examinations were performed in all the three centres. TE examinations were carried out by two experienced operators (RL and MZ) in patients referring to centre1 and centre3, and by one experienced operator (FL) in patients referring to centre2. SQUID liver susceptometry examinations were performed only in patients followed up at centre1 and centre2 by an experienced operator (FL). Serum ferritin, MRI T2* and LIC values were analysed only when they were obtained within six months from non-invasive liver stiffness evaluation.
Subject characteristics, epidemiological data, and biochemical parameters were recorded.
A ferritin value ≥ 500 ng/mL was considered indicative of iron overload.
The TE results obtained in TM patients were compared to that of a control group that was constituted of blood donors regularly followed with laboratory investigations, including testing for infection by hepatotropic viruses, at centre1. All blood donors had normal values of aminotransferases and none of them had a history of liver disease or were using medication. The alcohol intake was < 20 g/day for all of them. Liver disease was ruled out by patient’s history, normal laboratory values and findings of normal liver size, smooth liver surface, sharp liver edge and normal parenchymal echo-texture on conventional ultrasound. The blood donors were part of a series of subjects whose data have already been reported in a published study aimed at assessing the reproducibility of the controlled attenuation parameter.31
MRI T2*MRI T2* liver examinations were performed using the Philips Achieva 1.5 Tesla MR systems (Philips Healthcare, the Netherland) in centre1 and centre2, and Siemens Avanto RM 1.5 Tesla system (Siemens Healthcare, Germany) in centre3. The procedure was performed according to previous report.32 Normal values were ≥ 6.3 ms.
SQUID liver susceptometrySQUID liver susceptometry is able to evaluate the responses of tissue to an applied magnetic field. The values are related to the magnetic properties of the tissue. The response of iron stored in ferritin and hemosiderin deposits is directly correlated to the iron concentration. The procedure was performed according to Fischer, et al.15 using Model 5700 Tristan Technology, San Diego, California. Three measurements for each patient were obtained. Normal LIC values were ≤ 1.2 mg/g dry weight (dw).2,17
Transient elastographyTE was performed using the FibroScan device (Echosens, Paris, France). The physicians performing all the examinations had experience of at least two years. All participants were studied by using the M probe of the Fibroscan device after fasting for at least 6 h. Measurements were performed following the examination procedure described elsewhere.21 Only patients with 10 validated liver stiffness measurements (LSM)s and interquartile range less than 30% of the median LSM value were included.25 A cut-off value < 7.0 kilopascal (kPa) was considered indicative for not significant fibrosis.24
The study protocol was approved by the institutional Ethics Committee of Fondazione IRCCS Policlinico San Matteo. The study was performed in accordance with the Helsinki Declaration of 1975. CT and LS analysed the data. All authors had access to the data. Participants gave their informed written consent.
Statistical analysisDescriptive statistics were produced for demographic characteristics for this study sample of patients. The Shapiro-Wilk test was used to test the normal distribution of quantitative variables. When quantitative variables were normally distributed, the results were expressed as the mean value and standard deviation (SD), otherwise median and interquartile range (IQR; 25th–75th percentile) were reported. T-test for independent data or Mann-Whitney U test was used to analyse differences between two groups, depending on the data distribution; ANOVA analysis (or equivalent non-parametric Kruskal-Wallis test for skewed distribution) was used for more than two groups. Qualitative variables were summarized as counts and percentages and differences were analysed with χ2 test. Univariate Pearson’s r coefficient was used to test correlations between LSMs and all other variables, and a log transformation was performed if they were not normally distributed. Furthermore, as age and gender could be associated with LSMs,32–34 all correlations were examined with multivariable linear regression models to adjust for possible confounders due to these two variables. P < 0.05 was considered statistically significant. All tests were two-sided. The data analysis was been performed with the STATA statistical package (release 13.1, 2014, Stata Corporation, College Station, Texas, USA).
ResultsFifty-nine of 119 patients had splenectomy during childhood or young adulthood. All patients were receiving regular blood transfusion to maintain pre-transfusional haemoglobin values at 9-9.5 g/L and were treated with iron chelating therapy as follows: 61/119 (51.3%) with deferasirox; 12/119 with deferoxamina; 8/119 with deferiprone; 38/119 with combined therapy. The overall adherence to iron chelating therapy was > 90% in 108/119 patients. None patient showed clinical signs of cardiac insufficiency.
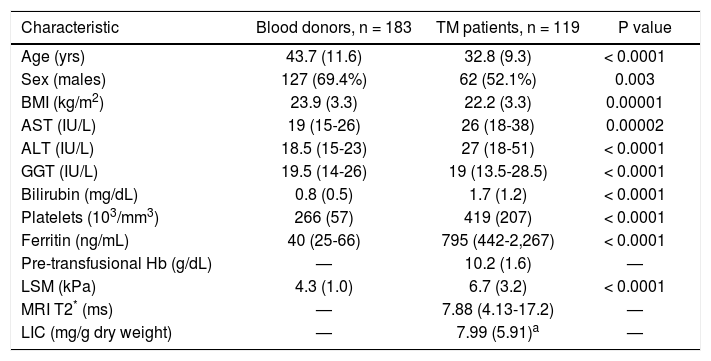
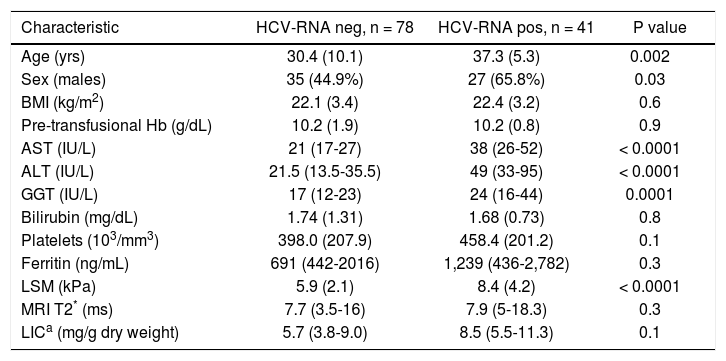
Fifty-two of 119 TM patients had never been infected with HCV; 41/119 were chronically infected with HCV; 26/119 were anti-HCV positive but not viremic because 17 of them had spontaneously cleared the C virus and nine had successfully been treated and had achieved viral clearance. The parameters obtained in the study cohort are reported in table 1 and the parameters obtained in TM patients with and without active HCV infection are reported in table 2.
Main clinical and demographic characteristics of the study population.
| Characteristic | Blood donors, n = 183 | TM patients, n = 119 | P value |
|---|---|---|---|
| Age (yrs) | 43.7 (11.6) | 32.8 (9.3) | < 0.0001 |
| Sex (males) | 127 (69.4%) | 62 (52.1%) | 0.003 |
| BMI (kg/m2) | 23.9 (3.3) | 22.2 (3.3) | 0.00001 |
| AST (IU/L) | 19 (15-26) | 26 (18-38) | 0.00002 |
| ALT (IU/L) | 18.5 (15-23) | 27 (18-51) | < 0.0001 |
| GGT (IU/L) | 19.5 (14-26) | 19 (13.5-28.5) | < 0.0001 |
| Bilirubin (mg/dL) | 0.8 (0.5) | 1.7 (1.2) | < 0.0001 |
| Platelets (103/mm3) | 266 (57) | 419 (207) | < 0.0001 |
| Ferritin (ng/mL) | 40 (25-66) | 795 (442-2,267) | < 0.0001 |
| Pre-transfusional Hb (g/dL) | — | 10.2 (1.6) | — |
| LSM (kPa) | 4.3 (1.0) | 6.7 (3.2) | < 0.0001 |
| MRI T2* (ms) | — | 7.88 (4.13-17.2) | — |
| LIC (mg/g dry weight) | — | 7.99 (5.91)a | — |
Main demographic and clinical characteristics of the HCV-RNA negative and positive TM patients.
| Characteristic | HCV-RNA neg, n = 78 | HCV-RNA pos, n = 41 | P value |
|---|---|---|---|
| Age (yrs) | 30.4 (10.1) | 37.3 (5.3) | 0.002 |
| Sex (males) | 35 (44.9%) | 27 (65.8%) | 0.03 |
| BMI (kg/m2) | 22.1 (3.4) | 22.4 (3.2) | 0.6 |
| Pre-transfusional Hb (g/dL) | 10.2 (1.9) | 10.2 (0.8) | 0.9 |
| AST (IU/L) | 21 (17-27) | 38 (26-52) | < 0.0001 |
| ALT (IU/L) | 21.5 (13.5-35.5) | 49 (33-95) | < 0.0001 |
| GGT (IU/L) | 17 (12-23) | 24 (16-44) | 0.0001 |
| Bilirubin (mg/dL) | 1.74 (1.31) | 1.68 (0.73) | 0.8 |
| Platelets (103/mm3) | 398.0 (207.9) | 458.4 (201.2) | 0.1 |
| Ferritin (ng/mL) | 691 (442-2016) | 1,239 (436-2,782) | 0.3 |
| LSM (kPa) | 5.9 (2.1) | 8.4 (4.2) | < 0.0001 |
| MRI T2* (ms) | 7.7 (3.5-16) | 7.9 (5-18.3) | 0.3 |
| LICa (mg/g dry weight) | 5.7 (3.8-9.0) | 8.5 (5.5-11.3) | 0.1 |
LIC was estimated in 71 patients (44 HCV-RNA negative and 27 HCV-RNA positive). TM: β thalassaemia major. BMI: body mass index. AST: aspartate aminotransferase. ALT: alanine aminotransferase. GGT: gamma glutamyl transpeptidase. HCV: (hepatitis C virus. Hb: haemoglobin. LSM: iiver stiffness measurement. MRI T2
LSMs were performed in all the 119 TM patients and the 183 subjects of the control group. No failure or unreliable measurements were obtained in TM patients whereas 2 failures occurred in the control group. No statistically significant differences were observed between the LSMs obtained in the three centres. A significant fibrosis (LSM ≥ 7.0 kPa) was present in 40/119 TM patients: 23/40 were chronically infected with HCV; 10/40 had never been infected with HCV, 4/40 had spontaneously cleared the C virus, and 3/40 were sustained responders to antiviral treatment.
Serum ferritin values were available for all but one TM patients and for all controls. In one TM patient the serum ferritin value was obtained more than six months before the TE examination, thus it was not included in the statistical analysis. Thirty-four of 118 patients had values ≤ 500 ng/mL. No statistically significant difference between the mean serum ferritin values of TM patients with and without HCV infection was found [1,239 (IQR: 436- 2,782) ng/ mL vs. 691 (IQR: 442-2,016) ng/mL, p = 0.3]. Patients who had splenectomy presented higher serum ferritin values compared to the other TM patients, but this difference was not statistically significant [725 (IQR, 354-2776) ng/mL vs. 555 (IQR, 398-881) ng/mL, p = 0.2].
Four patients didn’t undergo to MRI T2* examination because of the young age (n = 1) or the presence of metal plaque (n = 3). Ten cases were excluded from the statistical analysis because the examination was performed more than six months before LSM. Thus, MRI T2* values were analysed in 105 patients. No statistically significant difference was found between the values obtained in the three centres. Sixty-three (60.0 %) patients had a normal amount of iron in the liver as assessed by MRI T2*. No statistically significant difference between the values obtained in patients with and without HCV infection was found [7.9 (IQR, 5-18.3) ms vs. 7.7 (IQR, 3.5- 16.0) ms, p = 0.3]. Patients who had splenectomy presented higher MRI T2* values compared to the other TM patients, but the difference was not statistically significant [8.8 (IQR, 5.2-19.5) ms vs. 7.1 (IQR, 3.3- 14.1) ms, p = 0.6].
SQUID liver susceptometry was performed in all 73 patients of centre1 and centre2. It was unsuccessful in two patients for inability to hold the breath during the procedure, thus the results obtained in 71 patients were analysed. All but one patient presented LIC values above the normal range. There was not a statistically significant difference between the LIC values obtained in patients of the centre1 and those of centre2. LIC value was slightly higher in patients with HCV infection, but this difference did not reach a statistical significance [8.5 (IQR, 5.5-11.3) mg/gr/dw vs. 5.7 (IQR, 3.8-9.0) mg/gr/dw, p = 0.1]. No statistically significant difference between the LIC values obtained in patients with and without splenectomy was found [6.6 (IQR, 4.4-9.6) mg/gr/dw vs. 6.6 (IQR, 5.1-11.8) mg/gr/dw, p = 0.6].
LSM values in TM patientsLSMs obtained in the TM patients with and without HCV infection and in the subjects of the controls group are reported in figure 1. As reported in the literature,32–34 we also found that females presented lower values of LSM both in the TM patients and the controls; thus, the results were adjusted by gender. All differences were statistically significant (p < 0.0001) except for LSMs differences in TM females with and without HCV infection that showed only a trend toward significance (p = 0.05). Moreover, the 52 TM patients who had never been infected with HCV presented significantly higher LSMs compared to the controls [5.7 (95% CI, 5.2-6.2) kPa vs. 4.3 (95% CI, 4.1-4.4) kPa, p < 0.0001]. With respect to the controls, the mean increase of LSM in TM patients not chronically infected with HCV was 2.4 (95% CI, 1.6-3.3) kPa (p < 0.0001) in males and 1.6 (95% CI, 0.8-2.5) kPa (p < 0.0001) in females. In TM patients with HCV infection the mean increase of LSM was 5.3 (95% CI, 4.4-6.2) kPa (p < 0.0001) in males and 2.7 (95% CI, 1.5-3.8) kPa (p < 0.0001) in females. In the controls the difference in LSMs between males and females was not statistically significant [0.4 kPa (95% CI, -0.3-1.0; p = 0.2)].
Correlations
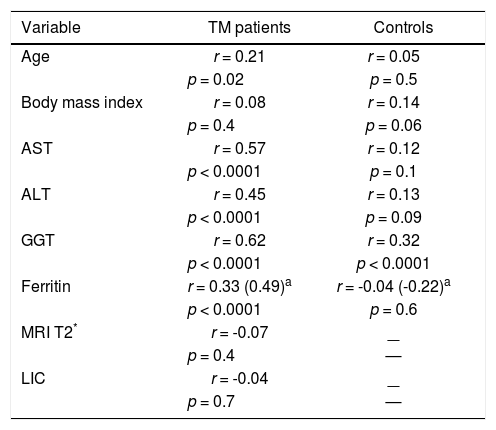
In univariate analysis LSM showed a fair correlation with the age, and a high correlation with AST and ALT in the TM patients but not in the controls. LSM showed a strong correlation with GGT in the TM patients and a weak correlation in the controls. A weak correlation with the serum ferritin, which increased after adjustment for age and gender, was found in TM patients (Figure 2). No correlation with all other variables was found in the TM patients or in the controls. The corresponding r values for the correlations between LSMs and the other variables in the TM patients and in the controls are reported in table 3. MRI T2* and LIC values showed a moderate correlation with serum ferritin (r = -0.47, p < 0.0001 and r = 0.47, p <0.0001, respectively). A weak correlation between MRI T2* and LIC values was found (r = -0.38, p = 0.002) whereas a lack of correlation between LSM and MRI T2* or LIC values was observed.

Correlations between liver stiffness measurements and other variables in the TM patients and in the controls.
| Variable | TM patients | Controls |
|---|---|---|
| Age | r = 0.21 | r = 0.05 |
| p = 0.02 | p = 0.5 | |
| Body mass index | r = 0.08 | r = 0.14 |
| p = 0.4 | p = 0.06 | |
| AST | r = 0.57 | r = 0.12 |
| p < 0.0001 | p = 0.1 | |
| ALT | r = 0.45 | r = 0.13 |
| p < 0.0001 | p = 0.09 | |
| GGT | r = 0.62 | r = 0.32 |
| p < 0.0001 | p < 0.0001 | |
| Ferritin | r = 0.33 (0.49)a | r = -0.04 (-0.22)a |
| p < 0.0001 | p = 0.6 | |
| MRI T2* | r = -0.07 | — |
| p = 0.4 | — | |
| LIC | r = -0.04 | — |
| p = 0.7 | — |
The results of this study showed that, compared to the controls, TM patients had a significant increase in liver stiffness independently from the HCV infection. To the best of our knowledge, this is the first study aimed at comparing the results of LSMs in TM patients to that of a control group. It should be underlined that, compared to the TM patients, the controls were older and had a higher BMI. It has been reported that age does not affect the liver stiffness whereas subjects with a high BMI could have an increase of LSM.33–35 However, in our series neither age nor BMI were correlated with LSMs results in the controls, whereas a correlation with age but not with BMI was found in TM patients. This relationship could be due to the significant increase in liver stiffness of HCV-infected TM patients, who were also significantly older compared to the other TM patients.
In the series of Di Marco, et al.29 the TM patients free of HCV infection showed a mean LSM of 5.2 kPa. This value is higher than that obtained in healthy volunteers.33,34 As observed in our series, a significant difference in LSMs between TM patients infected with HCV and those free of infection was observed.
In our series, serum ferritin was correlated with LSMs, MRI T2* and LIC values. A positive correlation of LSMs with serum ferritin has also been found in other studies.27,36 LSMs did not show any correlation with the values obtained with MRI T2* or SQUID liver susceptometry, techniques that have been shown to be accurate in the assessment of iron overload. This finding is similar to that of Fraquelli, et al.27 who did not find any correlation between TE and MRI T2* in a series of 115 patients with β thalassaemia major or intermedia. Likewise, in the study of Di Marco, et al.29 liver stiffness increased proportionally to liver fibrosis staging independently from liver iron concentration. Also in the series of Poustchi, et al.30 the increase in LSMs in patients with thalassaemia and HCV infection was independent of MRI T2* values. The only study with different results is that of Sinakos, et al.37 who found a correlation of LSM with MRI T2* values in a cohort of 49 TM patients without HCV infection.
We believe that the lack of correlation between MRI T2* or LIC values and LSMs could mean that the storage of iron in the liver does not directly influence the stiffness, whereas the increase in liver stiffness could be explained by the effects of iron on the liver cells. Indeed, it has been shown that iron determines multiple cellular lesions and pathological changes that may lead to liver fibrosis.5,38,39 The increase in liver stiffness occurred despite the fact that in our cohort the overall adherence to iron chelating therapy was > 90% in 108/119 patients and the MRI T2* values were within the normal range in 60% of cases.
As expected, the TM patients with HCV infection showed higher LSMs compared to the TM patients free of infection and they were older. Due to repeated blood transfusion, TM patients were at high risk of HCV infection before blood screening for the virus was available. In our series, none patient born after 1983 was infected with HCV. TM patients with HCV infection showed higher values of serum ferritin, even though the difference with TM HCV-negative patients was not statistically significant. This finding is in accordance with literature data that have shown an increase of serum ferritin in chronic viral hepatitis.40 In our series 40 (33.6%) patients showed LSMs ≥ 7 kPa, which is a cut-off value for significant fibrosis in patients with chronic hepatitis C.24 It is of note that, in our cohort, 25% of TM patients with significant fibrosis had never been infected with HCV and another 10% had spontaneously cleared the C virus. Thus, the increase in LSMs in these patients is related to factors other than viral infection. On the other hand, we may have underestimate the liver fibrosis because the threshold for the detection of significant fibrosis in TM patients could be different depending to different HCV status. In fact, in the series of Mirault, et al.,28 that comprised patients without detectable HCV-RNA, a cut-off value of 6.25 kPa was able to predict severe fibrosis.
Our study has limitations. First, we did not compare the results of non-invasive assessment of liver fibrosis or hepatic iron overload to that of liver biopsy. Nonetheless, the accuracy of TE in the assessment of liver fibrosis in TM patients as well as that of MRI T2* or SQUID liver susceptometry in quantifying hepatic iron overload have been assessed in previous studies. Furthermore, the value of TE in discriminating different stages of liver fibrosis in TM patients was not the aim of our study. Second, SQUID liver susceptometry was not performed in all patients. It should be noted that the SQUID liver susceptometry is a technique available only in few centres around the world.
ConclusionIn conclusion, the liver stiffness is increased in TM patients free of HCV infection. Follow up studies will clarify whether the increase in liver stiffness in TM patients for whom iron overload is the only risk factor for liver fibrosis - is stable over time.
Abbreviations- •
dw: dry weight.
- •
HCV: hepatitis C virus.
- •
IQR: interquartile range.
- •
kPa: kiloPascal.
- •
LIC: liver iron concentration.
- •
LSM: liver stiffness measurement.
- •
MRI T2*: T2 star magnetic resonance imaging.
- •
SD: standard deviation.
- •
SQUID: superconductive quantum interference device.
- •
TE: transient elastography.
- •
TM: beta thalassaemia major.
There was no funding for this research.
AcknowledgmentsThe authors would like to thank all the collaborators of the “Liver Fibrosis Study Group”: Elisabetta Above, MD; Giorgio Barbarini, MD; Raffaele Bruno, MD; Silvia Corona, MSc; Carolina Dellafiore, MD; Marta Di Gregorio, MD; Roberto Gulminetti, MD; Paolo Lanzarini, MD; Serena Ludovisi, MD; Laura Maiocchi, MD; Antonello Malfitano, MD; Giuseppe Michelone, MD; Lorenzo Minoli, MD; Mario U. Mondelli, MD; Stefano Novati, MD; Savino F.A. Patruno, MD; Gianluigi Poma, MD; Paolo Sacchi, MD; Domenico Zanaboni, MD.
The authors would also like to thank Ms. Nadia Locatelli, the secretary of the Ultrasound Unit, for her valuable help in complying with the study protocol.


