


We aimed to study the liver iron concentration in patients referred for hyperferritinemia to six hospitals in the Basque Country and to determine if there were differences between patients with or without metabolic syndrome.
Patients and methodsMetabolic syndrome was defined by accepted criteria. Liver iron concentration was determined by magnetic resonance imaging.
ResultsWe obtained the data needed to diagnose metabolic syndrome in 276 patients; a total of 135 patients (49%), 115/240 men (48%), and 20/36 women (55.6%) presented metabolic syndrome. In all 276 patients, an MRI for the determination of liver iron concentration (mean±SD) was performed. The mean liver iron concentration was 30.83±19.38 for women with metabolic syndrome, 38.84±25.50 for men with metabolic syndrome, and 37.66±24.79 (CI 95%; 33.44–41.88) for the whole metabolic syndrome group. In 141 patients (51%), metabolic syndrome was not diagnosed: 125/240 were men (52%) and 16/36 were women (44.4%). The mean liver iron concentration was 34.88±16.18 for women without metabolic syndrome, 44.48±38.16 for men without metabolic syndrome, and 43.39±36.43 (CI 95%, 37.32–49.46) for the whole non-metabolic syndrome group. Comparison of the mean liver iron concentration from both groups (metabolic syndrome vs non-metabolic syndrome) revealed no significant differences (p=0.12).
ConclusionsPatients with hyperferritinemia and metabolic syndrome presented a mildly increased mean liver iron concentration that was not significantly different to that of patients with hyperferritinemia and non-metabolic syndrome.
The prevalence of metabolic syndrome (MtS) in the general population in Spain and in the adult population of Western countries is approximately 25% [1–3]. Hyperferritinemia (HF) is frequently associated with MtS and this clinical existence is named dysmetabolic hyperferritinemia (DH) [4]. Patients with DH might have normal or raised liver iron concentrations (LIC) [4–6]. Hepcidin levels are raised in DH [4,7], therefore we would not expect a liver iron overload.
The studies on this syndrome have selected patients with liver iron overload [4]. However, the prevalence of liver iron overload in unselected patients with HF and metabolic syndrome has rarely been studied [4–6]. A study from Canada [4] found that DH was associated with a normal transferrin saturation index (TSI), mild hepatic iron overload, and elevated hepcidin, generally with a normal LIC. A Norwegian team [5] studied a group of 40 patients with HF. They diagnosed 18 patients with DH and only reported liver iron overload determined by a liver biopsy in one case.
Recently, a study was carried out by our group in a secondary hospital of the Basque Country [6]. In a cohort of 132 consecutive patients with HF attending a clinic of hepatology (totally different cohort of patients with respect to the present study's cohort), 97 had sufficient data to determine the presence of MtS. Patients with DH (54/97) presented a mean LIC within normal values and their values did not differ from those of patients with HF but without MS (43/97). This work confirmed that of the Canadian study [4] and provides further evidence that LIC might not be elevated in patients with HF and MtS. An Editorial commented that, given the trend towards statistical significance (p=0.067), the differences in LIC between MtS and non MtS patients should be further studied on a large scale with a greater power to further define this relationship [8].
Our aim was to study the LIC using an accurate magnetic resonance imaging (MRI) determination method [9] in patients referred for HF to six hospitals in the Basque Country (Spain), and to determine if there are differences between patients with MtS (DH) or without MtS.
2Patients and methods2.1PatientsThis was a prospective study including patients referred for HF from December 2010 to April 2013, which was designed to develop and validate a diagnostic algorithm for high iron overload based on laboratory and genetic variables [10]. Another objective of the study, and the aim of this work, was to study the LIC in these patients to determine if there are any differences between patients with or without MtS. The study was conducted across six hospitals in the Basque Country; Donostia University Hospital, Galdakao Hospital, Cruces University Hospital, Mondragon Hospital, Bidasoa Hospital, and Mendaro Hospital
Inclusion criteria: Consecutive outpatients referred for HF (serum ferritin (SF)>200μg/L in women, >300μg/L in men) [11] were included if they were older than 18 years of age, had HF confirmed by a second extraction, had HFE gene studies, and LIC confirmed by MRI.
Exclusion criteria: Patients younger than 18 years of age, or those with HF unconfirmed by a second extraction, TSI<20%, claustrophobia, cancer, chornic inflammatory diseases or chronic infections, or renal or neoplastic diseases wer eexcluded (excluded by clinical, laboratory, and radiologic methods).
2.2Methods2.2.1RadiologyMRI images were recorded with a 1.5-T systems (Philips Intera, Osatek, Donostia-Donostia University Hospital and Cruces University Hospital; Siemens Synphony, Osatek, in Galdakao Hospital and Gasteiz Hospital). The MRI technique used (Signal intensity ratio—SIR—method) has previously been proposed by our group [9]. We systematically performed T1-weighted in-phase and opposed-phase imaging to discard liver steatosis. All iron quantification sequences were in-phase sequences in order to make sure that fat did not interfere with the signal intensity measurements [12]. The LIC calculated using this model has a high correlation with biochemical measurements obtained by atomic spectrometry of liver biopsy samples (r=0.937) [9]. The LIC was considered as: normal (<36μmol/g), iron overload (IO) (37–80μmol/g), and high iron overload (HIO) (>80μmol/g) [9]. The proposed method for calculating LIC is reproducible in different 1.5T systems [13].
2.2.2Laboratory measurementsSF, serum iron (Fe), and TSI were determined from blood samples taken during fasting from all patients included in the study. All of them were found to have raised SF values of >300μg/L—the laboratory normal range for SF is 15–200μg/L in women and 30–300μg/L in men [6,11]. The ranges considered to be normal for Fe and TSI were 50–145μg/dL and 15–45%, respectively [6].
The serum values for glucose, cholesterol, HDL-cholesterol, triglycerides, ALT, AST, and GGTP were determined from the same blood samples.
DNA was extracted from the blood samples and HFE gene analysis was carried out by multiplex real-time PCR using LightCycler technology (LC 1.0). The simultaneous study of HFE C282Y, H63D, and S65C mutations was performed in a single capillary using LC-Red 640, LC-Red 705, and fluorescein-labelled hybridisation probes (Tibmolbiol, Berlin, Germany). A melting curve analysis was performed to distinguish wild type and mutant alleles in each case [6,14].
2.2.3Definition of MtSWe employed the Joint Interim Statement Criteria for MtS (International Diabetes Federation Task Force on Epidemiology and Prevention; National Heart, Lung, and Blood Institute; American Heart Association; World Heart Federation; International Atherosclerosis Society; and International Association for the Study of Obesity) [15]. MtS was defined by the presence of three or more of the following factors:
- -
Waist circumference≥94cm in men; ≥80cm in women, and two of the following factors:
- -
Triglycerides ≥150mg/dL, or treatment for this dyslipidaemia
- -
HDL<40mg/dL in women, <50mg/dL in men, or treatment for this dyslipidaemia
- -
Glucose≥100mg/dL or Type 2 diabetes
- -
Hypertension: systolic pressure ≥130mm Hg; diastolic pressure ≥85mm Hg, or treatment for arterial hypertension.
Stata 14.2 software (StataCorp. 2015. Stata Statistical Software: Release 14. StataCorp LP, College Station, TX, USA) was used to perform the appropriate statistical analyses. Mean values with range and standard deviation were calculated for continuous variables and frequencies and percentages for categorical variables.
To compare LIC mean values in patients with MtS and without MtS, we used a Student's T test. In all the analyses, a p<0.05 value was considered statistically significant.
Post hoc power calculation: our best estimates of the LIC value in both groups (MtS, NMtS) based on our previous work [6], with α=0.15, β=0.20, LIC difference=6, with SD=19, is 318 (159 per group). We have study 312 patients (totally different cohort of patients from the present one), with 276 patients included in this study (with all the requiered data for mtS estimation). The statistical power (0.74) is marginally lower tan the standard 0.80
2.2.5EthicsThis study was approved 14-12-2010 by the CEIC-comité ético de investigación clínica-of gipuzkoa (Acta n°11/2010)).
3Results3.1PatientsOut of 312 patients, we had sufficient data to determine the MtS presence in 276 patients (Fig. 1). The mean age was 54.35±13.55 years (range 19–86).
3.2Clinical and laboratory data
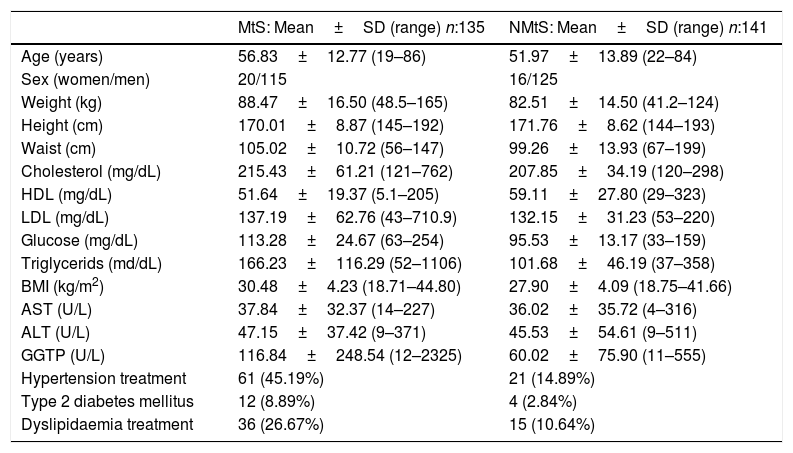
Principal clinical and laboratory data are presented in Table 1.
Principal clinical and laboratory data.
| MtS: Mean±SD (range) n:135 | NMtS: Mean±SD (range) n:141 | |
|---|---|---|
| Age (years) | 56.83±12.77 (19–86) | 51.97±13.89 (22–84) |
| Sex (women/men) | 20/115 | 16/125 |
| Weight (kg) | 88.47±16.50 (48.5–165) | 82.51±14.50 (41.2–124) |
| Height (cm) | 170.01±8.87 (145–192) | 171.76±8.62 (144–193) |
| Waist (cm) | 105.02±10.72 (56–147) | 99.26±13.93 (67–199) |
| Cholesterol (mg/dL) | 215.43±61.21 (121–762) | 207.85±34.19 (120–298) |
| HDL (mg/dL) | 51.64±19.37 (5.1–205) | 59.11±27.80 (29–323) |
| LDL (mg/dL) | 137.19±62.76 (43–710.9) | 132.15±31.23 (53–220) |
| Glucose (mg/dL) | 113.28±24.67 (63–254) | 95.53±13.17 (33–159) |
| Triglycerids (md/dL) | 166.23±116.29 (52–1106) | 101.68±46.19 (37–358) |
| BMI (kg/m2) | 30.48±4.23 (18.71–44.80) | 27.90±4.09 (18.75–41.66) |
| AST (U/L) | 37.84±32.37 (14–227) | 36.02±35.72 (4–316) |
| ALT (U/L) | 47.15±37.42 (9–371) | 45.53±54.61 (9–511) |
| GGTP (U/L) | 116.84±248.54 (12–2325) | 60.02±75.90 (11–555) |
| Hypertension treatment | 61 (45.19%) | 21 (14.89%) |
| Type 2 diabetes mellitus | 12 (8.89%) | 4 (2.84%) |
| Dyslipidaemia treatment | 36 (26.67%) | 15 (10.64%) |
LDL: low density lipoprotein; HDL: high density lipoprotein.
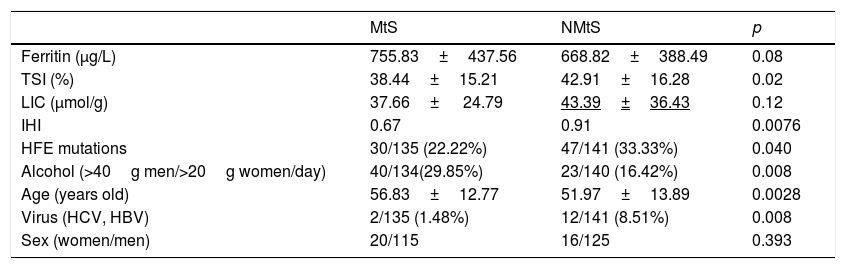
MtS [15] was detected in 48% of men and 55.6% of women, which corresponded overall to 49% of the HF patients. In the NMtS group, 52% of men and 44.4% of women had MtS. There were significant differences between the two groups (MtS vs NMtS) with respect to their iron hepatic index, HFE mutations, alcohol consumption, age, and viral serology (Table 2). Only alcohol consumption was higher in MtS group. No liver biopsies were taken during the study period. An alcohol consumption cut-off of >40g/day for men and 20g/day for women was applied [16].
HFE predisposing mutations, alcohol consumption, age, virus serology and sex distribution in both groups from the 276 patients studied with all data for MS study.
| MtS | NMtS | p | |
|---|---|---|---|
| Ferritin (μg/L) | 755.83±437.56 | 668.82±388.49 | 0.08 |
| TSI (%) | 38.44±15.21 | 42.91±16.28 | 0.02 |
| LIC (μmol/g) | 37.66± 24.79 | 43.39±36.43 | 0.12 |
| IHI | 0.67 | 0.91 | 0.0076 |
| HFE mutations | 30/135 (22.22%) | 47/141 (33.33%) | 0.040 |
| Alcohol (>40g men/>20g women/day) | 40/134(29.85%) | 23/140 (16.42%) | 0.008 |
| Age (years old) | 56.83±12.77 | 51.97±13.89 | 0.0028 |
| Virus (HCV, HBV) | 2/135 (1.48%) | 12/141 (8.51%) | 0.008 |
| Sex (women/men) | 20/115 | 16/125 | 0.393 |
Hemochromatosis predisposing mutations: C282Y/C282Y; C282Y/H63D, H63D/H63D; MtS: metabolic syndrome; NMtS: no metabolic syndrome; TSI: transferrin saturation index; LIC: liver iron concentration; IHI: iron hepatic index, (LIC/age).
The determined SF and TSI values from all the patients were compared: The SF mean value was 729.6μg/L (SD 449.6, range 80–4236) and TSI (%) mean value was 40.8% (SD 15.8, range 11–113). The TSI mean value was 42.91(SD 16.28, range 11–113) in the NMtS group vs 38.445 (SD 15.21, range 12.1–105) in the MtS group (p=0.01); the SF mean value was 668.82 (SD 388.49, range 215.8–3821) in the NMtS group vs 755.83 (SD 437.56, range 173.2–4236) in the MtS group (p=0.08).
3.3RadiologyWe obtained LIC results (μmol/g) from the 276 patients. The mean LIC in the MtS group was 30.83±19.38 (for women), 38.84±25.50 (for men), and 37.66± 24.79 (CI 95%; 33.44–41.88) for the whole MtS group. The mean LIC in the NMtS group was 34.88±16.18 (for women), 44.48±38.16 (for men), and 43.39±36.43 (IC 95%, 37.32–49.46) for the whole NMtS group. We compared the mean LIC values from both groups (MS vs NMS) using a Student's T test; no significant differences were observed (p=0.12).
The distribution of patients from the two groups (MtS/NMtS) among the LIC categories was as follows: LIC<36μmol/g: 154/276 (55.79%)—normal (NMtS: 76; MS: 78), LIC 36–80μmol/g: 102/276 (36.95%)—iron overload (NMtS: 55; MS: 47), LIC>80μmol/g: 20/276 (7.24%)—high iron overload or phenotypic hemochromatosis (NMtS: 10; MS: 10). The hepatic iron index (LIC/age) values were higher than 1.9 in 12 patients (3.9%).
Out of 312 patients with HF, an MRI scan for the presence of liver steatosis was performed in 286 patients [12]: 196 had no steatosis and 90 had liver steatosis.
In the 35 remaining patients MRI for LIC determination was obtained, but LS cualitative study was not performed.
There were 251 patients with sufficient data to determine the MtS presence, and MRI revealed no steatosis in 175 and liver steatosis in 76 patients (30.27%). In the NMtS group (128 patients), there was no steatosis in 103 patients and steatosis in 25 (19.5%). In the MtS group (123 patients), there was no steatosis in 72 and steatosis in 51 (41.5%). The higher frequency of liver steatosis in the MtS group was statistically significant (p=0.000).
3.3.1HFE mutation analysisThe HFE gene mutations study was carried out across all 276 patients and the results were as follows: wt/wt 77 (27.89%), H63D/wt 94 (34.05%), C282Y/wt 15 (5.43%), C282Y/H63D 21 (7.60%), H63D/H63D 43 (15.57%), C282Y/C282Y 13 (4.71%), S65C/wt 10 (3.62%), H63D/S65C 2 (0.72%), and C282Y/S65C 1 (0.36%).
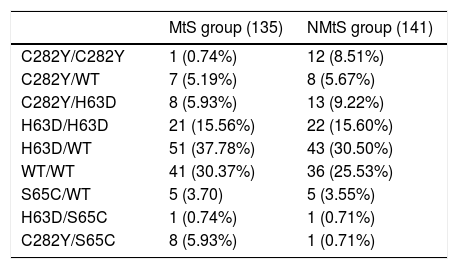
In the high iron overload (phenotypic hemochromatosis) group (LIC>80μmol/g), there were seven C282Y/C282Y patients, one H63D/H63D patient, one C282Y/S65C patient, and one H63D/wt patient in the MtS group; eight H63D/wt patients, one C282Y/H63D patient, and one H63D/H63D patient in the NMtS group. All of these patients, except one in the NMtS group, were men. The different distribution of the different mutations in the MtS and NMtS groups are presented in Table 3.
Distribution of the different mutations in metabolic syndrome (MtS) and non metabolic syndrome (NMtS) groups.
| MtS group (135) | NMtS group (141) | |
|---|---|---|
| C282Y/C282Y | 1 (0.74%) | 12 (8.51%) |
| C282Y/WT | 7 (5.19%) | 8 (5.67%) |
| C282Y/H63D | 8 (5.93%) | 13 (9.22%) |
| H63D/H63D | 21 (15.56%) | 22 (15.60%) |
| H63D/WT | 51 (37.78%) | 43 (30.50%) |
| WT/WT | 41 (30.37%) | 36 (25.53%) |
| S65C/WT | 5 (3.70) | 5 (3.55%) |
| H63D/S65C | 1 (0.74%) | 1 (0.71%) |
| C282Y/S65C | 8 (5.93%) | 1 (0.71%) |
HF is very common in clinical practice and the most frequent causes are not associated with hereditary hemochromatosis. SF is the most frequent requested hematologic analysis in the UK and approximately 50% of the requests are from primary care [17]. SF is an acute phase protein and only a minority of HF patients are homozygous for C282Y mutation in the HFE gene [18].
The commonest causes of HF without iron overload are inflammatory disorders, malignancies, chronic alcohol comsumption, liver disease, or metabolic abnormalities [17].
Hepcidin levels might be raised in DH [4,7], therefore we would not expect a liver iron overload. The increase in SF levels correlates with increased hepcidin production as well as increased levels of other inflammatory cytokines in patients with obesity and type 2 diabetes [7,19]. SF ferritin is associated with MtS and with inflammatory markers [20].
The presence of hepatic iron overload (IO) has been described in various metabolic conditions, such as insulin resistance, non-alcoholic steatohepatitis (NASH), liver steatosis (NAFLD), and MtS [21–25]. Current evidence does not support the use of phlebotomy in patients with DIOS or NAFLD[26-31] .
DH, HF associated with metabolic syndrome (MtS), a newly identified cause of raised serum ferritin, is increasingly being diagnosed in Western countries [32].
Patients with DH do not always present raised LIC [4,5]. Only a proportion of MtS patients (14.5%) seem at risk of iron overload, presenting HF [33], however, the real prevalence of liver iron overload in these patients remains unknown. Studies performed to define DH have always recruited selected patients on the basis of known liver iron overload [4]. Recently, DH has been suggested as a possible target for phlebotomy treatment [34].
There have been three previous studies that evaluated the presence of iron overload in the liver with non-selected patients. In the Canadian study [4], 7 out of 10 studied patients had “mild” hepatic iron overload, with values up to 120μmol/g. Three had normal LIC values. However, they used MRI (SIR method) for LIC determination according to the method from the Rennes University, which has a tendency to overestimate LIC [35].
In a study from Norway [5], 18 patients that fulfilled the IDF criteria for MtS were studied. The authors concluded that liver steatosis and insulin resistance, but not increased iron load, is found in patients with HF. All liver biopsies in patients meeting the MtS criteria showed steatosis, with only one showing an iron content of grade 2 (according to the Rowe method). The rest were normal (grade 0–1) for iron content. Hepatic iron overload was defined as ≥70μmol/g dry weight (grade 2+ to 4+ by the Rowe method). Out of 40 HF patients, a liver biopsy was performed in 29, with 15 hemosiderin grade 0, ten grade 2, and three grade 2.
The third study [6] developed by our group (a totally different cohort of patients with respect to the present study's cohort), in a secondary hospital of the Basque country, evaluated 97 patients with HF using clinical and laboratory data to determine if they suffered from MtS. Fifty-four patients with HF met the MtS criteria [15] and had DH, and MRI to determine the LIC was performed in 36 patients (27 men, 9 women). We compared the LIC of the DH group with that of the patients without MtS (NMtS) and HF (out of 43 patients 18 had an MRI, 13/18 were men). There were no differences between the two groups and the mean LIC values were normal [6].
Given the trend towards statistical significance, it was suggested that the differences in LIC between MtS and NMtS patients should be further studied on a large scale with a greater power to further define this relationship [8].
In this work, we studied LIC using an accurate MRI determination method [9] in patients referred for HF to six hospitals in the Basque Country (Spain), and determined whether there were differences between patients with MtS (DH) and patients without MtS. In this prospective study of 276 consecutive patients with HF, no significant differences were observed between patients with and without MtS, and the LIC was mildly increased (near the upper limit of normal values (n: 0–36μmol/g) in the MtS group.
The main limitations of our study are: the male preponderance (however this is similar to other publications, >80% male) [6], and a statistically power slightly lower than the standard (it must be bear in mind that LIC is lower in the DH group than in the NMtS group). The strengths of this study are that it presents an unselected patient population, i.e. patients with HF referred to 6 hospitals without known raised liver iron concentrations, and that it represents the highest number of patients to date with DH (135 cases). In previous unselected studies, 10, 18, and 36 patients were included [4–6].
In conclusion, this study demonstrates that patients with DH have mildly raised LICs and that the LIC values in patients with DH are not significantly different to those in patients with HF and NMtS.AbbreviationsMtS metabolic syndrome hyperferritinemia dysmetabolic hyperferritinemia liver iron concentration magnetic resonance imaging transferrin saturation index no metabolic syndrome serum ferritin iron overload high iron overload signal intensity ratio serum iron
Study design: A.C., I.U., E.Z., J.M.A., M.D.d.J., J.I.E.; acquisition of the data: A.C., E.Z., L.Z., P.O., G.L, B.A., M.L.R., A.I., L.B., N.M., B.I., A.d.J., E.S., M.D.d.J., J.M.A; analysis and interpretation of the data: I.U., A.C. J.I.E., E.Z., J.M.A.; statistical analysis: I.U., J.M.E.; drafting of the manuscript: A.C.; I.U.; E.Z.; L.Z.; P.O.; J.M.A.; J.I.E.; critical revision: A.C.; I.U.; J.I.E.
CongressPresented as an abstract at the 1st International Conference of Fatty Liver (ICFL) 2017, Seville, June 1–3, Spain; and at the 25th United European Gastroenterology Week, Barcelona, Spain, October 30–November 1, 2017.
FundingNone declared.
Conflict of interestThe authors report no conflicts of interest.
Hospital de Mendaro: Leire Zubiaurre, Eva Zapata, Agustín Castiella, Arantxa Iribarren; Hospital Universitario Donostia: Eva Zapata, Usua Mendarte, Luis Bujanda, Nerea Muro, Begoña Ibarra, M. Dolores de Juan, Iratxe Urreta, Jose I. Emparanza; Osatek Donostia: Jose M. Alústiza, Emma Salvador; Hospital de Mondragón: Pedro Otazua, Aitor de Juan; Hospital de Galdakao: Garazi Letamendi; Hospital de Cruces: Beatriz Arrizabalaga; Hospital del Bidasoa: Maria Luisa Rincón.


