


Surrogate biomarkers of liver fibrosis developed in tertiary care are increasingly used in general populations. We evaluated the association between liver stiffness (LS) and five continuous (AST/ALT, APRI, Forns Index, FIB-4, GGT) and two discrete biomarkers (BARD, BAAT) in a general population.
Patients and methods636 (29%) of the 2159 citizens of the Bagnacavallo Study had LS measured by transient elastography. Using linear regression with univariate multiple imputation, we evaluated the association of LS with the above biomarkers in the total sample of 2159 citizens.
ResultsThe mean change of LS between the 5th and 95th internal percentile of any continuous biomarker was ≤1kPa. The mean change of LS between scores 0 and 3 of BARD and scores 0 and ≥3 of BAAT was >1kPa but of doubtful clinical relevance.
ConclusionWe found a modest association between LS and seven biomarkers of liver fibrosis in a general population.
Many non-invasive serum markers of liver fibrosis have been developed in tertiary care centers using liver biopsy as the reference standard [1]. These biomarkers are increasingly used to estimate the prevalence of liver fibrosis in the general population, which is a very different setting from the one in which they were developed [2,3]. Because liver biopsy is invasive and cannot be performed outside tertiary care centers, the true prevalence of liver fibrosis in the general population is currently unknown [3,4].
Liver stiffness (LS), as measured by transient elastography (TE), is an accurate surrogate index of liver fibrosis in tertiary care centers [1]. Contrarily to liver biopsy, TE can be easily performed in the general population. While it is plausible that a “high” value of LS as detected by TE is associated with a higher probability or degree of liver fibrosis in the general population, this association cannot be evaluated against liver biopsy because of its invasiveness [3,5]. On the other hand, TE is expensive, time-consuming, and requires substantial expertise [1].
A recent study [2], pooling 6925 individuals from four countries [6–11], suggested that a TE cut-point LS of 9.1kPa can be applied to diagnose significant fibrosis (≥F2) in primary care. Expectedly, however, only a minority (5%, n=352) of the 6925 individuals had undergone liver biopsy [12]. The Rotterdam study used, instead, a cut-point of 8.0kPa to diagnose liver fibrosis, detecting it in 5.6% of 3041 consecutive participants aged ≥45 years who visited their study center [13]. Because the TE cut-point of 8.0kPa was chosen based on a previous study of patients with non-alcoholic fatty liver disease (NAFLD) performed in tertiary care [14], it was pointed out the need to consider the so-called spectrum bias, that is the fact that the performance of a diagnostic test is known to vary substantially with the prevalence of the disease [12]. In addition, one has to consider the loss of efficiency and the classification problems arising from the dichotomization of intrinsically continuous variables such as LS [15].
In the present analysis of the general population of the Bagnacavallo study [16], to avoid the problems of spectrum bias and dichotomization [12,15], we evaluated the association between LS and seven commonly employed biomarkers of liver fibrosis (AST/ALT, APRI, Forns Index, FIB-4, GGT, BARD and BAAT) using LS and all the biomarkers where this was feasible (AST/ALT, APRI, Forns Index, FIB-4, GGT) as continuous and the other biomarkers (BARD and BAAT) as discrete.
2Material and methods2.1Study designThe protocol and the primary outcome of the Bagnacavallo study are reported in detail elsewhere [16]. The study was approved by the Ethical Committee of Area Vasta Romagna – IRST (reference number 112), and all subjects gave their written informed consent. Briefly, 3933 citizens of Bagnacavallo (Ravenna, Italy) aged 30–60 years, were studied between October 2005 and March 2009. Altered liver enzymes (ALE) were defined as alanine transaminase (ALT)>40U/l and/or aspartate transaminase (AST)>37U/l, i.e. the upper limit of normal (ULN) of the laboratory. After the exclusion of subjects with HBV infection, HCV infection, and lack of ultrasonography, the main Bagnacavallo analysis was performed on 349 ALE+ and 1810 ALE− citizens [16]. The same 2159 (349+1810) citizens were analyzed here. 636 (29%) of them had consecutively undergone TE between November 2008 and March 2009 [17].
(A previous analysis of TE in the Bagnacavallo cross-section was performed only in a subsample of 331 “healthy” subjects selected among 780 citizens who had undergone TE between October 2008 and May 2009 [17]. Our starting sample of citizens with TE availability (n=636) is lower than that employed in the previous report (n=780) [17] because of different selection criteria [16]. The present analysis was performed by strictly applying the designed criteria of the Bagnacavallo Study [16]).
2.2Clinical and laboratory assessmentAll participants underwent a detailed clinical history and physical examination, as described in detail elsewhere [18]. Alcohol intake was assessed by interview [16]. Weight and height were measured following international guidelines [19], and waist circumference was measured at the midpoint between the last rib and the iliac crest [18]. Body mass index (BMI) was calculated as weight (m)/height (m)2 and classified according to the National Institutes of Health (NIH) guidelines [20]. The performed blood tests included: (1) glucose; (2) triglycerides; (3) total cholesterol; (4) high-density lipoprotein (HDL) cholesterol; (5) low-density lipoprotein (LDL) cholesterol; (6) ALT; (7) AST; (8) GGT; (9) platelets. The metabolic syndrome (MS) was diagnosed using the harmonized international definition [21].
2.3Liver ultrasonographyLiver ultrasonography was performed by five experienced physicians, as described in detail elsewhere [16]. After the exclusion of HBV and HCV infection, NAFLD was defined as fatty liver (FL) associated with ethanol intake ≤20g/day in women and ≤30g/day in men [22].
2.4Transient elastographyLS (kPa) was measured with FibroScan (Echosens, Paris, France) by two experienced operators. All measurements were performed with the M probe because the XL probe, which was developed specifically for obese individuals [1], was not available when the study was performed. LS was measured on the right hepatic lobe through intercostal spaces with the patient lying in dorsal decubitus position and with the right arm maximally abducted [1]. Following current recommendations, a measurement was considered valid if it was repeated at least 10 times, and the [(75th−25th percentile)/median ratio] was ≤0.30 [1].
2.5BiomarkersWe calculated all the biomarkers of liver fibrosis that could be obtained from the Bagnacavallo study database: (1) AST/ALT ratio; (2) APRI; (3) Forns index; (4) FIB-4; (5) GGT; (6) BARD; (7) BAAT [1].
2.6Statistical analysis2.6.1Descriptive statisticsMost continuous variables were not Gaussian-distributed and all are reported as median (50th percentile) and interquartile range (IQR; 25th and 75th percentiles). Discrete variables are reported as the number and proportion of subjects with the characteristic of interest. Between-group comparisons of discrete variables were performed using Pearson's Chi-square test and those of continuous variables using median regression with heteroskedasticity-robust standard errors [18,23].
2.6.2Regression modelingThe relationship between LS and each of the seven biomarkers was quantified using a multivariable linear regression model (LRM) with robust confidence intervals [24]. The LRM used LS (continuous, kPa) as response variable and ALE (discrete, 0=no; 1=yes) and the biomarker of interest as predictors. All the biomarkers were modeled as continuous, with the exception of BARD and BAAT, which are intrinsically discrete [1]. ALE was used as predictor because of the design of the Bagnacavallo study, which enrolled separately ALE+ and ALE− citizens [16]. Because LS was available only for 636 (29%) of the 2159 citizens and had a univariate missingness pattern [25], we fitted the LRM using multiple imputation (MI) estimates of LS [26].
2.6.3Multiple imputationUnder the assumption that LS was missing at random (MAR), we used univariate multiple imputation (MI) to create several complete versions of LS by replacing its missing values with plausible data values [27]. Theoretically, when the complete-data model is an LRM with outcome Y and predictors Xs and the missing data occur in Y only as in the present case, complete case analysis (CCA) and MI are equivalent [26,28]. However, MI gains an advantage over CCA if additional predictors of Y are available that are not part of Xs, as it is the case for the present analysis [26,28]. Following current guidelines, we nonetheless performed a CCA and compared its findings to those of MI [27]. The target variable of the MI model was LS and the predictors were the seven biomarkers (AST/ALT, APRI, Forns index, FIB-4, GGT, BARD and BAAT) in addition to the other variables available in the study database (sex, age, weight, height, BMI, waist circumference, glucose, triglycerides, cholesterol, HDL-cholesterol, LDL-cholesterol, systolic blood pressure, diastolic blood pressure, ALT, AST, GGT, platelets, alcohol intake, fatty liver, metabolic syndrome and its components). Because LS had a non-Gaussian distribution, it was imputed using predictive mean matching with 5 knots on 100 MI datasets and the Abayomi procedure was used to check the agreement between the observed, imputed and complete values [26,29]. The imputer and the analyst were the same person and the scope of the MI model was narrow, i.e. it was devised for testing only the present study hypothesis [26]. Taking into account the design of the Bagnacavallo study, MI was performed separately in ALE+ and ALE− citizens [26]. We checked the linearity of the association of LS with the continuous biomarkers of liver fibrosis using fractional polynomials for MI [30]. Evidence of non-linearity was detected only for GGT, which was transformed using natural logarithms (lnGGT). To aid the clinical interpretation of the results, we calculated and plotted the marginal probabilities of LS corresponding to the 5th, 25th, 50th, 75th and 95th internal percentile of each biomarker for ALE+ and ALE− citizens [31,32]. Statistical analysis was performed using Stata 16.1 (Stata Corporation, College Station, TX, USA).
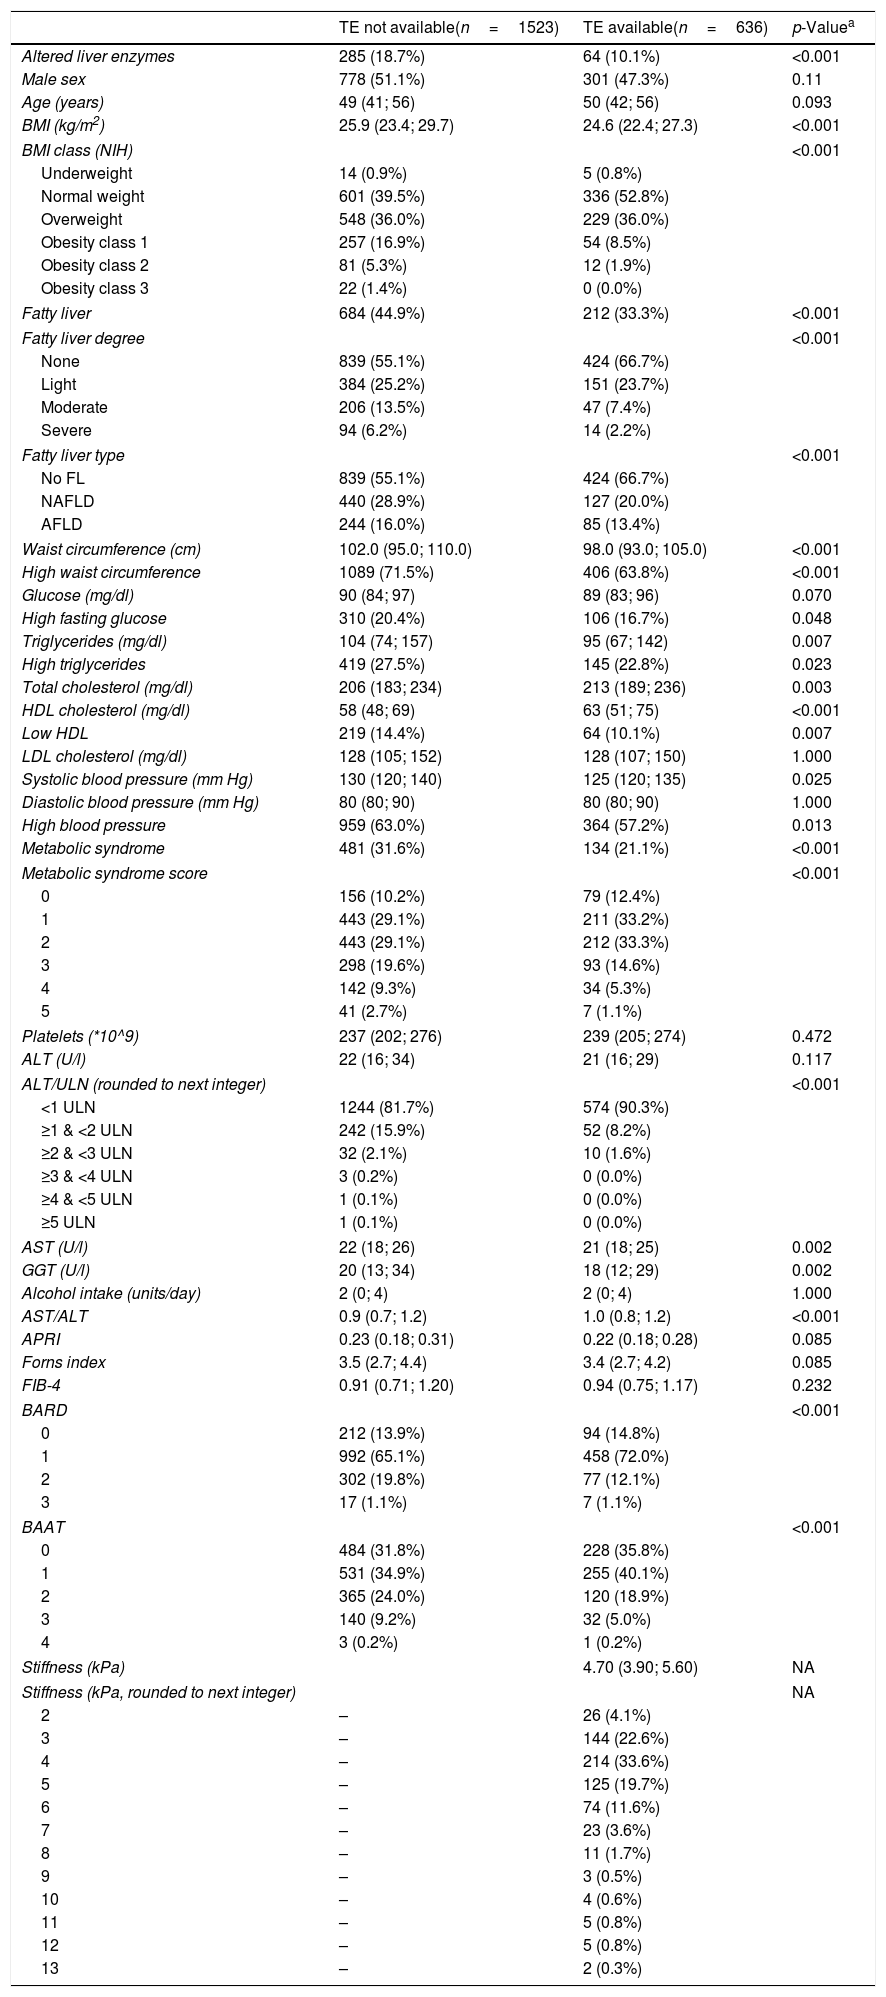
3ResultsTable 1 compares the features of the citizens with (n=636) and without (n=1523) TE. This comparison is aimed at studying the pattern of missing data and at identifying their potential predictors [26,27]. The interpretation of this data must take into account the fact that the Bagnacavallo study was designed to perform liver ultrasonography in 100% of ALE+ and in 50% of ALE− citizens, reaching 97% of the former and 52% of the latter [16]. Thus, ALE+ citizens were virtually sampled in their entirety by the study design. No patient had decompensated liver cirrhosis, heart failure, or ALT greater than five times the ULN.
Measurements of the subjects with and without availability of transient elastography (FibroScan). Continuous variables are reported as 50th, 25th and 75th percentiles. Discrete variables are reported as the number and proportion of subjects with the characteristic of interest.
| TE not available(n=1523) | TE available(n=636) | p-Valuea | |
|---|---|---|---|
| Altered liver enzymes | 285 (18.7%) | 64 (10.1%) | <0.001 |
| Male sex | 778 (51.1%) | 301 (47.3%) | 0.11 |
| Age (years) | 49 (41; 56) | 50 (42; 56) | 0.093 |
| BMI (kg/m2) | 25.9 (23.4; 29.7) | 24.6 (22.4; 27.3) | <0.001 |
| BMI class (NIH) | <0.001 | ||
| Underweight | 14 (0.9%) | 5 (0.8%) | |
| Normal weight | 601 (39.5%) | 336 (52.8%) | |
| Overweight | 548 (36.0%) | 229 (36.0%) | |
| Obesity class 1 | 257 (16.9%) | 54 (8.5%) | |
| Obesity class 2 | 81 (5.3%) | 12 (1.9%) | |
| Obesity class 3 | 22 (1.4%) | 0 (0.0%) | |
| Fatty liver | 684 (44.9%) | 212 (33.3%) | <0.001 |
| Fatty liver degree | <0.001 | ||
| None | 839 (55.1%) | 424 (66.7%) | |
| Light | 384 (25.2%) | 151 (23.7%) | |
| Moderate | 206 (13.5%) | 47 (7.4%) | |
| Severe | 94 (6.2%) | 14 (2.2%) | |
| Fatty liver type | <0.001 | ||
| No FL | 839 (55.1%) | 424 (66.7%) | |
| NAFLD | 440 (28.9%) | 127 (20.0%) | |
| AFLD | 244 (16.0%) | 85 (13.4%) | |
| Waist circumference (cm) | 102.0 (95.0; 110.0) | 98.0 (93.0; 105.0) | <0.001 |
| High waist circumference | 1089 (71.5%) | 406 (63.8%) | <0.001 |
| Glucose (mg/dl) | 90 (84; 97) | 89 (83; 96) | 0.070 |
| High fasting glucose | 310 (20.4%) | 106 (16.7%) | 0.048 |
| Triglycerides (mg/dl) | 104 (74; 157) | 95 (67; 142) | 0.007 |
| High triglycerides | 419 (27.5%) | 145 (22.8%) | 0.023 |
| Total cholesterol (mg/dl) | 206 (183; 234) | 213 (189; 236) | 0.003 |
| HDL cholesterol (mg/dl) | 58 (48; 69) | 63 (51; 75) | <0.001 |
| Low HDL | 219 (14.4%) | 64 (10.1%) | 0.007 |
| LDL cholesterol (mg/dl) | 128 (105; 152) | 128 (107; 150) | 1.000 |
| Systolic blood pressure (mm Hg) | 130 (120; 140) | 125 (120; 135) | 0.025 |
| Diastolic blood pressure (mm Hg) | 80 (80; 90) | 80 (80; 90) | 1.000 |
| High blood pressure | 959 (63.0%) | 364 (57.2%) | 0.013 |
| Metabolic syndrome | 481 (31.6%) | 134 (21.1%) | <0.001 |
| Metabolic syndrome score | <0.001 | ||
| 0 | 156 (10.2%) | 79 (12.4%) | |
| 1 | 443 (29.1%) | 211 (33.2%) | |
| 2 | 443 (29.1%) | 212 (33.3%) | |
| 3 | 298 (19.6%) | 93 (14.6%) | |
| 4 | 142 (9.3%) | 34 (5.3%) | |
| 5 | 41 (2.7%) | 7 (1.1%) | |
| Platelets (*10^9) | 237 (202; 276) | 239 (205; 274) | 0.472 |
| ALT (U/l) | 22 (16; 34) | 21 (16; 29) | 0.117 |
| ALT/ULN (rounded to next integer) | <0.001 | ||
| <1 ULN | 1244 (81.7%) | 574 (90.3%) | |
| ≥1 & <2 ULN | 242 (15.9%) | 52 (8.2%) | |
| ≥2 & <3 ULN | 32 (2.1%) | 10 (1.6%) | |
| ≥3 & <4 ULN | 3 (0.2%) | 0 (0.0%) | |
| ≥4 & <5 ULN | 1 (0.1%) | 0 (0.0%) | |
| ≥5 ULN | 1 (0.1%) | 0 (0.0%) | |
| AST (U/l) | 22 (18; 26) | 21 (18; 25) | 0.002 |
| GGT (U/l) | 20 (13; 34) | 18 (12; 29) | 0.002 |
| Alcohol intake (units/day) | 2 (0; 4) | 2 (0; 4) | 1.000 |
| AST/ALT | 0.9 (0.7; 1.2) | 1.0 (0.8; 1.2) | <0.001 |
| APRI | 0.23 (0.18; 0.31) | 0.22 (0.18; 0.28) | 0.085 |
| Forns index | 3.5 (2.7; 4.4) | 3.4 (2.7; 4.2) | 0.085 |
| FIB-4 | 0.91 (0.71; 1.20) | 0.94 (0.75; 1.17) | 0.232 |
| BARD | <0.001 | ||
| 0 | 212 (13.9%) | 94 (14.8%) | |
| 1 | 992 (65.1%) | 458 (72.0%) | |
| 2 | 302 (19.8%) | 77 (12.1%) | |
| 3 | 17 (1.1%) | 7 (1.1%) | |
| BAAT | <0.001 | ||
| 0 | 484 (31.8%) | 228 (35.8%) | |
| 1 | 531 (34.9%) | 255 (40.1%) | |
| 2 | 365 (24.0%) | 120 (18.9%) | |
| 3 | 140 (9.2%) | 32 (5.0%) | |
| 4 | 3 (0.2%) | 1 (0.2%) | |
| Stiffness (kPa) | 4.70 (3.90; 5.60) | NA | |
| Stiffness (kPa, rounded to next integer) | NA | ||
| 2 | – | 26 (4.1%) | |
| 3 | – | 144 (22.6%) | |
| 4 | – | 214 (33.6%) | |
| 5 | – | 125 (19.7%) | |
| 6 | – | 74 (11.6%) | |
| 7 | – | 23 (3.6%) | |
| 8 | – | 11 (1.7%) | |
| 9 | – | 3 (0.5%) | |
| 10 | – | 4 (0.6%) | |
| 11 | – | 5 (0.8%) | |
| 12 | – | 5 (0.8%) | |
| 13 | – | 2 (0.3%) | |
Abbreviations: TE=transient elastography; BMI=body mass index; NIH=National Institutes of Health; FL=fatty liver; NAFLD=non-alcoholic fatty liver disease; AFLD=alcoholic fatty liver disease; HDL=high-density lipoprotein; LDL=low-density lipoprotein; ALT=alanine aminotransferase; ULN=upper limit of normal of alanine aminotransferase (40U/l); AST=aspartate aminotransferase; GGT=gamma-glutamyl-transferase.
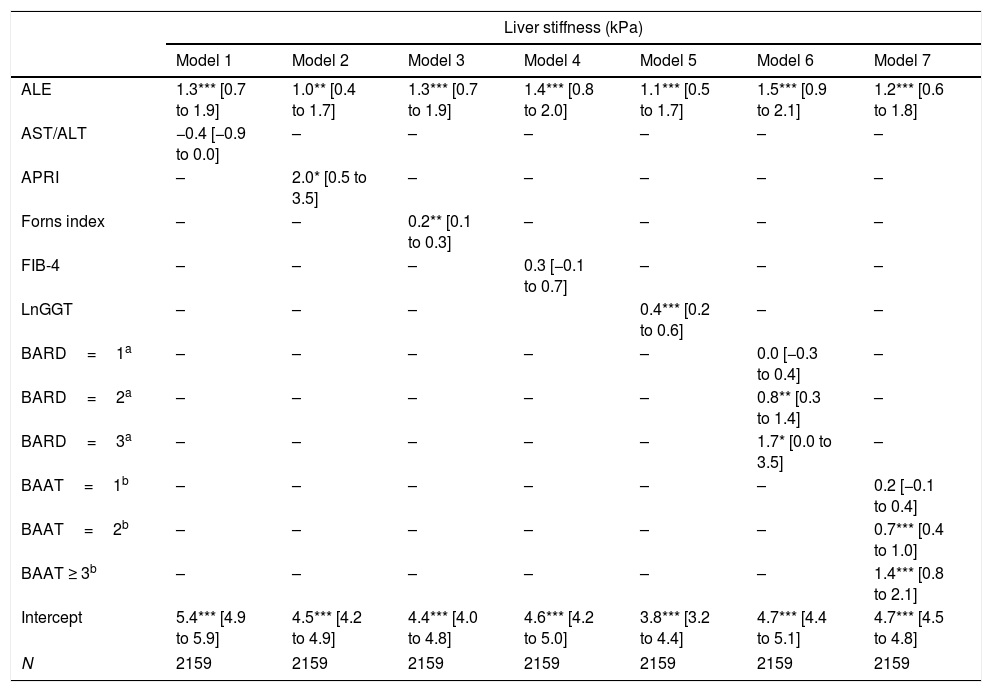
Table 2 reports and Fig. 1 plots the LRMs used to evaluate the association between LS and the seven biomarkers. Because there were just 4 citizens with BAAT=4 (Table 1), we collapsed the categories 3 (n=172) and 4 (n=4) of BAAT to one category (≥3, n=176) for further modeling. LS was significantly associated with APRI, Forns index, lnGGT, BARD and BAAT but not with ALT/AST and FIB-4.
Association between liver stiffness as measured by transient elastography (FibroScan) and seven non-invasive markers of liver fibrosis. Values are regression coefficients and robust 95% confidence intervals from linear regression coupled to univariate multiple imputation of liver stiffness (see Statistical analysis for details).
| Liver stiffness (kPa) | |||||||
|---|---|---|---|---|---|---|---|
| Model 1 | Model 2 | Model 3 | Model 4 | Model 5 | Model 6 | Model 7 | |
| ALE | 1.3*** [0.7 to 1.9] | 1.0** [0.4 to 1.7] | 1.3*** [0.7 to 1.9] | 1.4*** [0.8 to 2.0] | 1.1*** [0.5 to 1.7] | 1.5*** [0.9 to 2.1] | 1.2*** [0.6 to 1.8] |
| AST/ALT | −0.4 [−0.9 to 0.0] | – | – | – | – | – | – |
| APRI | – | 2.0* [0.5 to 3.5] | – | – | – | – | – |
| Forns index | – | – | 0.2** [0.1 to 0.3] | – | – | – | – |
| FIB-4 | – | – | – | 0.3 [−0.1 to 0.7] | – | – | – |
| LnGGT | – | – | – | 0.4*** [0.2 to 0.6] | – | – | |
| BARD=1a | – | – | – | – | – | 0.0 [−0.3 to 0.4] | – |
| BARD=2a | – | – | – | – | – | 0.8** [0.3 to 1.4] | – |
| BARD=3a | – | – | – | – | – | 1.7* [0.0 to 3.5] | – |
| BAAT=1b | – | – | – | – | – | – | 0.2 [−0.1 to 0.4] |
| BAAT=2b | – | – | – | – | – | – | 0.7*** [0.4 to 1.0] |
| BAAT ≥ 3b | – | – | – | – | – | – | 1.4*** [0.8 to 2.1] |
| Intercept | 5.4*** [4.9 to 5.9] | 4.5*** [4.2 to 4.9] | 4.4*** [4.0 to 4.8] | 4.6*** [4.2 to 5.0] | 3.8*** [3.2 to 4.4] | 4.7*** [4.4 to 5.1] | 4.7*** [4.5 to 4.8] |
| N | 2159 | 2159 | 2159 | 2159 | 2159 | 2159 | 2159 |
Abbreviations: ALE=altered liver enzymes; Ln=natural logarithm.
. Abbreviations: ALE=altered liver enzymes; Ln=natural logarithm. Values whose 95%CI do not cross the 0 line have an associated p-value<0.05.")
Association between liver stiffness and seven biomarkers of liver fibrosis. Values are regression coefficients and robust 95% confidence intervals from linear regression (see Table 3). Abbreviations: ALE=altered liver enzymes; Ln=natural logarithm. Values whose 95%CI do not cross the 0 line have an associated p-value<0.05.
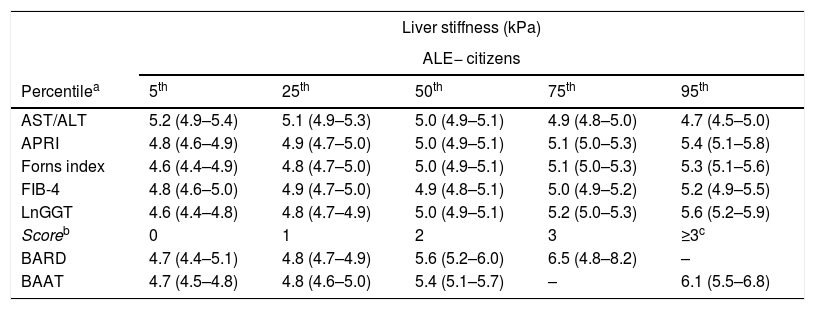
Table 3 reports and Fig. 2 plots the marginal means and robust 95% confidence intervals of LS estimated by the LRM for the 5th, 25th, 50th, 75th, and 95th internal percentile of each continuous biomarker. As shown in Table 3, LS was always higher in ALE+ than in ALE− citizens. It can be readily appreciated from both Table 1 and Fig. 1 that the mean change of LS between the 5th and 95th internal percentile of any continuous biomarker was ≤ 1kPa. Table 1 and Fig. 1 also show that the mean change of LS between scores 0 and 3 of BARD and between scores 0 and ≥3 of BAAT was >1kPa but of doubtful clinical relevance. In the case of BARD and BAAT, the imprecision of the estimates is partly attributable to their discrete nature [15].
Marginal means and robust 95% confidence intervals of liver stiffness estimated from linear regression for the 5th, 25th, 50th, 75th, and 95th internal percentiles of the continuous biomarkers (AST/ALT, APRI, Forns index, FIB-4, lnGGT) and the original scores of the discrete (BARD, BAAT) biomarkers. The underlying regression models are given in Table 2.
| Liver stiffness (kPa) | |||||
|---|---|---|---|---|---|
| ALE− citizens | |||||
| Percentilea | 5th | 25th | 50th | 75th | 95th |
| AST/ALT | 5.2 (4.9–5.4) | 5.1 (4.9–5.3) | 5.0 (4.9–5.1) | 4.9 (4.8–5.0) | 4.7 (4.5–5.0) |
| APRI | 4.8 (4.6–4.9) | 4.9 (4.7–5.0) | 5.0 (4.9–5.1) | 5.1 (5.0–5.3) | 5.4 (5.1–5.8) |
| Forns index | 4.6 (4.4–4.9) | 4.8 (4.7–5.0) | 5.0 (4.9–5.1) | 5.1 (5.0–5.3) | 5.3 (5.1–5.6) |
| FIB-4 | 4.8 (4.6–5.0) | 4.9 (4.7–5.0) | 4.9 (4.8–5.1) | 5.0 (4.9–5.2) | 5.2 (4.9–5.5) |
| LnGGT | 4.6 (4.4–4.8) | 4.8 (4.7–4.9) | 5.0 (4.9–5.1) | 5.2 (5.0–5.3) | 5.6 (5.2–5.9) |
| Scoreb | 0 | 1 | 2 | 3 | ≥3c |
| BARD | 4.7 (4.4–5.1) | 4.8 (4.7–4.9) | 5.6 (5.2–6.0) | 6.5 (4.8–8.2) | – |
| BAAT | 4.7 (4.5–4.8) | 4.8 (4.6–5.0) | 5.4 (5.1–5.7) | – | 6.1 (5.5–6.8) |
| ALE+ citizens | |||||
|---|---|---|---|---|---|
| Percentilea | 5th | 25th | 50th | 75th | 95th |
| AST/ALT | 6.5 (5.9–7.0) | 6.4 (5.8–6.9) | 6.3 (5.7–6.9) | 6.2 (5.6–6.8) | 6.0 (5.4–6.7) |
| APRI | 5.8 (5.1–6.5) | 5.9 (5.2–6.6) | 6.0 (5.4–6.6) | 6.1 (5.6–6.7) | 6.5 (5.9–7.0) |
| Forns index | 6.0 (5.3–6.6) | 6.2 (5.6–6.7) | 6.3 (5.7–6.9) | 6.4 (5.9–7.0) | 6.7 (6.1–7.2) |
| FIB-4 | 6.2 (5.6–6.8) | 6.3 (5.7–6.8) | 6.3 (5.8–6.9) | 6.4 (5.9–7.0) | 6.6 (6.0–7.2) |
| LnGGT | 5.7 (5.0–6.4) | 5.9 (5.3–6.6) | 6.1 (5.4–6.7) | 6.3 (5.7–6.8) | 6.7 (6.1–7.2) |
| Scoreb | 0 | 1 | 2 | 3 | ≥3c |
| BARD | 6.3 (5.7–6.9) | 6.3 (5.7–6.8) | 7.1 (6.4–7.8) | 8.0 (6.3–9.8) | – |
| BAAT | 5.9 (5.3–6.4) | 6.0 (5.4–6.6) | 6.6 (6.0–7.2) | – | 7.3 (6.5–8.1) |
BAAT scores 3 and 4 were collapsed because of the low number of subjects with a BAAT score of 4 (see also Table 1).
. Abbreviations: ALE=altered liver enzymes.")
Values of liver stiffness corresponding to the 5th, 25th, 50th, 75th and 95th internal percentiles of the continuous biomarkers and to the original scores of the discrete biomarkers (see Table 2). Abbreviations: ALE=altered liver enzymes.
In the present analysis of the Bagnacavallo study [16], we have shown that the mean change in LS associated with an increase from the 5th to the 95th internal percentile of AST/ALT ratio, APRI, Forns index, FIB-4, and LnGGT is ≤1kPa and of doubtful biological relevance. While the mean change of LS between scores 0 and 3 of BARD and scores 0 and ≥3 of BAAT is ≥1kPa, it is of doubtful clinical relevance. Thus, under the assumption that LS, as measured by TE, is a surrogate index of liver fibrosis in the general population [3], our findings cast some doubts on the ability of biomarkers developed in tertiary care centers to detect liver fibrosis in the general population. The most likely reason for this finding is the so-called spectrum bias, i.e. the fact that the performance of a diagnostic test is known to vary substantially with the prevalence of the underlying disease [12].
Our study has several strengths. First, LS was measured on a random subsample of citizens from the general population, who are expected to differ from individuals enrolled in primary, secondary, and tertiary care [33]; second, we analyzed LS as continuous, avoiding the loss of efficiency and generalizability produced by dichotomization [15]; third, we took missing data into account using MI [27]. Our study has, nonetheless, some limitations. First, only 29% of our subjects had undergone measurement of TE. This was determined mostly by the availability of FibroScan in the last few months of the study, which can be plausibly considered a random event. The amount of missing data is not a problem per se provided that the MAR assumption is met [26]. To increase the plausibility of the MAR assumption, we built an MI model taking into account all the variables available in the study dataset [26]. We also performed a CCA, which confirmed the results of the MI analysis (data not shown). Second, the Bagnacavallo study population is a general population, and as such, it represents the “population at risk” of the so-called “ecology of care model” [16,33]. This implies that our findings do not necessarily extend to populations made of subjects consulting a physician for primary care, as are most of the studied populations [2], i.e. populations made of “subjects consulting a physician” according to the ecology of care model [33]. Third, although we performed standardized measurements of TE [1], the XL probe was not available during the study period. Not surprisingly, TE availability was less common among obese citizens (Table 2) and BMI is one of the predictors we took into account to make the MAR assumption of MI more plausible. However, the M probe used in the present study overestimates LS by a median of 1.4kPa [1] so that, to the degree that they are influenced by obesity, our estimates of LS (Table 3) are biased upward, meaning that our conclusion of the low performance of biomarkers in the general population would be reinforced by such systematic error.
TE cut-points of 8 or 9kPa are presently suggested for the diagnosis of liver fibrosis in the general population [2,3]. Even if dichotomization always involves a loss in efficiency and reduces the generalizability of the findings [12,15], it is of interest that the 95%CI of the mean LS did not include 8kPa for all continuous biomarkers (Table 3 and Fig. 2). While the 95%CI of the mean LS included 8kPa for a BARD score of 3 in ALE− citizens, they were wide, ranging from 4.8 to 8.2kPa (Table 3 and Fig. 2). More interestingly, in ALE+ citizens, the mean LS corresponding to a BARD score of 3 was 8.0kPa, even if its 95%CI were again wide (6.3–9.8kPa) (Table 3 and Fig. 2). The fact that the 95%CI of mean LS included 8 for a BAAT score ≥3 is less relevant because of its wide 95%CI (6.5–8.1) (Table 3 and Fig. 2).
5ConclusionIn conclusion, in the Bagnacavallo Study, we found only modest associations between LS as measured by TE and seven commonly employed biomarkers of liver fibrosis.Abbreviations95%CI 95% confidence interval alcoholic fatty liver disease altered liver enzymes alanine aminotransferase aspartate aminotransferase body mass index fatty liver gamma-glutamyl-transferase hepatitis B virus hepatitis C virus high density lipoprotein interquartile range low density lipoprotein linear regression model liver stiffness missing at random multiple imputation metabolic syndrome non-alcoholic fatty liver disease National Institutes of Health transient elastography upper limit of normal
The present analysis was sponsored by a research grant from Gilead Sciences (Milan, Italy) to the Italian Liver Foundation. The Sponsor had no role in the design and conduct of the study; in the collection, analysis, and interpretation of the data; or in the preparation and review of the manuscript.
Conflict of interestThe authors declare no conflict of interest.
The authors are grateful to Ms. Natalie Manuel for revising the English text.
Francesca Dazzani, Arianna Lanzi, Gaia Saini, Margherita Rimini, Alessandra Ravaioli, Giulia Rovesti, Lauro Bucchi, Fabio Falcini, Mauro Bernardi, Pietro Andreone, Giuseppe Francesco Stefanini.
articles


![]()