


Background. In the follow up of chronic hepatitis B infection (HBV), a significant correlation between quantitative HBsAg titer measurement and HBV DNA level, and moreover with intrahepatic covalently closed circular DNA was already shown. However, besides their impact on long-term follow up, they are really expensive methods, and not available widespread. We aimed to investigate the utility of qualitative measurement of HBsAg titer in prediction of virologic response at the end of the first year of anti-viral treatment in chronic HBV infection.
Material and methods. A total of 70 patients receiving anti-viral therapies for chronic HBV infection were included into the study. The patients were evaluated according to Hbe Ag status and response to treatment. The determinations used in the study (biochemical, virologic responses, primary non-response) were accepted as it was described in AASLD.
Results. Qualitative HBsAg titer increased significantly in both HBeAg positive and negative patients (p values 0.002 and < 0.000). Increasing of HBsAg titer in first three months is more dramatic in responder group, however the difference was disappeared at the sixth and twelve moths on follow up. Similarly, a fast increasing in anti-HBe titer in HBeAg negative chronic HBV patients was related with higher response at the end of first year therapy. However, the changings at the 12th month of anti-viral treatment were similar in both responder and non-responder groups.
Conclusion. In conclusion, the fast increase in qualitative measurement of HBsAg titer seemed to be a predictor of higher anti-viral medication success in chronic HBV patients. However, this meaningful increasing was disappeared on the follow up, particularly after the six months examination.
Chronic hepatitis B virus (HBV) infection is a worldwide health problem leading to chronic hepatitis, chirrosis and hepatocelluler carcinoma. Higher serum levels of HBV DNA was shown to be associated with severe liver diseases, and lowering HBV DNA seemed to be a good prognostic factor for underlying fibrotic process and tumorogenesis; antiviral treatments have been focused on to minimize the serum level of HBV DNA as could as possible.1
HBV surface antigen (HbsAg), was used as a marker of presence of HBV infection. However, in the recent years with the enhancing of quantitative measuring tecniques, it was shown that HBsAg titer has a significant association with HBV DNA.2,3 Moreover, HBsAg titer in serum was not only related with serum HBV DNA level, but also with intrahepatic covalently closed circular DNA (cccDNA).4 Ongoing studies have been focused on the utility of HBsAg titer in predicting the effect of anti-viral therapies in individuals with chronic hepatitis B.3–6 Early drop in quantitave HBsAg titer was reported to have a high predictivity for sustained virolologic response (SVR), and HBsAg seroconversion.7
HBeAg is an antigen leading to viral DNA expression and showing the viral infectivity capacity. It has also been reported that its quantitative titer has been related to treatment response. The predictive roles of monitoring HBeAg titer in the progression of underlying liver disease with interferon (IFN) and lamivudin were published before.8 However, quantitative measurement of HBsAg or HBeAg is an expensive method and not available in most of the gastroenterology clinics.
The aim of this study was to determine the utility of qualitative measurement of HBsAg in predicting virologic response at the end of the first year of anti-viral treatment in individuals with chronic HBV infection.
Materials and MethodsThe patients diagnosed with chronic hepatitis B infection and treated in a reference center, Diskapi Yildirim Beyazit Education and Research Hospial, during the period between September 2009 and November 2010 were included in the study, retrospectively. Inclusion criteria were as follows: the presence of HBsAg in serum more than 6 months, age over 16 years, treatment with one of the anti-viral therapies (eg. pegilated interferon, lamivudin, ente-cavir or tenofovir), and the patients followed minimum 6 months after the end of the first year of anti-viral treatment. Exclusion criteria were as follows: co-incidances with another viral hepatitis virus infection (eg. HCV, HDV, HIV) or underlying malignancy. The diagnosis and treatment decision of chronic hepatitis B infection were made in accordance with the guideline of AASLD.9 The high amounts of lamivudin usage were mainly associated with these limitations. Totally, 70 patients under an anti-viral medication were included in the study (25 with lamivudin, 22 with tenofovir, 16 with entecavir, 8 with IFN). The patients were devided according to the response of therapy (55 out of 70 patients were responder, 15 were non-responder).
The histopathological evaluation of liver was made by the pathologists of the same hospital in accordance with Ishak scoring systems HAI (range 018) and Fibrosis (range 0-6) scoring system.10
Serum levels of HBsAg, HBeAg, HBsAb, and HBeAb were analyzed by DiaSorin S.p.A., Italy. Qualitative analyses with the same kits of HBsAg, HBeAg have been performed since September, 2009.
The definitionsThe determinations used in the study (biochemical, virologic responces, primary non-responce) were accepted as it was described in AASLD.9
Virologic response was defined as undetectable HBV DNA level in serum by real time PCR assay (< 50 copies/mL), and biochemical response as the decrease in ALT within the normal range (10-35 IU/ mL) at the end of the first year of the anti-viral therapy. The patients presented with virologic response at the end of first year of the therapy were named as responders (R), and ones without virologic response as non-responders (NR).
Primary non-reponse was defined as < 2 log10 IU/mL decrease in the serum level of HBV DNA in the 24th week of the anti-viral therapy. Moreover, sustained virologic response is the best option to evaluate the presence of response for IFN therapy. However, due to the lack of information, we used first year HBV DNA level to evaluate the status of response for IFN therapy.
Serologic response was defined as disappearance of HBeAg at the end of the first year, in HBeAg positive patients.
A total of 81 chronic hepatitis B patients met the inclusion criteria; however after the end of the first year of anti-viral medication, only 70 patients still remain in the study. Due to the lack of first year information, 11 patients were dropped out from the analysis.
Statistical analysisContinues variables were shown as mean ± stan-dart deviation (SD) or median (range). To compare the categorical variables and continues chi-square test or Fisher’s exact test, and Student’s t test or paired samples t test were used. To evaluate the presence of differences in HBsAg, HBeAg and anti-HBe titers during anti-viral medications among responder and non-responder groups were performed via Mann-Whitney U test. The cutt-off p value for signi-ficancy is accepted as < 0.05.
ResultsA total of 70 patients treated for chronic HBV infection were included into the study. The baseline demografic features were as follows: mean age of the patients were 48.7 ± 18.8 years old, and most of them have been known as chronic HBV infection for 5.5 years. Great proportion of the patients was HBV-treatment naiv (77.6%). Total 14 out of 70 patients had histories of previous IFN usage (1 patient was treated with standart interferon before pegila-ted interferon, 13 patients with standart-or pegila-ted-interferon before nucleos(t)id analogs). IFN seems to be the prefered treatment in both patients with lower ages and smaller stages of fibrosis (p values 0.018, and 0.023, respectively). Mean HBV DNA serum level was found to be highest in the te-nofovir group (p value 0.005). Total 14.3% of chronic HBV patients were HBeAg positive. Log values of HBV DNA level was higher in HBeAg positive group, whereas both HBsAg titer, and logHBsAg at the beginning of the treatment in HBeAg negative ones were similar (p values 0.023, 0.095 and 0.155, respectively).
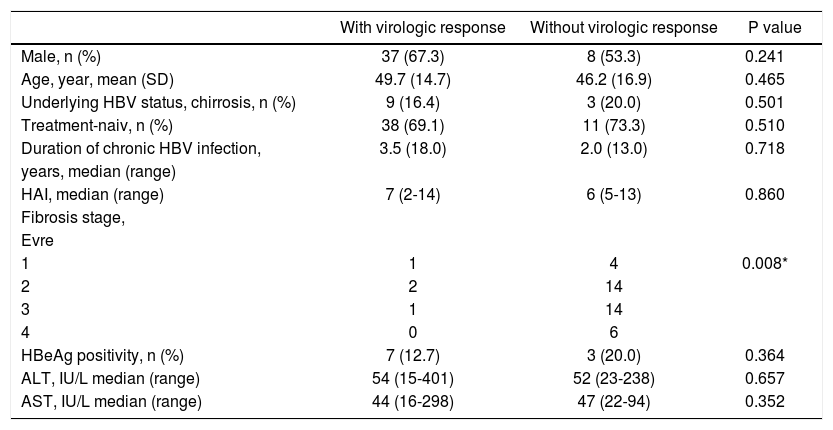
When we evaluate the basal features at the end of the first year, both R and NR patients did not differ from each other, but the stages of fibrosis (p value, 0.008). The fibrosis seemed to be higher in R group (Table 1). However, the histopathological examinations of 4 out of 5 patients with stage 1 fibrosis revealed also lower degree of HAI, and none of them was able to be included in R group. The other patient, who presented with higher degree of HAI and stage 1 fibrosis, achieved in virologic response at the end of the first year.
Baseline characteristic features of the patients according to the presence of virologic response at the end of the first year.
| With virologic response | Without virologic response | P value | |
|---|---|---|---|
| Male, n (%) | 37 (67.3) | 8 (53.3) | 0.241 |
| Age, year, mean (SD) | 49.7 (14.7) | 46.2 (16.9) | 0.465 |
| Underlying HBV status, chirrosis, n (%) | 9 (16.4) | 3 (20.0) | 0.501 |
| Treatment-naiv, n (%) | 38 (69.1) | 11 (73.3) | 0.510 |
| Duration of chronic HBV infection, | 3.5 (18.0) | 2.0 (13.0) | 0.718 |
| years, median (range) | |||
| HAI, median (range) | 7 (2-14) | 6 (5-13) | 0.860 |
| Fibrosis stage, | |||
| Evre | |||
| 1 | 1 | 4 | 0.008* |
| 2 | 2 | 14 | |
| 3 | 1 | 14 | |
| 4 | 0 | 6 | |
| HBeAg positivity, n (%) | 7 (12.7) | 3 (20.0) | 0.364 |
| ALT, IU/L median (range) | 54 (15-401) | 52 (23-238) | 0.657 |
| AST, IU/L median (range) | 44 (16-298) | 47 (22-94) | 0.352 |
* The cutt-off p value for significancy is accepted as < 0.05. N: number of the patients.
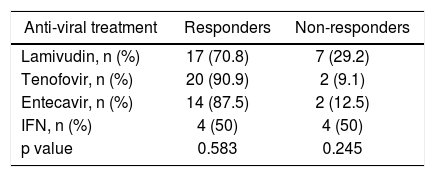
Primary virologic non-response was seen in two patients in the lamivudin treatment group, and none in the entecavir and tenofovir group. Even though the difference did not reach the statistical significan-cy, virologic and biochemical responses at the end of the first year in IFN treatment group were lower than the other groups (p values 0.247, and 0.580, respectively).
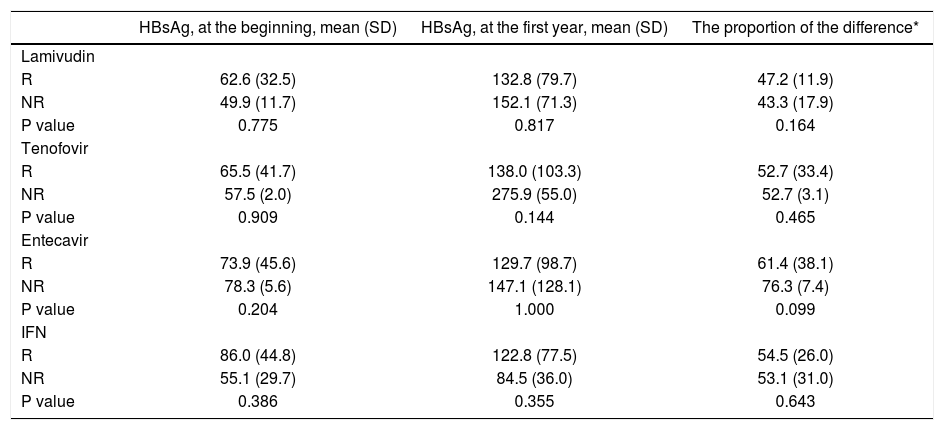
The underlying anti-viral medications did not differ according to the virologic response rates (Table 2). The highest virologic response rate in nucleos(t)id analogs was seen in teneofovir group, and the lowest was in the lamivudin group (90.9 vs. 70.8%, respectively). The positivity of HBV DNA at the end of the IFN therapy is not a so good predictor of success of the therapy as it was in nucleos(t)id analogs. HBsAg ti-ters at the baseline, at the end of first year of therapy, and the proportion of this difference were not significantly different between R and NR groups in subgroup analysis according to underlying treatment (Table 3).
The association between anti-viral medications and virologic response at the end of the first year.
| Anti-viral treatment | Responders | Non-responders |
|---|---|---|
| Lamivudin, n (%) | 17 (70.8) | 7 (29.2) |
| Tenofovir, n (%) | 20 (90.9) | 2 (9.1) |
| Entecavir, n (%) | 14 (87.5) | 2 (12.5) |
| IFN, n (%) | 4 (50) | 4 (50) |
| p value | 0.583 | 0.245 |
The relation between anti-viral medications and HBsAg titer.
| HBsAg, at the beginning, mean (SD) | HBsAg, at the first year, mean (SD) | The proportion of the difference* | |
|---|---|---|---|
| Lamivudin | |||
| R | 62.6 (32.5) | 132.8 (79.7) | 47.2 (11.9) |
| NR | 49.9 (11.7) | 152.1 (71.3) | 43.3 (17.9) |
| P value | 0.775 | 0.817 | 0.164 |
| Tenofovir | |||
| R | 65.5 (41.7) | 138.0 (103.3) | 52.7 (33.4) |
| NR | 57.5 (2.0) | 275.9 (55.0) | 52.7 (3.1) |
| P value | 0.909 | 0.144 | 0.465 |
| Entecavir | |||
| R | 73.9 (45.6) | 129.7 (98.7) | 61.4 (38.1) |
| NR | 78.3 (5.6) | 147.1 (128.1) | 76.3 (7.4) |
| P value | 0.204 | 1.000 | 0.099 |
| IFN | |||
| R | 86.0 (44.8) | 122.8 (77.5) | 54.5 (26.0) |
| NR | 55.1 (29.7) | 84.5 (36.0) | 53.1 (31.0) |
| P value | 0.386 | 0.355 | 0.643 |
* The proportion of the difference is calculated by “HBsAg, at the first year-HBsAg, at the beginning/HBsAg, at the beginning”.
Overall, in patients with chronic hepatitis B, HBsAg increased significantly in both HBeAg positive and negative patients (p values 0.002 and < 0.000, respectively). When it was evaluated according to the presence of first year virologic response, it was notted that the increase in HBsAg level in first 3 months of the theraphy in R group was more drammatic, and significantly different from the NR group (p value 0.054). However, the significancies of differences in HBsAg levels were dissappeared at the 6th and 12th months of follow up (p values 0.963 and 0.935, respectively). The change in anti-HBe level was also different in groups according to the first year virologic response rates (p value 0.037). When we evaluate the changing of the proportion in HBsAg level during anti-viral medication, 3th months’ results was also different in R and NR groups (p value 0.069).
In HBeAg positive chronic HBV patients, the changes in HBsAg and HBeAg titer during anti-viral treatment were similar in both R and NR groups (p values, at 3th months 0.833 and 0.267; at 6th months 0.167 and 0.24; at 12th months 0.571 and 0250, respectively).
In HBeAg negative patients, both the difference, and the proportion of difference in HBsAg at the third months of therapy were significantly different in R group than in NR group (p values, 0.040 and 0.038, respectively). The increase in anti-Hbe titer in the 3th and 6th months of the therapy also seemed to be important for the prediciton of therapy response in the first year (p value 0.025). However, the changings seen at the 12th month of the therapy were similar in both R and NR groups.
HBsAg seroconversion was seen in just one HBeAg negative chronic HBV patient under enteca-vir treatment, however the patient gave up the therapy after the recovery for two months, subsequently HBsAg was re-appeared. There was no other patient with HBsAg seroconversion at the end of first year of anti-viral therapy.
HBeAg seroconversion was seen in 6 out of 9 (66.7%) HBeAg positive chronic HBV patients at the end of the first year (three HBeAg positive patients were dropped out of follow-up). There were no differences between the anti-viral drugs in terms of the HBeAg seroconversion rates (p value 0.861). None of the HBeAg seroconversion was followed up by HBsAg seroconversion at the end of the 18 months.
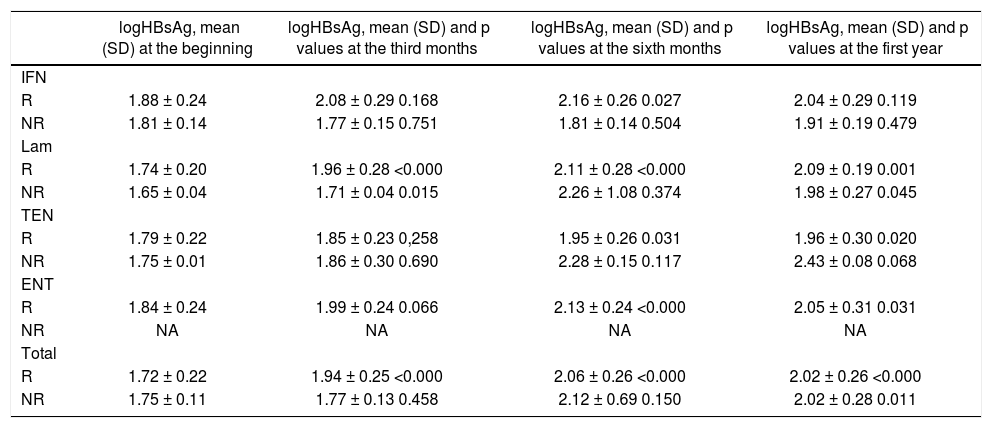
Changings in logHBsAg according to the underlying anti-viral medications were shown in table 4. The significant increase in logHBsAg was mostly seen with nucleos(t)id analogs rather than IFN.
The changings in logHBsAg values during the anti-viral treatment in HBeAg negative patients according to the presence of virologic response.
| logHBsAg, mean (SD) at the beginning | logHBsAg, mean (SD) and p values at the third months | logHBsAg, mean (SD) and p values at the sixth months | logHBsAg, mean (SD) and p values at the first year | |
|---|---|---|---|---|
| IFN | ||||
| R | 1.88 ± 0.24 | 2.08 ± 0.29 0.168 | 2.16 ± 0.26 0.027 | 2.04 ± 0.29 0.119 |
| NR | 1.81 ± 0.14 | 1.77 ± 0.15 0.751 | 1.81 ± 0.14 0.504 | 1.91 ± 0.19 0.479 |
| Lam | ||||
| R | 1.74 ± 0.20 | 1.96 ± 0.28 <0.000 | 2.11 ± 0.28 <0.000 | 2.09 ± 0.19 0.001 |
| NR | 1.65 ± 0.04 | 1.71 ± 0.04 0.015 | 2.26 ± 1.08 0.374 | 1.98 ± 0.27 0.045 |
| TEN | ||||
| R | 1.79 ± 0.22 | 1.85 ± 0.23 0,258 | 1.95 ± 0.26 0.031 | 1.96 ± 0.30 0.020 |
| NR | 1.75 ± 0.01 | 1.86 ± 0.30 0.690 | 2.28 ± 0.15 0.117 | 2.43 ± 0.08 0.068 |
| ENT | ||||
| R | 1.84 ± 0.24 | 1.99 ± 0.24 0.066 | 2.13 ± 0.24 <0.000 | 2.05 ± 0.31 0.031 |
| NR | NA | NA | NA | NA |
| Total | ||||
| R | 1.72 ± 0.22 | 1.94 ± 0.25 <0.000 | 2.06 ± 0.26 <0.000 | 2.02 ± 0.26 <0.000 |
| NR | 1.75 ± 0.11 | 1.77 ± 0.13 0.458 | 2.12 ± 0.69 0.150 | 2.02 ± 0.28 0.011 |
NA: not available.
With the enhancing of quantitative measuring, HBsAg titer became an important factor in predicting the virologic and serologic response of anti-viral therapy in chronic HBV infection.3–6 To date, rapid decrease in HBsAg titer has been shown to be a good predictor in patients receiving IFN5 lamivu-din,6 and adefovir.4 At 24th week, one log IU/mL drop in HBsAg titer was attributed to a high capability in prediction of SVR (97% negative predictive value, and 99% positive predictive value) under IFN therapy.5 However, change in HBsAg titer under entecavir treatment did not determine a related factor for virologic response.3 And the authors realized that there are also two other factors associated with HBsAg level which one of them was the differentiation in HBV genotype. On-treatment prominent decline in HBsAg titer was noticed especially in patients with HBV genotype A and B, and the modest decline were in genotype D.5 And the second one was about the medication that the patient was receiving, whether it was IFN or nucleos(t)id analogs. While the mechanisms of action are quietly different, the change in HBsAg titer can also be different: higher decline under IFN treatment, modest decline under nucleos(t)id analogs.5 Moreover, entecavir and tenofovir are expected to be more potent than lamivudin and adefovir, and the expected HBsAg titer declining are much more in former group.3,5 As it is seen in table 3, the changings with oral NAs were more dramatic, in contrast to IFN group. This data is similar with what Lee, et al.3 suggested in their article, whereas it was in contrast with Marcellin, et al.5 On the other hand, we showed an increase in qualitative HBsAg which related with virologic response. Both R and NR groups' HBsAg titers were increased in the follow-up period, and the significant differences were already found at the 3th month rather than at the end of the first year of therapy. Rapid increase was observed during the first 3 months which was seemed to be more important to predict the virologic response. Also, we should note that almost all of our patients with HBV infection from our country are genotype D.14
In HBeAg positive patients under entecavir3 or IFN11 treatment, baseline HBsAg titer was also found as an independent predictive factor for the vi-rologic response. It was also notted that HBsAg ti-ters in HBeAg negative patients are usually lower than positive ones.12 In immune-tolerant and immu-ne-clearence phases, HBsAg titers are frequently found higher than low replicative phases. These are all attributed to the different pathways of existance of HBsAg and HBV DNA into the host genome.3 However, our study showed that HBsAg did not differ according to the presence of HBeAg (mean ± SD, 52.9 ± 21.3 and 68.0 ± 36.5, p value = 0.375, respectively) (not shown in results). On the other hand, they showed a significant correlation between HBsAg titer and HBV DNA level at the 6th month of therapy, and as the low replicative phases occurs, the correlation also disappeared. Whereas, Rijck-borst, et al. showed a modest correlation between HBsAg titer and HBV DNA level in HBeAg negative chronic HBV patients.13 However, we could not find any correlation between qualitative HBsAg and HBV DNA level (r: -0.024, p value 0.828). Probably, the important point is that almost all of the patients in their study had genotype C HBV infection, whereas our cases mostly have the genotype D.13 Also, Brunetto, et al. notted that higher baseline HBsAg titer was seen in genotype A and B and lower titers in genotype D.5
HBeAg titer was also determined as a predictive marker for serologic response in HBeAg positive chronic HBV patients.3 At the 6th month of enteca-vir therapy, 10 fold drops in HBeAg titer seemed to be strong sign for serologic response. However, due to the limited number of patients, we were not able to show any relation between qualitative HBsAg and virologic response in HBeAg positive chronic HBV patients.
Surprisingly, only one out of 5 chronic HBV patients with stage 1 fibrosis revealed virologic response at the end of the first year. However, all patients presented without virologic response had not only lower fibrosis in liver, but also lower histologic activity indexes. So, the accuracy of the last guidelines recommends treating the chronic HBV infection patients with higher HAI is proved by our results.
There were some limitations of this study. Firstly, our study was designed retrospectively, eventhough the ELISA kit used during the patient’s follow-up have not been changed and all the data were collected from the computer databank system. Secondly, before starting anti-viral medication, evaluation of the genotype of all chronic HBV patients is not recommended routinely, so we can just speculate it from a recent data published from our country which reported that almost all of our HBV patients have genotype D.14 Thirdly, the follow-up period in our study is almost one year. So, it will be better to check out these results at the end of second and third years. Fourthly, we accepted the same determination of virologic response for IFN therapy in the analysis. If we prolong our interview to 2 and to 3 years, we could further speculate about the affect of IFN on HBsAg titer. The success rate based on the virologic response seen under IFN therapy in our study is lower than the other medications. Fifthly, the number of our patients did not allow us to analyze the role of some subgroups in predicting of virologic response.
ConclusionIn conclusion, with the highlights of our results, we can suggest that genotype D HBV patients usually present with qualitative HBsAg, and during treatment, especially at the 3th month of therapy revealed a significant increase in HBsAg titer rather than decrease in R group, and the prominent increase was seen at the third month did not continue in the follow-up. Qualitative measurement of HBsAg can be a cheaper predictive marker at the third month’s evaluation.
articles


![]()