


Metabolic dysfunction-associated steatotic liver disease (MASLD, formerly known as non-alcoholic fatty liver disease; NAFLD [1]), is defined by macrovesicular lipid accumulation in more than five percent of hepatocytes in combination with at least one cardiometabolic risk factor like dyslipidaemia, hypertension, and diabetes. MASLD, in the absence of classical causes of steatogenesis (e.g., alcohol and steatogenic drugs), largely overlaps with NAFLD, but in contrast to the latter, it can co-exist with other chronic liver diseases [2]. MASLD encompasses a wide spectrum of clinical conditions, ranging from isolated steatosis to inflammation (metabolic dysfunction-associated steatohepatitis; MASH), liver fibrosis, cirrhosis, and hepatocellular carcinoma (HCC)[3]. The global prevalence of MASLD, currently estimated at 32.4%, parallels the global increase in obesity and type 2 diabetes mellitus (T2DM) [4,5]. In addition, MASLD is also causally linked to the development of metabolic disturbances, such as T2DM (hence implying a complex multidirectional pathophysiological relation), and is associated with an increased risk of cardiovascular disease (CVD), non-liver malignancies, and various extra-hepatic complications [6–9].
The stage of liver fibrosis is the strongest predictor for liver-related mortality and the development of other hepatic and extra-hepatic comorbidities [10–14]. The severity of fibrosis is scaled from F0 to F4, as proposed by the MASH Clinical Research Network Scoring System. An increase in fibrosis from stage F ≥ 2 or higher (called “significant fibrosis”) is correlated with a more severe liver- and non-liver-related outcome [15]. Therefore, it is vital to correctly rule out significant liver fibrosis (F≥2), preferably with non-invasive methods like vibration-controlled transient elastography (VCTE) or the FIB-4 Index. VCTE determines liver stiffness based on the propagation of a shear wave through the liver. It is a reliable technique used as a surrogate marker for liver fibrosis and is incorporated in the FibroScan® device [16]. The FIB-4 is a freely available score that consists of the parameters aspartate transaminase (AST), alanine transaminase (ALT), age, and thrombocytes [17]. Because these parameters are usually readily available, the FIB-4 is easy to use for screening. Consequently, the European Association for the Study of the Liver (EASL) recommends using the FIB-4 and VCTE as the first and second steps to rule out liver fibrosis [16]. The reliability of the FIB-4 varies, however, across different populations, including those who are living with overweight, obesity, or T2DM and having CVD. Furthermore, it appears less accurate in populations with T2DM and CVD [18–21]. The screening performance of the FIB-4 in people with MASLD remains to be adequately investigated further.
Therefore, we aimed to investigate the agreement between the FIB-4 and VCTE with the existing age-dependent cut-off values in a primary care cohort [16]. We then searched for new age-dependent cut-off values that might perform better than the current ones. Finally, these new cut-off values were validated in two external cohorts.
2Patients and Methods2.1Study populationThe following prospective cohort studies, hereinafter referred to as the discovery cohorts, were conducted from October 2020 to February 2024 in nine primary care practices (PCPs) throughout Belgium (NCT04647409) and five PCPs throughout the Netherlands (NCT04918732). The study protocols were conducted according to the Helsinki Declaration after approval by the Ethics Committee of Hasselt University (CME2020 019), University Hospital Antwerp (19/44/495), Maria Middelares (MMS.2019.019), and the Medical Ethical Committee of Maastricht University/Maastricht University Medical Centre (NL73265.068.20). The prospective cohort studies used as validation cohorts were conducted from September 2019 to October 2024 in Türkiye (NCT05194553) and at the endocrinology department of Ziekenhuis Oost-Limburg (NCT04999124).
2.2ParticipantsParticipants were recruited by the general practitioner (GP), or e-mails were sent through the electronic patient record system used in the GP practice. Additionally, flyers and posters were available in the waiting room. People with T2DM were recruited by their endocrinologists. Participants were eligible for inclusion if they were older than 18 years old, able to understand Dutch, had no excessive alcohol use (more than 2 or 3 glasses of alcohol per day for women or men, respectively), and had no other known liver diseases or secondary causes of steatosis. Other liver diseases were defined as having Hepatitis B virus, Hepatitis C virus, autoimmune hepatitis, primary biliary cholangitis, haemochromatosis, Wilson’s disease, or Alpha 1 antitrypsin deficiency. Secondary causes of steatosis are mainly drug-induced liver injury, e.g., by amiodarone, tamoxifen, and methotrexate (Supplemental Table S1). Inclusion and exclusion criteria for the validation cohorts can be found in the Supplemental materials (Supplemental Table S1).
2.3Non-invasive testsAs a surrogate for liver fibrosis, liver stiffness was measured by Vibration Controlled Transient Elastography (VCTETM) and liver steatosis by Controlled Attenuation Parameter (CAPTM). VCTE and CAP were measured utilising a FibroScan® 430+ mini (Echosens, Paris, France) in the right liver lobe by intercostal approach. Subjects were asked to be in fasting conditions for at least 3 hours before the examination and were placed in a supine position with arms in maximal abduction. For screening, the M probe (3.5MHz) or the XL probe (2.5 MHz) was selected as indicated by the device. VCTE and CAP values were considered reliable when the interquartile range (IQR) was equal to or less than 30% of the median liver stiffness measurement (LSM) value (IQR/med) and at least ten measurements were performed. A CAP value of >248 dB/m was considered as having steatosis [22]. Fibrosis stages based on VCTE values are categorised as follows: a VCTE value of <8.0 kPa, ≥8-12 kPa, or ≥12 kPa was considered as having no to little fibrosis (F0-F1), significant fibrosis (F2) or advanced fibrosis and cirrhosis (F3-F4), respectively [22].
The FIB-4 was calculated for all subjects using their age (in years), platelet count (in 109/L), AST (in U/L), and ALT (in U/L) using the following calculation: (age x AST) / (platelet count x (√ALT)) [17]. A value below 1.3 (if aged ≤65 years) or 2.0 (if aged >65 years) was considered indicative of a low risk for significant fibrosis (F2), and a score higher than 2.67 indicated a high risk [16].
2.4Data collectionAnthropometric data (waist circumference, weight, height, and blood pressure), smoking status, alcohol usage, medical background, medication usage, and demographic data were collected on the day of evaluation. Blood samples were taken within one month of the VCTE measurement. Missing anthropometric data, laboratory values (within 6 months of the VCTE measurement), medical history, and medication usage were collected retrospectively from medical records. A body mass index (BMI) of <25 kg/m², 25-30 kg/m², and >30 kg/m² were considered as normal weight, overweight, and obesity, respectively [23,24]. Furthermore, metabolic syndrome (MetS) diagnosis was based on the International Diabetes Federation consensus [25]. High waist circumference was defined as >94cm for men and >80cm for women [25].
2.5Sample size calculationThe sample size required for this study was calculated to be 475, using the sample size formula for agreement estimation with binary outcomes as outlined by Shoukri et al. [26]. The calculation assumed a kappa value of 0.65, based on findings from a prior study on liver fibrosis [27]. A proportion of 0.7 was used, reflecting the prevalence of MASLD in high-risk groups [28]. The precision, defined as half the width of the confidence interval (CI), was set at 0.075, with a confidence level of 95%.
2.6Missing dataConsidering the variables required to calculate the FIB-4 score, data were missing for 16.8% of the 563 participants. There were no missing data on VCTE values. Missing data on covariates and outcome variables were imputed using the multiple imputation procedure in SPSS version 29.0.2.0 (for details, see Supplement Missing Data). The imputation model included the following variables to enhance the plausibility of the missing at random (MAR) assumption (see Supplement Missing Data for the rationale behind each inclusion): AST, ALT, thrombocytes, FIB-4, VCTE, cohort indicator, waist circumference, BMI, gender, triglycerides, CAP, and gamma-glutamyl transferase (GGT). The number of imputations (n = 17) was based on the fraction of missing information. The results obtained with multiple imputation, valid under the MAR assumption, were compared with those from complete case analyses, valid under the more restrictive and less realistic assumption of data missing completely at random (MCAR), as recommended by Sterne [29].
2.7Statistical analysisStatistical analysis was performed using Statistical Package for Social Sciences (SPSS) (Version 29.0, Armonk, New York, IBM Corp). Categoric variables were presented as absolute values with percentages. The Shapiro-Wilk or Kolmogorov-Smirnov test was used to test for the normality of continuous variables. All skewed numeric variables are presented as median with IQR. The nonparametric Mann-Whitney U and Kruskal-Wallis tests were used to compare two or more groups for continuous variables with a non-normal distribution. As a post-hoc analysis, the Dunn’s test (adjusted with Bonferroni correction for multiple testing) was performed for the Kruskal-Wallis test. The Chi-Square or Fisher's Exact test was used to compare discrete and categorical variables. The Fisher’s Exact test was only used if the cells' expected count was less than five. To investigate the agreement between the FIB-4 and VCTE, the weighted Cohen’s kappa was used [30]. Cohen's kappa values are interpreted based on Landis et al.'s cut-off ranges [30]. The Area Under the Receiver Operating Characteristic curve (AUROC) was determined for the FIB-4 with VCTE as the gold standard. Sensitivity, specificity, positive predictive value (PPV), and negative predictive value (NPV) of the cut-off values were determined. The Youden’s Index was used to find the optimal sensitivity-specificity trade-off for new cut-off values. The number of subjects included in every analysis is designated by ‘n’. A p-value ≤ 0.05 is considered statistically significant.
2.8Ethical considerationsThe study protocols were approved by the Ethics Committee of the Istanbul Health Sciences University Clinical Studies Ethics Board (2021/224) and the Committee on Medical Ethics of Ziekenhuis Oost-Limburg (CTU2020015), respectively. Good clinical practice (GCP) guidelines were followed throughout the study. All authors had access to the study data and reviewed and approved the final manuscript.
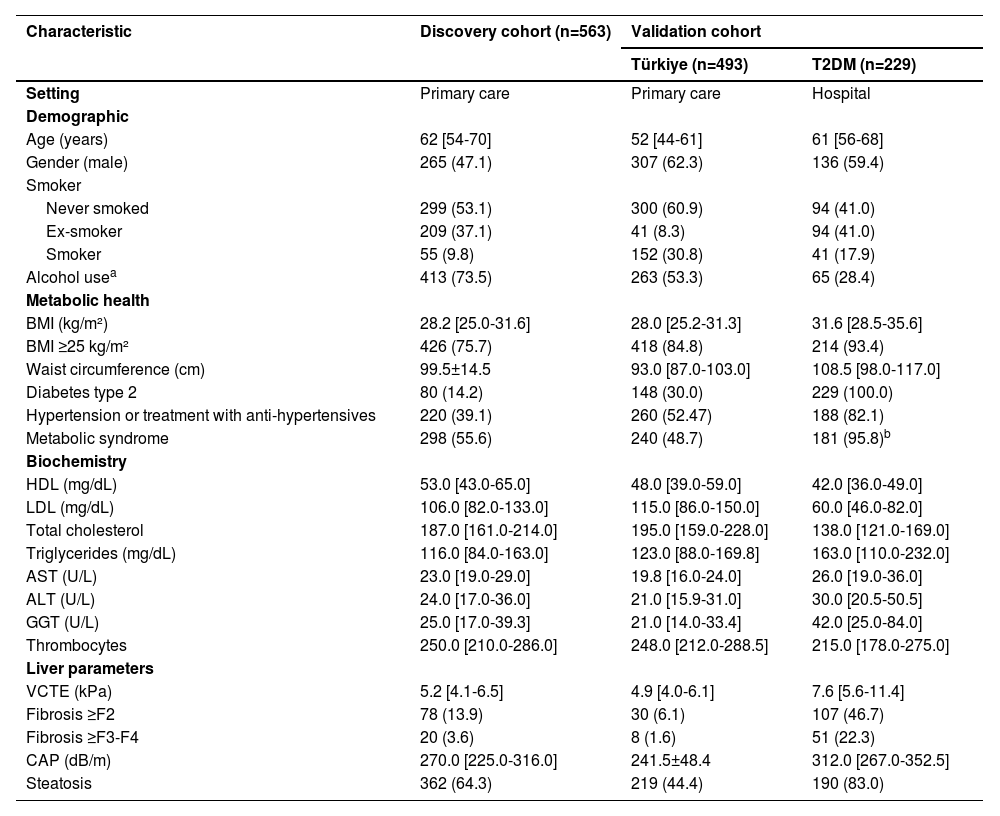
3Results3.1Cohort characteristicsIn total, 1,730 people were screened, of whom 563 (71.4%) for the discovery cohort were eligible according to the exclusion criteria (Figure 1). For the validation cohorts, 493 (90.6%) from Türkiye and 229 (57.7%) T2DM participants were eligible, respectively. Table 1 shows the participant characteristics of all analysed cohorts. In the discovery cohort, the median age was 62 [54-70] years, 265 (47.1%) were men, 80 (14.2%) had T2DM, and the median BMI was 28.2 [25.0-31.6] kg/m². For the Türkiye validation cohort, the median age was 52 [44-61] years, 307 (62.3%) were men, 148 (30%) had T2DM, and the median BMI was 28.0 [25.2-31.3] kg/m². In the T2DM cohort, the median age was 61 [56-68] years, 136 (59.4%) were men, and the median BMI was 31.6 [28.5-35.6] kg/m².

Characteristics of the different cohorts.
| Characteristic | Discovery cohort (n=563) | Validation cohort | |
|---|---|---|---|
| Türkiye (n=493) | T2DM (n=229) | ||
| Setting | Primary care | Primary care | Hospital |
| Demographic | |||
| Age (years) | 62 [54-70] | 52 [44-61] | 61 [56-68] |
| Gender (male) | 265 (47.1) | 307 (62.3) | 136 (59.4) |
| Smoker | |||
| Never smoked | 299 (53.1) | 300 (60.9) | 94 (41.0) |
| Ex-smoker | 209 (37.1) | 41 (8.3) | 94 (41.0) |
| Smoker | 55 (9.8) | 152 (30.8) | 41 (17.9) |
| Alcohol usea | 413 (73.5) | 263 (53.3) | 65 (28.4) |
| Metabolic health | |||
| BMI (kg/m²) | 28.2 [25.0-31.6] | 28.0 [25.2-31.3] | 31.6 [28.5-35.6] |
| BMI ≥25 kg/m² | 426 (75.7) | 418 (84.8) | 214 (93.4) |
| Waist circumference (cm) | 99.5±14.5 | 93.0 [87.0-103.0] | 108.5 [98.0-117.0] |
| Diabetes type 2 | 80 (14.2) | 148 (30.0) | 229 (100.0) |
| Hypertension or treatment with anti-hypertensives | 220 (39.1) | 260 (52.47) | 188 (82.1) |
| Metabolic syndrome | 298 (55.6) | 240 (48.7) | 181 (95.8)b |
| Biochemistry | |||
| HDL (mg/dL) | 53.0 [43.0-65.0] | 48.0 [39.0-59.0] | 42.0 [36.0-49.0] |
| LDL (mg/dL) | 106.0 [82.0-133.0] | 115.0 [86.0-150.0] | 60.0 [46.0-82.0] |
| Total cholesterol | 187.0 [161.0-214.0] | 195.0 [159.0-228.0] | 138.0 [121.0-169.0] |
| Triglycerides (mg/dL) | 116.0 [84.0-163.0] | 123.0 [88.0-169.8] | 163.0 [110.0-232.0] |
| AST (U/L) | 23.0 [19.0-29.0] | 19.8 [16.0-24.0] | 26.0 [19.0-36.0] |
| ALT (U/L) | 24.0 [17.0-36.0] | 21.0 [15.9-31.0] | 30.0 [20.5-50.5] |
| GGT (U/L) | 25.0 [17.0-39.3] | 21.0 [14.0-33.4] | 42.0 [25.0-84.0] |
| Thrombocytes | 250.0 [210.0-286.0] | 248.0 [212.0-288.5] | 215.0 [178.0-275.0] |
| Liver parameters | |||
| VCTE (kPa) | 5.2 [4.1-6.5] | 4.9 [4.0-6.1] | 7.6 [5.6-11.4] |
| Fibrosis ≥F2 | 78 (13.9) | 30 (6.1) | 107 (46.7) |
| Fibrosis ≥F3-F4 | 20 (3.6) | 8 (1.6) | 51 (22.3) |
| CAP (dB/m) | 270.0 [225.0-316.0] | 241.5±48.4 | 312.0 [267.0-352.5] |
| Steatosis | 362 (64.3) | 219 (44.4) | 190 (83.0) |
Data are presented as mean ± standard deviation, median [interquartile range], or number (%).
Alcohol use was defined as the consumption of alcohol but without excessive alcohol usage (<2/3E/day women/men) as those participants were excluded.
n=189
Abbreviations: ALT: alanine aminotransferase, AST: aspartate aminotransferase, BMI: body mass index, CAP: controlled attenuation parameter, GGT: gamma-glutamyl transpeptidase, FAST: FibroScan-AST, HDL: high-density lipoprotein, LDL: low-density lipoprotein, MetS: metabolic syndrome, T2DM: type 2 diabetes mellitus, VCTE: vibration-controlled transient elastography.
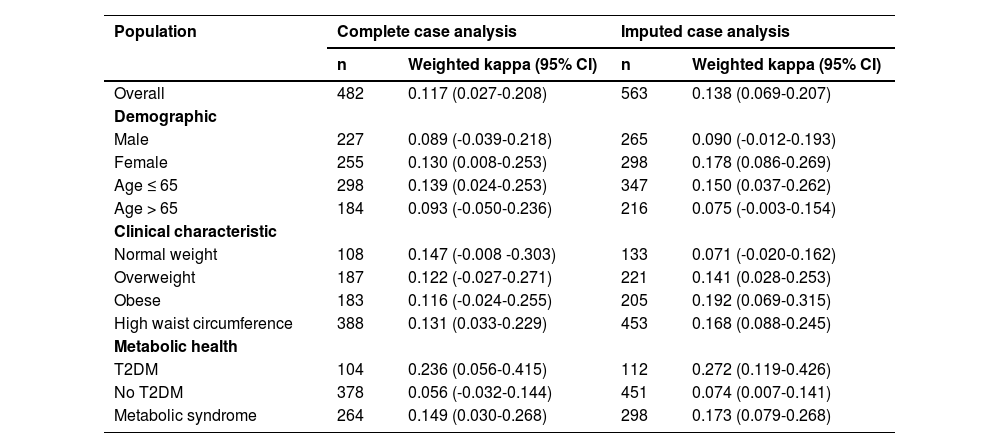
The Weighted Cohen’s kappa was applied to assess agreement between F0-F1, F2, and F3-F4 classifications for VCTE, and <1.3, between 1.3 (or 2.0 depending on age) and 2.67, and >2.67 for the FIB-4. Analysis of the total cohort showed a weighted kappa of 0.117 (95% CI, 0.027-0.208), indicating a slight agreement between VCTE and the FIB-4 (Table 2). The sub-analyses done to determine the agreement for different demographic categories, i.e., male or female, age ≤ 65 years or >65 years, or risk groups like living with overweight, obesity, T2DM, and metabolic syndrome, showed a slight to fair agreement between VCTE and FIB-4. The imputed case analysis revealed a weighted kappa value for the total cohort of 0.138 (95% CI, 0.069-0.207), which was slightly higher than that of the non-imputed dataset but still indicated a slight agreement. A similar trend was observed in the sub-analyses except for the people with normal weight, overweightness, or obesity (Table 2). While the complete case analysis showed that the weighted Cohen’s kappa of people with normal weight was better than that of obese people, the imputed data showed the opposite. Since the imputation model included key patient characteristics, accounting for notable differences between complete and incomplete cases, the outcome measures, and variables associated with steatosis and fibrosis (for details, see Supplement Missing Data), agreement estimates from multiple imputation are likely less biased than those from complete case analysis, which relies on the restrictive MCAR assumption. Nevertheless, both approaches suggest only a slight agreement between VCTE and FIB-4.
Weighted Cohen’s kappa for the complete and imputed case analysis stratified for different risk groups.
Abbreviations: CI: confidence interval, T2DM: type 2 diabetes mellitus.
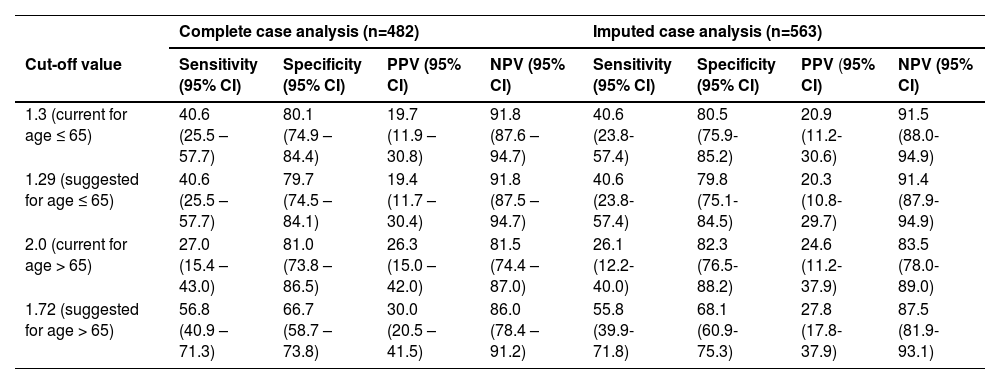
The AUROC for the diagnosis of significant fibrosis of the FIB-4 was found to be 0.654 (95% CI, 0.555-0.753) for people aged ≤ 65 years and 0.625 (95% CI, 0.524 – 0.726) for people older than 65 years (Figure S1). Similar AUROC values were found in the imputed case analysis for the age-divide groups, respectively, 0.651 (95% CI, 0.557-0.745) and 0.632 (95% CI, 0.534-0.730) (data not shown). The sensitivity, specificity, PPV, and NPV of the current FIB-4 cut-off value of 1.3 were 40.6 % (95% CI, 25.5-57.7), 80.1% (95% CI, 74.9-84.4), 19.7% (95% CI, 11.9-30.8), and 91.8% (95% CI, 87.6-94.7), respectively. For the current cut-off value of 2.0, the sensitivity, specificity, PPV, and NPV were 27.0% (95% CI, 15.4-43.0), 81.0% (95% CI, 73.8-86.5), 26.3% (95% CI, 15.0-42.0), and 81.5 % (95% CI, 74.4-87.0) (Table 3). Similar results were again observed for the imputed case analysis (Table 3).
Sensitivity, specificity, PPV, and NPV of the current and proposed cut-off values in the discovery cohort.
CI: confidence interval, PPV: positive predictive value, NPV: negative predictive value.
In an attempt to overcome the slight agreement between VCTE and FIB-4, as well as the poor AUROC values, new cut-offs were established. The Youden’s Index was determined with the highest value of 0.234, both for the lower (aged ≤ 65 years) and the higher age (aged >65 years) group. This resulted in a FIB-4 cut-off value of 1.29 for people aged 65 years or younger and 1.72 for those aged 65 years or older. The sensitivity, specificity, PPV, and NPV for both cut-off values were 40.6% (95% CI, 25.5-57.7) and 56.8% (95% CI, 40.9.8-71.3), 79.7% (95% CI, 74.5-84.1) and 66.7% (95% CI, 58.7-73.8), 19.4% (95% CI, 11.7-30.4) and 30.0% (95% CI, 20.5-41.5), 91.8% (95% CI, 87.5-94.7) and 86.9% (95% CI, 78.4-91.2), respectively (Table 3). Comparable results were also observed in the imputed case analysis (Table 3).
3.4ValidationThe newly proposed cut-off values were validated in two external cohorts: a primary care (Türkiye cohort) and a secondary care (T2DM cohort) population. The AUROC for the diagnosis of advanced fibrosis of the FIB-4 was 0.635 (95% CI, 0.501-0.768) and 0.760 (95% CI, 0.564-0.957) for people aged ≤65 years and > 65 years in the Türkiye cohort. In the T2DM cohort, the AUROC values were 0.643 (95% CI, 0.551-0.735) and 0.605 (95% CI, 0.482-0.727) for both age groups (data not shown). These AUROC values were similar to those in the discovery cohort.
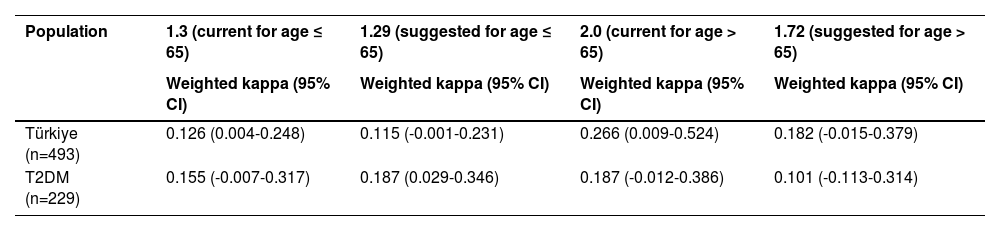
The weighted Cohen’s kappa of the current cut-off values (1.3/2.0 and 2.67) in these cohorts was 0.126 (95% CI, 0.004-0.248) and 0.266 (95% CI, 0.009-0.524), 0.155 (95% CI, -0.007-0.317) and 0.187 (95% CI, -0.012-0.386) for the Türkiye and T2DM cohorts respectively (Table 4). For the suggested cut-off values of 1.29 and 1.72 in the Türkiye and T2DM cohorts, the weighted Cohen’s kappa was 0.115 (95% CI, -0.001-0.231) and 0.187 (95% CI, 0.029-0.346), 0.182 (95% CI, -0.015-0.379) and 0.101 (95% CI, -0.013-0.314) (Table 4). When compared to the current cut-off value, only for the 1.72 cut-off value in the Türkiye cohort was the weighted Cohen’s kappa better than the current cut-off value of 2.0.
Weighted Cohen’s kappa with new cut-off values in the validation cohorts.
CI: confidence interval.
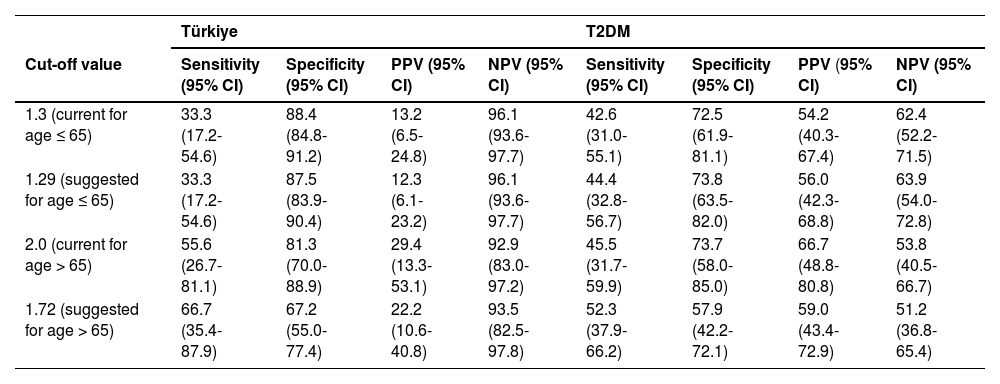
The proposed cut-off value of 1.29 had the following sensitivity, specificity, PPV, and NPV in the Türkiye and T2DM cohorts: 33.3 (95% CI, 17.2-54.6)% and 44.4 (95% CI, 32.8-56.7)%, 87.5% (95% CI, 83.9-90.4) and 73.8% (95% CI, 63.5-82.0), 12.3% (95% CI, 6.1-23.2) and 56.0% (95% CI, 42.3-68.8), 96.1% (95% CI, 93.6-97.7) and 63.9% (95% CI, 54.0-72.8) (Table 5). The performance of the 1.3 and 1.29 cut-offs are very similar in both validation cohorts. For the cut-off value of 1.72, the sensitivity, specificity, PPV, and NPV were, respectively, 66.7% (95% CI, 35.4-87.9) and 52.3% (95% CI, 37.9-66.2), 67.2% (95% CI, 55.0-77.4) and 57.9% (95% CI, 42.2-72.1), 22.2% (95% CI, 10.6-40.8) and 59.0% (95% CI, 43.4-72.9), 93.5% (95% CI, 82.5-97.8) and 51.2% (95% CI, 36.8.0-65.4) in the Türkiye and T2DM cohorts (Table 5). In both the Türkiye and T2DM cohorts, the suggested cut-off value of 1.72 outperforms the 2.0 cut-off value when it comes to sensitivity, but specificity is lower, creating both fewer false negatives and more false positives.
Sensitivity, specificity, PPV, and NPV of the current and proposed cut-off values in the validation cohorts.
CI: confidence interval, PPV: positive predictive value, NPV: negative predictive value.
We are the first to assess the agreement between VCTE and the FIB-4 in both a primary and secondary care MASLD population using the existing age-dependent cut-off values [16]. The study results indicate a slight agreement between VCTE and FIB-4, independent of demographics or risk group. This results in a high false positive or negative rate when people are referred to secondary or tertiary care based on the FIB-4 cut-offs. In addition, it leads to over-referrals and extra costs for the healthcare system. Kjaergaard et al. found that using the ≥1.3 cut-off value for the FIB-4 in a general population cohort leads to a false positive rate of 35% for the detection of significant fibrosis [31]. Similarly, Graupera et al. found a high false positive rate of 29% using data gathered from five independent cohorts across different countries [20]. In our study cohort, an over-referral rate of at least 81.6% was found for people aged ≤65 years with a cut-off ≥ 1.3, and 73.7% for people aged >65 years with a cut-off ≥2.0. The higher result could be attributed to differences in population characteristics, such as a higher prevalence of metabolic risk factors, e.g., obesity, T2DM, or metabolic syndrome. The high false positive rate could also be attributed to the fact that, like many other non-invasive scores and tools, the FIB-4 has been developed in a selected population of patients with HIV/HCV co-infection [17]. It has subsequently been promoted to screen larger populations as it is easy to use, although it has been poorly validated for that purpose or validated only in highly selected MASLD cohorts.
Next, the AUROC of FIB-4 was assessed, and it was found that FIB-4 had poor discriminative ability in our study cohort. Previous studies found better results concerning the AUROC value when using VCTE or liver biopsy as a reference. For example, Ding et al. found an AUROC of 0.728 (0.651-0.806) for diagnosing fibrosis ≥ F2 and 0.821 (0.741-0.901) for diagnosing fibrosis ≥ F3 [32]. The study cohort in their research differs from ours, exhibiting higher AST (32.2 ± 23.9 U/L) and ALT (50.3 ± 41.7 U/L) levels but lower thrombocyte values (222.6 ± 82.4 *109/L). Additionally, their mean VCTE is higher (8.9 kPa ± 10.6), leading to a greater proportion of participants with advanced fibrosis stages than our study cohort. Furthermore, they included individuals seen at the gastroenterology department, which led to a selection bias that could explain the better AUROC that was found, as performance is dependent on the prevalence. Screening is, however, to be performed in low-prevalence settings, as in our cohort, making our observation very relevant when it comes to the reliability of FIB-4 as a first-line screening test. A meta-analysis by Sun et al. compared the FIB-4 to the MASLD fibrosis score and BARD score to predict advanced fibrosis in a biopsy-proven MASLD cohort [33]. They found that the 1.30 cut-off value had a sensitivity of 0.844 (0.772-0.901) and a specificity of 0.685 (0.654-0.716) with an AUROC of 0.8496 ± 0.0680. These results were, hence, also considerably better than ours, though this could be attributed to differences in the selected study cohorts. Only one of the four study cohorts in the meta-analysis collected data cross-sectionally; the other cohorts were retrospective and possibly suffered from selection bias.
As the current age-dependent cut-off values underperformed in the study cohort with low sensitivity but high NPV, we determined two new age-dependent cut-off values, 1.29 (≤65 years) and 1.72 (>65 years). The newly suggested cut-off values were based on a higher sensitivity, as the prevalence of MASLD influences NPV. Validation in the two external cohorts showed that the newly proposed cut-offs only performed slightly better, with only a marginally higher sensitivity and NPV. Moreover, it was also noticed that the AUROC for the FIB-4 was acceptable in the Türkiye cohort, especially in people older than 65 years. These results should be interpreted with caution, as the likely small sample size in this subgroup is reflected in the excessively wide 95% CI. In the T2DM cohort, however, the performance of the FIB-4 was mediocre at best, independent of the current or suggested cut-off values used. Additionally, the agreement was especially low in the population without T2DM, while it was slightly higher in the population with T2DM. This underscores the fact that FIB-4 does not perform well in the well-established risk group of people with T2DM [34], as seen in previous research [18,35,36]. For instance, Kim et al. compared the FIB-4 with liver biopsy and found an overall AUROC value of 0.79. When separating the study population into a group with T2DM and a group without, the AUROC of the FIB-4 for detecting advanced fibrosis was 0.68 for individuals with T2DM versus 0.85 for individuals without T2DM (p = 0.003) [18]. Another study by Bril et al. comparing the FIB-4 with VCTE results found an AUROC of 0.59 for significant fibrosis and 0.63 for advanced fibrosis in predicting fibrosis in individuals with T2DM [35]. Furthermore, the FIB-4 and VCTE agreement was also poor in obese individuals in our study cohort. Foregoing research has shown that the FIB-4 has significantly lower AUROCs for advanced fibrosis in obese MASLD patients versus non-obese MASLD patients [37].
Lastly, in the study cohort, a false negative rate of 8.8% was found for those aged ≤65 years with a cut-off ≥1.3, but when compared to those aged >65 years, a false negative rate of 18.5% was found with a cut-off ≥2.0. Usage of the FIB-4 consequently would lead to missing 10-20% of the fibrotic cases, or between 266 and 531 million people worldwide. These results, combined with the knowledge that the FIB-4 cannot be used in people younger than 35 years (the latter being a problem as the MASLD population grows younger [38]), lead us to conclude that the FIB-4 is not an ideal screening tool to use both in the general population and in at-risk groups [39]. This also emphasises that it is vital to keep the context of use in mind when designing new scores or determining different cut-off values. Moreover, one must bear in mind that the parameters used in the FIB-4 formula are indirect markers for estimating fibrosis severity.
We therefore propose using other non-invasive scores specifically designed to screen for fibrotic MASLD, like the recently proposed MAF-5 score [40]. The MAF-5 outperformed the FIB-4 in our dataset with an AUROC of 0.766 (0.701-0.830). However, the FIB-4 could possibly be used as a predictor for fibrosis progression, liver and non-related liver events, and mortality, as several studies have shown [41–45]. The FIB-4 had a prognostic accuracy for fibrosis progression ranging from an AUROC of 0.65 (0.64-0.76) to 0.81 (0.73-0.89). Nonetheless, the details of the corresponding threshold values are poorly reported. One study used a threshold of 0.2 with an AUROC of 0.68 (0.60-0.76), an NPV of 91%, and a PPV of 38.3% [45]. As for liver-related events and mortality, the AUROC ranged from 0.71 to 0.89 and 0.67 to 0.82, respectively [44]. While the data from these studies seem promising, Hagström et al. concluded that the FIB-4 has limited predictive value for liver-related events in a primary care cohort, especially on an individual patient level [46]. Although it may be useful on a population scale, its reliability for individual risk assessment is poor. Furthermore, the FIB-4 cannot be used as a treatment response marker, as a lot of other factors influence liver transaminase levels.
This study possesses several notable strengths that enhance its scientific rigour and the reliability of its findings. A key strength of this study is that the main cohort was recruited in primary care, making it highly representative of the real-world context in which screening approaches are intended to be used. Unlike most studies that develop biomarkers for screening in secondary care or highly selected populations, this study directly assesses their performance in a primary care setting. Additionally, the relatively low prevalence of advanced disease in this cohort enables a more reliable evaluation of diagnostic accuracy within the intended screening population of those in primary care. The next major strength is the large sample size, which met the calculated requirements, ensuring sufficient precision in estimating agreement. The results were further strengthened by using validated measurement methods, contributing to their credibility. A unique aspect of the study was its single-meeting design, which simultaneously minimises temporal variability by collecting all measurements, such as anthropometric data and FibroScan® assessments. This approach eliminates potential discrepancies arising from changes in participants' conditions over time and ensures that the data represent their health status at a specific moment. Additionally, this design reduced the risk of participant dropout, further supporting the achievement of a robust sample size. The study's broad inclusion criteria are another significant strength, as they allowed for the inclusion of individuals from diverse risk groups, such as those with T2DM and obesity. This diversity ensures that the results are not limited to a single demographic or clinical population, enhancing the generalizability of the findings to various groups. Finally, the well-characterised population and detailed data collection ensured robust data quality, providing a strong foundation for the study's conclusions and adding value to its contribution to the field.
This study has several limitations that should be considered when interpreting the findings. First, the lack of liver biopsy, the gold standard for diagnosing liver fibrosis, is a potential limitation [47]. While FibroScan® is widely used, it does not entirely replace the precision of biopsy-based diagnosis. This was addressed by using FibroScan® as the reference standard, given its widespread validation and use for diagnosing liver fibrosis. Secondly, the number of participants with fibrosis grades F2 or F3-F4 was limited, making it impossible to assess whether the FIB-4 performs differently in individuals with higher grades of fibrosis. Moreover, FibroScan results can vary slightly depending on the operator's skill, although the investigators ensured adequate training before initiating the study. Also, only measurements meeting the quality standard criteria were included. Third, selection bias could not be completely avoided; flyers were distributed in the waiting rooms of endocrinology departments and primary care clinics, but these were mainly taken by older people, as children were excluded from the study. This led to a higher median age in the discovery cohort. Lastly, some participants were referred by their GP or endocrinologist based on abnormal laboratory results, which could further influence the study population.
5ConclusionsThe agreement between VCTE and the FIB-4 in this study was too low to support the use of FIB-4 as a reliable diagnostic test for liver fibrosis in individuals with and without risk of fibrosis. Moreover, the FIB-4 demonstrated poor discriminative ability compared to VCTE, with low sensitivity across the different cut-off values. Additionally, the high false-negative rate of the FIB-4 further limits its clinical applicability, making its use in routine practice challenging. These findings and previous research indicate that the FIB-4 is unsuitable for liver fibrosis screening. Further research is needed to refine cut-off values or explore alternative non-invasive diagnostic tests.
FundingAuthor L.JM.H is funded by a fellowship of Fonds Wetenschappelijk Onderzoek (FWO) (1S73421N).
Author ContributionsL.JM.H. and D.v.M. contributed to the conception and design, acquired data, analysed and interpreted data, drafted the manuscript, revised the manuscript critically for important intellectual content, and provided final approval of the version to be published. L.JM.H. and D.v.M. are also the guarantors of this work and, as such, had full access to all the data in the study and took responsibility for the integrity of the data and the accuracy of the data analysis. The co-authors G.D.U, F.I., M.S., C.v.S., S.F., G.R. and G.H.K. contributed to the conception and design, revised the manuscript critically for important intellectual content, and provided final approval of the version to be published.
None.
The PhD author of this review is part of the ‘Limburg Clinical Research Centre (LCRC), supported by the foundation Limburg Sterk Merk, province of Limburg, Flemish government, Hasselt University, Ziekenhuis Oost-Limburg, and Jessa Hospital. We want to acknowledge the staff of the following general practitioner practices: Groepspraktijk De Dam, Huisartsenbox, Gezondheidscentrum Sirona, Groepspraktijk Luce, W-Care Hoeselt, Dr. Gilio, Huisartsenpraktijk Medi-Mine, Huisartsen Termolen, Gezondheidscentrum Heer, Dokters van Hier, Huisartsenpraktijk Dorine Verschure and Huisartsenpraktijk Bandkeramiek.
articles


![]()