


Background. Gallstone disease (GSD) is a common chronic disease in the Western hemisphere, yet environmental and genetic factors may be responsible for the variations in the prevalence of GSD among populations.
Aim. To analyze the relationship of the ApoE and FABP2 polymorphisms with diet, physical activity and emotional health in patients with GSD from West Mexico.
Material and methods. A total of 120 patients with GSD and 370 healthy subjects were enrolled. Anthropometric, biochemical, nutritional, clinical and physical activity parameters were measured. ApoE and FABP2 genotypes were assesed by PCR-RFLPs assays.
Results: ApoE E3/E4 genotype and the ApoE E4 allele was highly prevalent among the GSD patients compared to the controls (32% vs. 12.0% and 22% vs. 8.4% respectively p < 0.01). Patients with the Apo E4 allele showed an upward trend of cholesterol levels compared to non-Apo E4 allele carriers (E4 186 ± 30 mg/dL; E3 143 ± 37 mg/dL; E2 129 ± 34 mg/dL). High triglyceride levels were associated with patients that were FABP2 Thr54 allele carriers (p < 0.05) but lacked association with GSD. This may be due to changes in dietary fats after GSD diagnosis, masking the clinical course of the disease. Sedentary lifestyle and negative emotions were detected in 83% and 63% of patients, respectively.
Conclusion. These data suggest that the Apo E4 allele could confer genetic susceptibility for the development of GSD among the Mexican population. The Ala54Thr polymorphism of FABP2 was associated with high triglycerides levels, but not to GSD; suggesting that environmental factors modulate such susceptibility.
Prevalence studies of gallstone disease (GSD) indicate a strong influence of geography and ethnicity, which in turn affects the epidemiology and risk factors of this disease.1–3 Formerly, GSD had been considered as a health problem mainly concerning the industrialized countries of the Western hemisphere.4 However, at present, GSD may constitute an important cause of morbidity in the developing countries, parallel to the acceleration of obesity worldwide.5 Mexico’s prevalence of GSD was estimated among a necropy series at 14.3 %.6 However, the actual rate may be even higher due to the rapid westernized lifesytle modifications that have occurred in the last thirty years in Mexico,7 which may be equal to the rate seen among the Mexican-Americans in the United States (27%).1
GSD is a complex metabolic disorder that consists of the formation of either cholesterol or pigment stones in the biliary system due to an impaired metabolism of cholesterol, bilirubin and bile acids.2 There are three main mechanisms that drive lithogenesis: cholesterol supersaturation of the bile, gallbladder hypomotility and kinetic, pro-nucleating protein factors.2,7 Cholesterol gallstones are more frequent in patients from the Western hemisphere than elsewhere.1,2 Risk factors for GSD are both un-modifiable and modifiable.1 Amongst the former are female gender, age, familty history and genetic disposition,7,8 whereas in the latter are several metabolic conditions related to obesity/metabolic syndrome and dyslipidemia,9 as well as environmental factors such as physical inactivity and diet.1 Therefore, the interactions between the genetic and environmental factors may differ in Mexico from those reported among other populations worldwide.3,7,10–12
In regards to the genetic component of GSD, variants of the heterodimeric cholesterol transporter ABCG5/8 are known to confer an increased risk for GSD by increasing the secretion of colesterol.13,14 Nonetheless, a key candidate gene in cholesterol metabolism is also Apolipoprotein E (Apo E), the main protein entity of the triglyceride-rich VLDL, LDL and chylomicron remnant particles.15,16 The Apo E gene encodes three genetic variants E2, E3 and E4 that differ according to the combination of the arginine/cysteine amino acid substitutions at positions 112 and 158 on exon 4. Apo E3 allele is the wild type isoform that generally binds Apo E-containing lipoproteins (VLDL, HDL, chylomicrons) to their receptors (E/B, rLDL). However, E2 isoform binds defectively to the LDL receptors, whereas the E4 isoform has a higher affinity for triglyceride-rich lipoproteins that increases the liver uptake of these lipoproteins; consequently LDL receptors are down-regulated.15–17 Homozygotic (E4/E4) or heterozygotes (E4/E2 or E4/E3) E4 allele carriers tend to have higher levels of LDL and total cholesterol. Therefore, the presence of one E4 allele leads to an increased uptake of chylomicrons and decreases the expression of the LDL receptor, which may result in reduced synthesis of bile salts and lower salt secretion rates.18,19
Furthermore, FABP2 gene encodes the intestinal fatty acid binding protein. The alanine (Ala)/threo-nine (Thr) substitution at codon 54 in exon 2 (Thr54 isoform) has a higher affinity for dietary long-chain fatty acids than the Ala54 isoform.20,21 The Thr54 allele has been associated with higher plasmatic triglycerides22 and free fatty acids levels.23 Additionally, a higher postprandial lipidemic response,24 and more elevated postprandial glucose and insulin levels20,25 have been strongly associated with the development of GSD.
Therefore, ApoE and FABP2 polymorphisms are likely to have implications for the genesis of cholesterol gallstones, while interactions with environmental factors may cause variability in GSD’s prevalence worldwide.26–30 In this study, we sought to analyze the relationship of the ApoE and FABP2 polymorphisms with diet, physical activity and emotional health in a group of patients with GSD from Western Mexico.
Materials and MethodsPatientsA total of 120 patients with a diagnosis for GSD by ultrasound screening before surgery was included. All subjects had symptomatic gallstones. This study was conducted between April 2007 and December 2009 in Guadalajara, Jalisco, Mexico. All laboratory tests were performed at the Department of Molecular Biology in Medicine, Civil Hospital of Guadalajara “Fray Antonio Alcalde”. The inclusion criteria were patients of both genders, over 18 years of age, with an ultrasonographic diagnosis of GSD. Non-inclusion criteria were current use of oral contraception, hormone replacement therapy, lipid-lowering drugs, pregnancy, and parenteral nutrition. Exclusion criteria in 30 patients were incomplete evaluations, insufficient blood sample, and DNA degradation.
All subjects were evaluated by trained personnel from the same department to ensure inter-observer consistency. Two radiologists who were blinded to all clinical data and the purpose of the study provided the ultrasonographic diagnosis of GSD. Also, as a control group, 370 subjects with no gallstones detected by ultrasonography were included to match the allelic frequencies of ApoE and FABP2 polymorphisms. The ethnicity of patients and control subjects was considered as Mexican mestizos. The study was approved by the local Ethics Committee. All subjects included in the study gave informed written consent according to the Guidelines of the Declaration of Helsinki 2000.
Clinical evaluationEach patient underwent a complete medical history and physical examination. Demographics such as age, gender and birthplace, and clinical variables such as height, body mass index (BMI), waist, and hip circumferences were registered. The medical history included family history of GSD and past or current co-morbidities.
Patients’ nutritional assessment was performed by two 24-hour diet recall questionnaires. One related to their diet before cholecystectomy and another post-cholecystectomy. Likewise, physical activity was assessed by a structured “Physical Activity Questionnaire” (PAQ) that contained a detailed description of the daily activities per 24 hours.31 Emotional health was evaluated by items derived from the quality of life questionnaire SF-36.32 Open questions about the emotional state were obtained by self-evaluation from each patient.33
Anthropometric measurementsWaist and hip circumferences were measured with a flexible tape measure, placed at the midpoint of the lower border of the rib cage and the iliac crest and the widest point between the hip and the buttock, respectively. Bioelectric impedance assessed BMI and body composition (In Body 3.0 equipment, Biospace, Co., Ltd.).34
Blood sampling and biochemical determinationsBlood samples were obtained from ante cubital vein puncture after a 12 h overnight fast and stored in two separate tubes (with and without EDTA). Routine biochemical tests were performed using manual kits (Human Biochemica and Diagnostica. Wiesbaden, Germany). CHOD-PAP method was used for the determination of total cholesterol and HDL, direct enzymatic test for LDL (HUMAN), GPO-PAP method for triglycerides, (JENDRASSIK-Grof ) or bilirubin and a kinetic method for ALT and AST measurements (HUMAN). Glucose was determined by an enzymatic colorimetric assay. Insulin was determined by an automated IMX system (ABBOTT Insulin 2A10, 46-3898/R6) using the microparticle enzyme immune assay (ABBOTT laboratories, North Chicago, IL). Serum Apo A-1 and Apo B were determined by nephelometry rate in an Array 360 CE System (Beckman, Fullerton. CA.USA). VLDL concentration was calculated as total cholesterol (LDL + HDL). Insulin resistance (IR) was calculated by means of the homeostasis model assessment (HOMA-IR). HOMA-IR = [fasting insulin (µU/ mL)-fasting glucose (mmol/L)]/22.5.35
Clinical criteriaThe World Health Organization (WHO) parameters were used to assess normal weight, overweight and obesity. Patients were classified for risk of metabolic complications associated with obesity according to waist circumference (WC). High risk was assessed at >102 cm of WC for men and > 88 cm of WC for women, according to the WHO. Dyslipidemia was classified according to the European Society of Atherosclerosis criteria of 2003.36 IR was defined by HOMA index >2.5.35
Genotyping of ApoE gene polymorphismsGenomic DNA was extracted from peripheral leukocytes using the “salting out” method previously described by Miller.37 ApoE genotypes was assessed by a polymerase chain reaction (PCR) as reported elsewhere38 and by a restriction fragment length polymorphism (RFLP) assay. Briefly, 45 of the amplified PCR product (244 pb) was digested with 5 U of restriction enzyme HhaI (New England BiolabsInc, Beverly MA) in a total volume of 50 µL. After 4 hours of incubation at 37 oC, the digested samples were resolved by electrophoresis on a 5% agarose metaphor gel and visualized by ethidium bromide staining. PCR digested products were cleaved by HhaI into 91 bp and 48 bp for the E3 allele, 91 bp and 83 bp for the E2 allele and 72 bp and 48 bp for the E4 allele.38 Fifteen percent of the samples were genotyped twice to eliminate errors.
Genotyping of FABP2 gene polymorphismsGenomic DNA was extracted from peripheral leukocytes using the “salting out” method previously described by Miller, et al.37 A PCR-RFLP assay was developed for genotyping FABP2. The genomic DNA fragment flanking the Ala54Thr polymorphism was amplified using two primers in the exon 2 of the FABP2 gene. The PCR was carried out with 500 ng of genomic DNA, 1.25 U of Taq DNA polymerase (Invitrogen, Carlsbad, CA), 50 mM KCl, 10 mM Tris-HCl (pH = 8.3), 1.5 mM MgCl2, 200 nM deoxynucleotide triphosphates, and 0.1 of each primer (Sense primer: 5’-ACAGGTGTTAATATAGTGAAAAG-3; Antisense primer: 5’-CTAGCAGACGGAACTGAACTCAG-3’) in a 50 final volume. DNA was firstly denatured at 94 oC for 5 min; this was followed by 35 cycles at 94 oC for 45 sec, at 55 oC for 1 minute and at 72 oC for 45 sec, with a final extension at 72 oC for 5 min. 20 µL of amplified PCR product (176 pb) was digested with 2.5 U of restriction enzyme HhaI (New England BiolabsInc, Beverly MA) in a total volume of 30 µL. After incubation at 37 oC for three hours, digested samples were resolved by electrophoresis on a 3% agarose gel and visualized by ethidium bromide staining. The Thr54 allele lacks the HhaI restriction site and migrates as a single 176 bp fragment, but Ala54 allele containing the Hha I restriction site are cleaved into two fragments of 100 bp and 76 bp.39 Fifteen percent of all samples were randomly selected for duplicate genotyping to eliminate errors.
Statistical analysisA sample size of 86 individuals per group was calculated to detect differences (delta) of 0.14 in polymorphism frequencies between the groups, with 80% power and 5% significance. Statistical analysis was performed using the SPSS/PC software (19.0 version Chicago, IL, USA, 2010). The results are expressed as means and standard deviation. Allelic frequencies were estimated with the gene-counting method. The allelic differences between groups were calculated by χ2 test (quantitative variables). Differences inter groups classification was performed with t test and/or analysis of variance (ANOVA) as it corresponds. A regression analysis was used to compare the difference between groups. The comparison between groups was adjusted to the physical activity level. A p value< 0.05 was considered statistically significant.
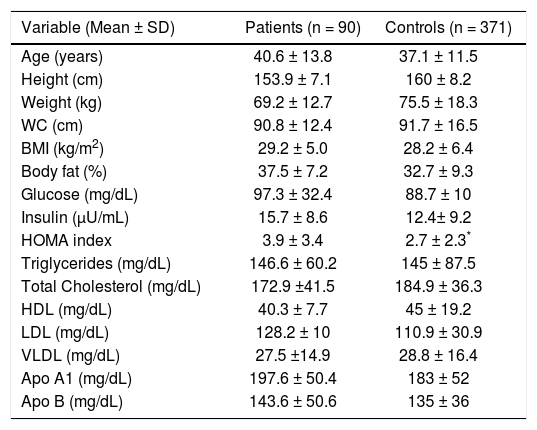
ResultsClinical, demographic, anthropometric and biochemical variables of GSD patientsThe overall age of the study group was 40.6 ± 14 years, 92% were female and 53% had a family history of GSD. The most frequent symptoms were right upper quadrant pain (98%), followed by nausea (63%) and vomiting (57%). Factors associated with right upper quadrant pain were the consumption of fatty foods (22%), angry emotional state (18%), the consumption of dairy products, (16%), chili (14%), eggs (8%), and avocado (5%). Anthropometric and biochemical parameters are shown in table 1. According to the WHO criteria, 16% had normal weight; 34% of patients were overweight and 50% obese. The dyslipidemias present in 95% of the patients was hypoalphalipoproteinemia, 39%; hypertrygliceridemia, 24%; hypercholesterolemia, 19% and mixed hyperlipidemia in 13%. Other metabolic abnormalities such as IR (56%), hypertension (14%), type 2 diabetes mellitus (7%), elevated serum levels of apolipoprotein A1 and Apo B (69% and 72% respectively), AST ≥ 40 UI/L (18%), ALT ≥ 55 UI/L (22%), GGT ≥ 50 UI/L (33%) were also found.
Clinical, demographic, anthropometric and biochemical characteristics of patients with gallstone disease and control group.
| Variable (Mean ± SD) | Patients (n = 90) | Controls (n = 371) |
|---|---|---|
| Age (years) | 40.6 ± 13.8 | 37.1 ± 11.5 |
| Height (cm) | 153.9 ± 7.1 | 160 ± 8.2 |
| Weight (kg) | 69.2 ± 12.7 | 75.5 ± 18.3 |
| WC (cm) | 90.8 ± 12.4 | 91.7 ± 16.5 |
| BMI (kg/m2) | 29.2 ± 5.0 | 28.2 ± 6.4 |
| Body fat (%) | 37.5 ± 7.2 | 32.7 ± 9.3 |
| Glucose (mg/dL) | 97.3 ± 32.4 | 88.7 ± 10 |
| Insulin (μU/mL) | 15.7 ± 8.6 | 12.4± 9.2 |
| HOMA index | 3.9 ± 3.4 | 2.7 ± 2.3* |
| Triglycerides (mg/dL) | 146.6 ± 60.2 | 145 ± 87.5 |
| Total Cholesterol (mg/dL) | 172.9 ±41.5 | 184.9 ± 36.3 |
| HDL (mg/dL) | 40.3 ± 7.7 | 45 ± 19.2 |
| LDL (mg/dL) | 128.2 ± 10 | 110.9 ± 30.9 |
| VLDL (mg/dL) | 27.5 ±14.9 | 28.8 ± 16.4 |
| Apo A1 (mg/dL) | 197.6 ± 50.4 | 183 ± 52 |
| Apo B (mg/dL) | 143.6 ± 50.6 | 135 ± 36 |
Values are expressed as mean ± standard deviation.
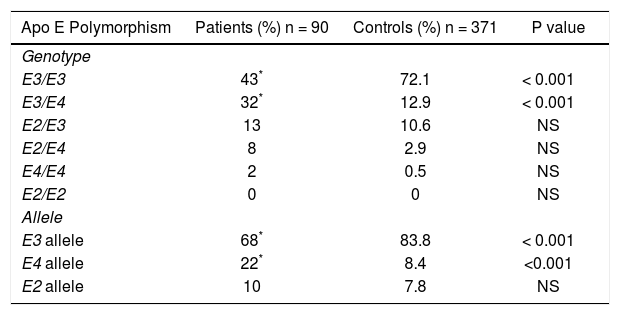
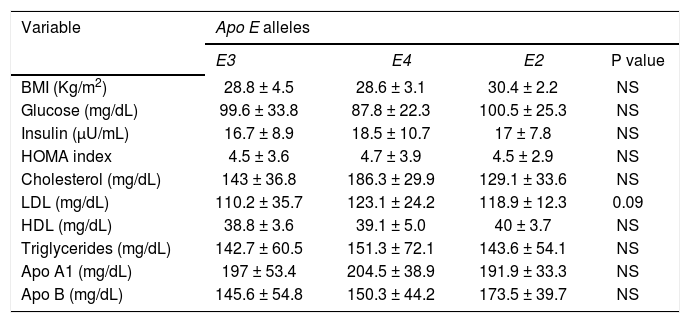
The frequencies of ApoE genotypes and allele’s frequencies are shown in table 2. The high prevalence of the E3/E4 genotypes (32%) and the E4 allele (22%) among the GSD patients was significantly greater than the control group (p < 0.001). Patients carrying the E4 allele had a tendency to have higher cholesterol, LDL, triglycerides plasma levels than patients with the other alleles (E4 vs. E3 and E2). The data are shown in table 3.
Comparison of Apo E genotype and allelic frequencies of patients with gallstone disease and control group.
| Apo E Polymorphism | Patients (%) n = 90 | Controls (%) n = 371 | P value |
|---|---|---|---|
| Genotype | |||
| E3/E3 | 43* | 72.1 | < 0.001 |
| E3/E4 | 32* | 12.9 | < 0.001 |
| E2/E3 | 13 | 10.6 | NS |
| E2/E4 | 8 | 2.9 | NS |
| E4/E4 | 2 | 0.5 | NS |
| E2/E2 | 0 | 0 | NS |
| Allele | |||
| E3 allele | 68* | 83.8 | < 0.001 |
| E4 allele | 22* | 8.4 | <0.001 |
| E2 allele | 10 | 7.8 | NS |
NS: non significant.
Biochemical parameters in patients with gallstone disease adjusted by Apo E alleles.
| Variable | Apo E alleles | |||
|---|---|---|---|---|
| E3 | E4 | E2 | P value | |
| BMI (Kg/m2) | 28.8 ± 4.5 | 28.6 ± 3.1 | 30.4 ± 2.2 | NS |
| Glucose (mg/dL) | 99.6 ± 33.8 | 87.8 ± 22.3 | 100.5 ± 25.3 | NS |
| Insulin (μU/mL) | 16.7 ± 8.9 | 18.5 ± 10.7 | 17 ± 7.8 | NS |
| HOMA index | 4.5 ± 3.6 | 4.7 ± 3.9 | 4.5 ± 2.9 | NS |
| Cholesterol (mg/dL) | 143 ± 36.8 | 186.3 ± 29.9 | 129.1 ± 33.6 | NS |
| LDL (mg/dL) | 110.2 ± 35.7 | 123.1 ± 24.2 | 118.9 ± 12.3 | 0.09 |
| HDL (mg/dL) | 38.8 ± 3.6 | 39.1 ± 5.0 | 40 ± 3.7 | NS |
| Triglycerides (mg/dL) | 142.7 ± 60.5 | 151.3 ± 72.1 | 143.6 ± 54.1 | NS |
| Apo A1 (mg/dL) | 197 ± 53.4 | 204.5 ± 38.9 | 191.9 ± 33.3 | NS |
| Apo B (mg/dL) | 145.6 ± 54.8 | 150.3 ± 44.2 | 173.5 ± 39.7 | NS |
Values are expressed as mean ± standard deviation. BMI: Body Mass Index. LDL: low density lipoprotein. HDL: high density lipoprotein. HOMA: homeostasis model assay. Apo A1: apolipoprotein A1. Apo B: apolipoprotein B.
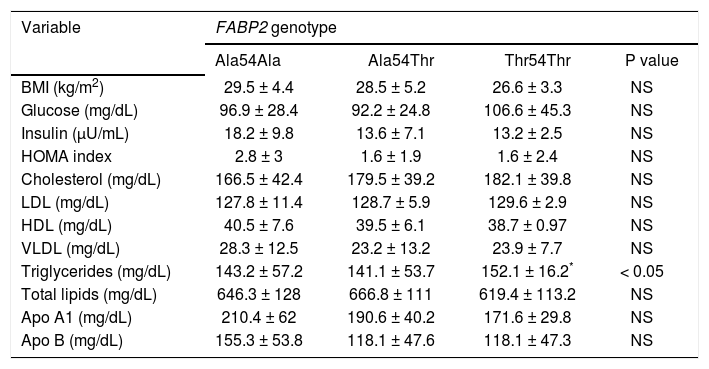
In patients with GSD, 44 subjects were identified with Ala54Ala (48.6%), 42 subjects with Ala54Thr (46.8%), and four subjects with Thr54Thr (4.6%). The frequencies of the Ala54 and Thr54 allele were 0.72 and 0.28, respectively. When this data was compared to the rate from the control group, there were no statistically significant differences. The genotypes distribution was concordant with the Hardy Weinberg law (p = 0.59). Anthropometric and biochemical parameters according to the FABP2 genotypes are shown in table 4. For the statistical analysis, subjects with Ala54Thr and Thr54Thr genotype were grouped together and compared to with the Ala54Ala carrier group. No association was found between FABP2 genotypes and the studied variables. The Thr54 allele of FABP2 was significantly associated with the triglycerides concentration in GSD patients (p < 0.05).
Biochemical parameters of patients with gallstone disease adjusted by FABP2 genotype.
| Variable | FABP2 genotype | |||
|---|---|---|---|---|
| Ala54Ala | Ala54Thr | Thr54Thr | P value | |
| BMI (kg/m2) | 29.5 ± 4.4 | 28.5 ± 5.2 | 26.6 ± 3.3 | NS |
| Glucose (mg/dL) | 96.9 ± 28.4 | 92.2 ± 24.8 | 106.6 ± 45.3 | NS |
| Insulin (μU/mL) | 18.2 ± 9.8 | 13.6 ± 7.1 | 13.2 ± 2.5 | NS |
| HOMA index | 2.8 ± 3 | 1.6 ± 1.9 | 1.6 ± 2.4 | NS |
| Cholesterol (mg/dL) | 166.5 ± 42.4 | 179.5 ± 39.2 | 182.1 ± 39.8 | NS |
| LDL (mg/dL) | 127.8 ± 11.4 | 128.7 ± 5.9 | 129.6 ± 2.9 | NS |
| HDL (mg/dL) | 40.5 ± 7.6 | 39.5 ± 6.1 | 38.7 ± 0.97 | NS |
| VLDL (mg/dL) | 28.3 ± 12.5 | 23.2 ± 13.2 | 23.9 ± 7.7 | NS |
| Triglycerides (mg/dL) | 143.2 ± 57.2 | 141.1 ± 53.7 | 152.1 ± 16.2* | < 0.05 |
| Total lipids (mg/dL) | 646.3 ± 128 | 666.8 ± 111 | 619.4 ± 113.2 | NS |
| Apo A1 (mg/dL) | 210.4 ± 62 | 190.6 ± 40.2 | 171.6 ± 29.8 | NS |
| Apo B (mg/dL) | 155.3 ± 53.8 | 118.1 ± 47.6 | 118.1 ± 47.3 | NS |
Values are expressed as mean ± standard deviation.
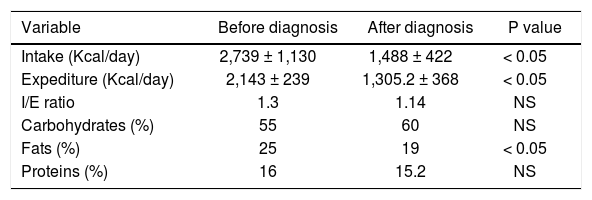
Ninety percent of the patients reduced the consumption of fatty foods after the diagnosis of GSD. In 61% of the patients, those who favored fried foods changed to non-fried food, either roasted or baked. These dietary modifications significantly reduced the proportion of dietary fats (p < 0.05). Also, the current total energy consumption was reduced by 30% (p < 0.05), when compared to the pre-diagnosis diet. The modifications in the macronutrient composition of the current diet were a reduction in the percentage of fats from 25% to 19%, carbohydrates increased from 55% to 60% (not statistically significant) and the proportion of proteins was stable (15.2%). Also, the cholesterol content/ingestion diminished 57%. The total calorie intake was higher before the GSD diagnosis than after the GSD diagnosis (2839 ± 1130 kcal/day vs. 1466 ± 465 kcal/day, respectively (p < 0.01). Data are shown in table 5.
Daily caloric intake and energy expenditure in patients with gallstone disease.
| Variable | Before diagnosis | After diagnosis | P value |
|---|---|---|---|
| Intake (Kcal/day) | 2,739 ± 1,130 | 1,488 ± 422 | < 0.05 |
| Expediture (Kcal/day) | 2,143 ± 239 | 1,305.2 ± 368 | < 0.05 |
| I/E ratio | 1.3 | 1.14 | NS |
| Carbohydrates (%) | 55 | 60 | NS |
| Fats (%) | 25 | 19 | < 0.05 |
| Proteins (%) | 16 | 15.2 | NS |
BMI: body mass index. Intake: caloric intake (kcals/day). Expenditure: Energy expenditure (kcals/day). PAQ: Physical Activity Questionnaire. I/E: Intake/Expenditure index. The time period between the before and after of diagnostic was not more than 90 days.
Sedentary lifestyle was present in 83% of the patients. The primary activities reported from these patients were: sleeping, household work and TV watching. Patients maintained an average calorie expenditure of 2143 ± 239 kcal/day. Energy expenditure/calorie intake ratio (E/I) evaluated according to their nutritional state, was similar in most patients. Obese patients were older than overweight and normal weight patients (averages 44 ± 13, 37 ± 11 and 33 ± 13 years respectively, p < 0.05). Thirty-four percent of these patients were obese in childhood or adolescence and 38% after pregnancy. Only 27% of these patients followed a weight-reducing diet. The energy consumption before and after diagnosis in patients with GSD classified according to their BMI was similar in all groups. The difference between intake and energy expenditure according to the PAQ test resulted in a calorie intake 40% to 60% higher than energy expenditure. Data are shown in table 5.
Emotional healthThe presence of constant negative emotions (concern, anger, edginess, apprehension, sadness) was present in 64% of the patients. Meanwhile, emotional health assessment of GSD patients was as follows: bad (26.2%), regular (13.1%), good (15.5%) and excellent (45.2%).
DiscussionIn this study, Apo E and FABP2 polymorphisms, as well as diet, physical activity and emotional state were evaluated in symptomatic GSD patients from Western Mexico. The genetic architecture of the Mexican population is the result of a recent admixture of a higher proportion of Amerindian, European and in a less degree African race populations with a dissimilar lineage distribution.40,41 An example of this genetic heterogeneity is the Apo E allele frequency among the Mexican population. While the E2 allele has been associated with descendants of Europeans, E3 is predominant among the inhabitants of Central Mexico. E4 allele has been linked to those who are descendants of Africans or those belonging to some Amerindian groups.41,42
In West Mexico, the frequency of E2. allele is among the highest reported in the country, which is consistent with the presence of a predominantly white-skin population in the metropolitan area of Guadalajara. Contrarily, among the native Huic holes population living in rural areas, the Apo E4 allele is predominant,40 and so is the FABP2 Thr54 allele. In general, E4 allele has been associated with hypercholesterolemia and with the formation of gallstones.19,26,27,29 while the FABP2 Thr54 allele has been related to hypertriglyceridemia and insulin resistance in different research studies.25,39,43 However, the association of the polymorphic allele with any dyslipidemia depends on the particular set of environmental factors belonging to each study population.
In this study, we identified a high frequency of E4 allele in patients with GSD compared with E2 and E3 allele carriers (p<0.001). Our findings are consistent with studies carried out in cholecystectomized patients from Finland and in case-control study from Spain.26 Interestingly, the prevalence of the heterozygote state (E3/E4) was also significantly higher in the GSD group compared to the control group (p<0.001). Furthermore, in this study, an upward trend of cholesterol levels was seen among the Apo E4 allele carriers, that was not significant; nor was FABP Thr54 allele with hypertriglyceridemia. Likewise, other authors have not found an association between the E4 allele and cholesterol gallstones among high-risk populations such as Chile, Germany and Japan.28,29 Some potential reasons that may explain these differences may be sample size, study design, as well as genetic and environmental factors of each population.
However, two factors may be considered to explain how they are involved in the modulation of the lipid levels:
- 1.
At the time of diagnosis, the GSD patients had temporarily changed their eating habits, by reducing the calorie intake of fat that was reflected later on by their serum lipid values.
- 2.
The leading dyslipidemias among the Mexican population, including the western population, are hypertriglyceridemia and hypercholesterolemia.44
In Western Mexico, dyslipidemias are associated with a higher intake of fat-rich food and simple carbohydrates.45 These factors per se can generate changes in serum lipid levels regardless of the individual’s genetic background that may mask the expected effect of primary dyslipidemia due to genetic polymorphism. This same condition can also explain the small differences found in the lipid and metabolic profile of controls and the GSD study group.
In this study, several clinical features drew our attention. First, the young age of the adult population (40.3 ± 14 y). This mean age was lower than what had been previously reported, even before the obesity epidemic prevalent both in Mexico and the United States.1. Additionally, 7% of the patients had type 2 diabetes mellitus. However, it was notable that the majority of the patients had several metabolic abnormalities, such as, glucose > 100 mg/dL, high HOMA index, dyslipidemia, overweight and obesity. Such insulin resistance features are known to be related to GSD and metabolic syndrome,46 which suggests that this population may be more prone to type 2 diabetes mellitus in the next 10 or 15 years with plausible liver damage. Additionally, patients referred a significant decrease in physical activity and a negative emotional state that may enhance the development of obesity and associated diseases including GSD. However, further studies will be required to establish the manner in which negative emotions and deterioration in quality of life are associated with GSD. Nonetheless, it is important to encourage young adults with metabolic risk factors to practice healthy lifestyle habits in order to prevent the development not only of GSD, but of other chronic diseases as well.
Finally, in this study we analyzed the interplay between genetic and environmental factors that may influence lipid metabolism. Previously, we have documented that in West Mexico, a typical hepatopathogenic diet is elaborated with local food items that are different from those used in other geographical regions of Mexico.45 The people of this region daily consume a wide-variety of regional Mexican plates that are high in fats known as “antojitos” (food “snacks”). Some of them are deep-fried pork (carnitas), a Mexican birote bread filled with chopped, fried pork meat dipped in a red chilli sauce (tortas ahogadas) and grilled meats together with a high intake of soft drinks, sweeten-beverages and typical Mexican bread pastries (pan dulce). This diet may cause the presence of secondary dyslipidemias, most commonly hypercholesterolemia and hypertriglyceridemia. These dietary habits which are known to differ from those of other regions of the country47 may explain why there was no association between the E4 allele and GSD among Mexican-Mestizos and natives from Sinaloa in Sanchez-Cuens, et al.’s study.30 Therefore, it is noteworthy to consider that both the individual’s genetic composition and the degree of exposure to environmental factors, particularly in regards to food preferences and food habits may differ among the western State of Jalisco and the north State of Sinaloa.48 Furthermore, the lack of association between FABP2 genotypes and allele frequencies and GSD may be attributable to the pre-surgical dietary modifications done by the patients between the time of diagnosis and lipid testing. Therefore, BMI was lower in patients with the Ala54Thr and Thr54Thr genotype, indicating that the FABP2 gene is highly influenced by diet. These results represent a significant example to analyze the interaction of genetic and environmental factor for the development of GSD.
ConclusionPatients with symptomatic GSD had a high frequency of the E4 allele which may contribute to the genetic susceptibility to GSD. E4 and Thr54 alleles which have been associated with hypercholesterolemia and hypertriglyceridemia, respectively were not associated in this study because of the high lipid levels found among the controls and GSD patients from West Mexico. Sedentism and over nutrition related to the preference for a particular regional food pattern seems to play a significant role as environmental factors. However, further studies are warranted in order to establish the genetic susceptibility for GSD in Mexicans, which may result in individu-alized-medicine strategies based on both pharmacogenomics and nutrigenomics according to regional genetics and food culture.
Abbreviations- •
Apo E: apolipoprotein E.
- •
BMI: body mass index.
- •
BP: Base pair.
- •
E/I: expenditure/calorie intake ratio.
- •
FABP2: fatty acid binding protein gene.
- •
GSD: gallstone disease.
- •
HOMA: homeostasis model assessment.
- •
IR: insulin resistance.
- •
IRS: insulin resistance syndrome.
- •
PAQ: physical activity questionnaire.
- •
PCR: polymerase chain reaction.
- •
RFLP: restriction fragment length polymorphism.
- •
WC: waist circumference.
- •
WHO: World Health Organization.


