


Background. In non-alcoholic fatty liver disease (NALFD), it has often been assumed that an elevation in serum ferritin is likely related to inflammation rather than iron overload.
Material and methods. Patients referred with NAFLD were entered into a clinical study of phlebotomy therapy. A liver biopsy with liver iron concentration was done at entry and 6 months after phlebotomy (n = 56) until the patient had a low serum ferritin or developed anemia. Serum ferritin was compared to liver iron concentration, ESR, CRP, BMI and grade of inflammation on liver biopsy.
Results. Iron removed by phlebotomy in NAFLD correlated with the decrease in serum ferritin (r = 0.57, p = 0.0014) and liver iron concentration (r = 0.57, p = 0.0013). There was no significant correlations between serum ferritin and ESR, CRP or grade of liver inflammation.
Conclusions. Serum ferritin is related to liver iron storage in NAFLD and decreasing body iron stores by phlebotomy is reflected by an appropriate decrease in serum ferritin. Inflammation is not the cause of the elevated serum ferritin in fatty liver disease.
Non-alcoholic fatty liver disease (NAFLD) is the most common form of liver disease in the western world. It is the hepatic manifestation of the metabolic syndrome and is strongly tied to features of this disorder. Hyperferritinemia is a common finding in patients with NAFLD.1 Since hepatic iron overload is uncommon in this condition, it has been assumed that hyperferritinemia in NAFLD is likely related to inflammation rather than iron overload.
Our center has conducted the first prospective trial of phlebotomy therapy for NAFLD with paired liver biopsies.2 This allowed for the correlation of serum ferritin with liver iron concentration before and after treatment. As a component of our study of iron depletion as a therapy for NAFLD we sought to determine whether hyperferritinemia is related to liver iron concentration and whether the decline in serum ferritin from phlebotomy correlated with a decline in liver iron concentration (LIC). Serum and hepatic markers of inflammation were studied in relationship to serum ferritin before and after phlebotomy.
Material and MethodsInformed consent was obtained from each patient included in the study and the study protocol conforms to the ethical guidelines of the 1975 Declaration of Helsinki as reflected in a priori approval by the institution’s human research committee. This study was approved by the Health Sciences Research Ethics Board of the University of Western Ontario.
Patients referred with biopsy proven NAFLD were entered into this clinical trial of iron reduction therapy.2 Serum ferritin was measured and a liver biopsy with LIC measurement was done at entry and 6 months after the last phlebotomy. Weekly 500 mL phlebotomy sessions were conducted until a serum ferritin of ≤ 50 ug/L or hemoglobin of 100 g/L was reached. The decline in serum ferritin was compared to the decline in LIC. Lobular inflammation pre and post treatment was measured by a single blinded pathologist using the inflammation scale which has been validated as a component of the nonalcoholic fatty liver disease activity score (0-3,NAS). Serum C-reactive protein (CRP, mg/L), erythrocyte sedimentation rate (ESR, mm/h) and body mass index (BMI, kg/m2) were measured before and after phlebotomy therapy. Correlations were analyzed with Pearson’s correlation coefficient and differences between serum ferritin in and grades of liver inflammation by Kruskal-Wallis test.
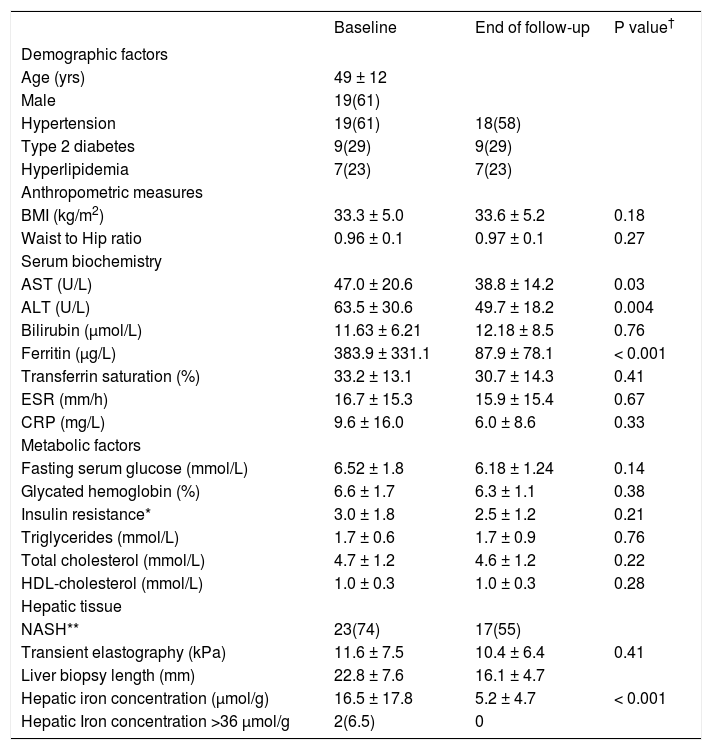
ResultsThere were 28 NAFLD patients (18 men, 10 women) with complete data including 56 liver biopsies. Pre and post phlebotomy data are shown in table 1. Patients had a mean of 1.5 g of iron removed (6 phlebotomies) with a range from 0.5 g to 4.75 g.
Patient characteristics at baseline and end of follow-up.
| Baseline | End of follow-up | P value† | |
|---|---|---|---|
| Demographic factors | |||
| Age (yrs) | 49 ± 12 | ||
| Male | 19(61) | ||
| Hypertension | 19(61) | 18(58) | |
| Type 2 diabetes | 9(29) | 9(29) | |
| Hyperlipidemia | 7(23) | 7(23) | |
| Anthropometric measures | |||
| BMI (kg/m2) | 33.3 ± 5.0 | 33.6 ± 5.2 | 0.18 |
| Waist to Hip ratio | 0.96 ± 0.1 | 0.97 ± 0.1 | 0.27 |
| Serum biochemistry | |||
| AST (U/L) | 47.0 ± 20.6 | 38.8 ± 14.2 | 0.03 |
| ALT (U/L) | 63.5 ± 30.6 | 49.7 ± 18.2 | 0.004 |
| Bilirubin (µmol/L) | 11.63 ± 6.21 | 12.18 ± 8.5 | 0.76 |
| Ferritin (µg/L) | 383.9 ± 331.1 | 87.9 ± 78.1 | < 0.001 |
| Transferrin saturation (%) | 33.2 ± 13.1 | 30.7 ± 14.3 | 0.41 |
| ESR (mm/h) | 16.7 ± 15.3 | 15.9 ± 15.4 | 0.67 |
| CRP (mg/L) | 9.6 ± 16.0 | 6.0 ± 8.6 | 0.33 |
| Metabolic factors | |||
| Fasting serum glucose (mmol/L) | 6.52 ± 1.8 | 6.18 ± 1.24 | 0.14 |
| Glycated hemoglobin (%) | 6.6 ± 1.7 | 6.3 ± 1.1 | 0.38 |
| Insulin resistance* | 3.0 ± 1.8 | 2.5 ± 1.2 | 0.21 |
| Triglycerides (mmol/L) | 1.7 ± 0.6 | 1.7 ± 0.9 | 0.76 |
| Total cholesterol (mmol/L) | 4.7 ± 1.2 | 4.6 ± 1.2 | 0.22 |
| HDL-cholesterol (mmol/L) | 1.0 ± 0.3 | 1.0 ± 0.3 | 0.28 |
| Hepatic tissue | |||
| NASH** | 23(74) | 17(55) | |
| Transient elastography (kPa) | 11.6 ± 7.5 | 10.4 ± 6.4 | 0.41 |
| Liver biopsy length (mm) | 22.8 ± 7.6 | 16.1 ± 4.7 | |
| Hepatic iron concentration (µmol/g) | 16.5 ± 17.8 | 5.2 ± 4.7 | < 0.001 |
| Hepatic Iron concentration >36 μmol/g | 2(6.5) | 0 |
Data is presented as mean ± standard deviation or N (%).
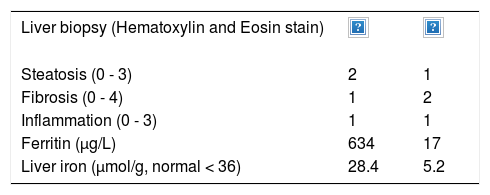
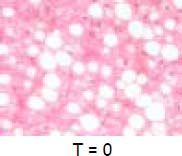
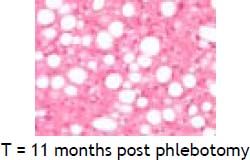
An elevated ferritin was present in 61% at baseline but LIC was elevated in only 3/28 (11%). Iron removed by phlebotomy correlated with the decrease in serum ferritin (r = 0.57, p = 0.0014) and LIC (r = 0.57, p = 0.0013). Serum ferritin decreased as liver iron decreased after phlebotomy (Figure 1). Correlation coefficients were calculated for LIC vs. serum ferritin in NAFLD (r = 0.47, p = 0.011) (Figure 2), CRP and ferritin (r = 0.023, p = 0.87) (Figure 3), and ESR and ferritin (r = −0.11, p = 0.43, serum ferritin and BMI (r = −0.02, p = 0.89). There was no significant decrease in lobular inflammation score after the phlebotomy therapy (p = 0.32). There were no significant differences between the liver grade of inflammation and the serum ferritin (p = 0.94, Kruskal-Wallis test) (Figure 4). A representative patient with liver biopsy pre and post phlebotomy is shown in table 2. The average ratio of serum ferritin to liver iron concentration was 27.3.
.")
.")
 (r = 0.023, p = 0.87).")
.")
Serum ferritin is commonly elevated in a variety of liver diseases including NAFLD. Since ferritin is an acute phase reactant it has been assumed that the ferritin elevation is secondary to the inflammation of steatohepatitis. The ferritin elevation in inflammation can be related to the leakage of hepatocyte ferritin from damaged cells, but also there is a glycosylated ferritin that is secreted by macrophages. In cases of extreme hyperferritinemia not associated with iron overload, such as histiocytosis, the glycosylated fraction of ferritin is usually low. Iso-ferritin analysis have determined H and L subunits of ferritin but this has not become a clinically useful assay. The degree of iron loading of the ferritin has also been studied to try to elucidate a method for determination of an inflammatory ferritin response from a patient with iron overload.3
In a previous study of NAFLD, there were no differences in mean serum ferritin between patients with simple steatosis, steatohepatitis, or cirrhosis.4 Our observations suggest that serum ferritin in NAFLD is correlated with liver iron storage even when the liver iron concentration is within the reference range, and that reducing body iron stores by phlebotomy is reflected by an appropriate decrease in serum ferritin. Although the patient is often relieved by the normalization of the serum ferritin by phlebotomy, the clinical benefits of reducing liver iron from a normal concentration to a low normal concentration to normalize the serum ferritin are not readily apparent. It is possible that phlebotomy has an anti-inflammatory effect but this was not demonstrated by a decrease in lobular inflammation score. Serum CRP and ESR are indirect measures which did not correlate with serum ferritin in this study. These tests are often used by clinicians to help in the assessment of the cause of an elevated serum ferritin. Although serum ferritin is often elevated in fatty liver disease, we could not show a significant correlation between body mass index and serum ferritin.
The ratio of serum ferritin to liver iron concentration was higher in NAFLD patients than previously reported in genetic hemochromatosis.5 This has often led to an inappropriate diagnosis of iron overload in NAFLD. The reasons why a similar level of liver iron concentration would result in a higher serum ferritin in NAFLD compared to hemochromatosis remains elusive. The control of serum ferritin may be a complicated balance of production, secretion and re-uptake by the hepatic ferritin receptor.6 Leakage from cells may also be contributory although this would not likely be decreased by phlebotomy therapy.
In summary, we believe that the use of paired biopsies and phlebotomy therapy for NAFLD has provided us a unique opportunity to demonstrate that inflammation is unlikely to be cause of the elevated serum ferritin and NAFLD and there is a relationship between iron removed by phlebotomy and the decrease in serum ferritin. These observations are consistent with the clinical observations when a persistent patient becomes a voluntary blood donor to normalize the serum ferritin. The physician may have thought it was unlikely to effect the ferritin since it may be related to inflammation, however in most cases the serum ferritin does decrease.
Abbreviations- •
CRP: C reactive protein.
- •
LIC: liver iron concentration.
- •
NAFLD: non-alcoholic fatty liver disease.
- •
NAS: non-alcoholic fatty liver disease activity score.
Canadian Liver Foundation.


