


Hepatitis B (HBV) and C viruses (HCV) are important causes of hepatocellular carcinoma (HCC). Our aim was to assess mortality and resource utilization of patients with HCC-related to HBV and HCV.
Material and methodsNational Cancer Institute's Surveillance, Epidemiology and End Results (SEER)-Medicare linked database (2001-2009) was used. Medicare claims included patient demographic information, diagnoses, treatment, procedures, ICD-9 codes, service dates, payments, coverage status, survival data, carrier claims, and Medicare Provider Analysis and Review (MEDPAR) data. HCC related to HBV/HCV and non-cancer controls with HBV/HCV were included. Pairwise comparisons were made by t-tests and chisquare tests. Logistic regression models to estimate odds ratios (ORs) with 95% confidence intervals (CIs) were used.
ResultsWe included 2,711 cases of HCC (518 HBV, 2,193 HCV-related) and 5,130 non-cancer controls (1,321 HBV, 3,809 HCV). Between 2001-2009, HCC cases related to HBV and HCV increased. Compared to controls, HBV and HCV patients with HCC were older, more likely to be male (73.2% vs 48.9% and 57.1% vs. 50.5%), die within one-year (49.3% vs. 20.3% and 52.2% vs. 19.2%), have decompensated cirrhosis (44.8% vs. 6.9% and 53.9% vs. 10.4%) and have higher inpatient ($60.471 vs. $47.223 and $56.033 vs. $41.005) and outpatient charges ($3,840 vs. $3,328 and $3,251 vs. $2,096) (all P < 0.05). In two separate multivariate analyses, independent predictors of one-year mortality were older age, being male and the presence of decompensated cirrhosis.
ConclusionsThe rate of viral hepatitis-related HCC is increasing. Mortality and resource utilization related to HBV and HCV-related HCC is substantial.
Hepatocellular carcinoma (HCC) is the most common form of liver cancer, and the third leading cause of cancer-related deaths in the world.1,2 Nearly 85% of HCC cases occur in developing countries, and 80% of these cases are seen in Africa and Asia.3 Additionally, in the United States (US), the incidence of HCC has almost tripled in the last 20 years and is expected to rise in the near future.4 In fact, HCC is one of the few solid tumors with increasing incidence in the US, and deaths from HCC are increasing at a faster pace than other types of cancer.5-7
In general, the incidence of HCC is influenced by age, gender and ethnicity.8,9 In the US, HCC is twice more common among Asians than in African Americans, who in turn, have a higher rate of HCC than Whites.8,9 World-wide, common risk factors for HCC include HBV, HCV, alcoholic liver disease and nonalcoholic fatty liver disease (NAFLD).2,4,10 Although HCV is the leading cause of HCC in the US, HBV has been implicated as the most common global cause of HCC.2 Additionally, the high prevalence of obesity and the associated NAFLD have led to increasing number of cases of HCC in NAFLD patients.
In the US, HCV accounts for up to 50-60% of all HCC cases and only 16% of HCC cases are attributed to HBV.11 Although nearly all cases of HCV-related HCC occur in the setting of cirrhosis, patients with HBV can develop HCC without cirrhosis.12-15 This points to potentially different pathogenic pathways responsible for HCC in patients infected with these two viruses. In fact, HBV is a DNA virus which persists in the hepatocyte nucleus while HCV is a RNA virus which replicates in the hepatocyte cytoplasm.12 Because of the high risk of HCC in patients with cirrhosis, American Association for the Study of Liver Diseases (AASLD) recommended periodic HCC surveillance.16 The prognosis of HCC depends on the stage of the tumor and patients with advanced stage HCC have poor prognosis with a 5-year survival rate of 7% and a median survival of less than one year.17,18 In patients with HCC, the mainstay of treatment is surgical resection, which is unfortunately limited to some cases due to disease burden. Other treatment options include, but not limited to, liver transplantation, radiofrequency ablation, percutaneous alcohol or acetic acid ablation, transarterial chemoembolization.19 Previous studies showed that the most satisfactory outcomes were reached in patients undergoing transplantation.20 Total inpatient charges for HCC management have been doubled in the last decade, reflecting a tremendous burden to national healthcare.21
Over the past 3 decades, there have been important demographic changes that have occurred in the US. First, the so called Baby Boomer cohort with a high prevalence of HCV is increasingly developing progressive liver disease which could lead to higher rates of HCC. Additionally, there has been significant immigration to the US from the HBV-endemic areas around the world. A number of these patients with HBV and HCV are now Medicare eligible and could potentially place significant economic burden on society. In order to better understand the impact of these socio-demographic changes in the US, the aim of our study was to assess temporal trends, mortality and resource utilization in patients with HBV and HCV-related HCC in the US.
Material and MethodsStudy design and populationThe study cohorts were identified from the SEER-Medicare linked database for 2001-2009. This database links cancer registry data from the National Cancer Institute's Surveillance, Epidemiology and End Results (SEER) program with Medicare enrollment and claims files.22,23 The data files included Patient Entitlement and Diagnosis Summary File (PEDSF), Medicare Provider Analysis and Review (MEDPAR), Physician/Supplier File, and files for outpatient, hospice and carrier data. The PEDSF file contains cancer incidence data from the 15 SEER registries, which cover 26 % of the U.S. population. In addition to patient's demographics and tumor features, it also includes information on cancer treatments, date and cause of death, and Medicare enrollment. Medicare beneficiaries are persons aged 65 and over (95% of people aged 65 and over are eligible), longterm disabled persons, or those with end-stage renal disease (ESRD). Beneficiaries are insured for short stay hospitals services, physician services, and outpatient visits. The linked Medicare claims include patient demographic information, diagnoses/treatment/procedure by International Classification of Diseases, Ninth Revision (ICD-9) codes, service dates, payment, coverage status, and survival in Summarized Denominator (SUMDENOM) File, outpatient, carrier claims, and MEDPAR data. First, HCC cases were selected from PEDSF between 2001 and 2009. Next, we requested data on all HCC cases with the ICD-9 codes of 070.7, 070, 41, 070.44, 070.51, 070.54, V02.62 as HCV and 070.2, 070.3, 070.42, 070.52, V02.61 as HBV. Only those patients who enrolled in Medicare Part A&B for at least 12 months before diagnosis of HCC were eligible for inclusion to insure adequate time for prior diagnoses to be recorded. The following groups were excluded: missing information on date of HCC diagnosis and Charlson Comorbidity Index; diagnosed based on solely death autopsy; HIV; cancer site not HCC; HCV with HBV; alcoholic liver disease, and No HCV or No HBV, detailed information on study inclusion and exclusion criteria are described in Figure 1. From the SEER-registries, a total of 31,149 liver cancer cases were identified, and 2,711 cases were included in the final analytical cohort. Using a 5% random sample of Medicare beneficiaries residing in the geographic regions of the SEER registries, patients with no prior cancer diagnoses were selected as controls. Control selection was based on the same inclusion and/or exclusion criteria as used for HCC cohort selection. HCC cases and controls were matched on the year of Medicare service and SEER regions for risk factors to minimize possible clinical trends.

Non-cancer patients (n = 5,130 non-cancer controls) with similar inclusion and exclusion criteria and one to two frequency ratio matched (based on the SEER registries regions and Medicare service use dates) were ob-tained from a 5% random sample of Medicare beneficiaries (a total of 723,020 residing in the SEER areas) who had not been diagnosed with cancer, see Figure 1. End of follow-up was defined as the earliest of either death date, last day medical service use, or the study end date of December 31, 2009.
OutcomeVital status was censored at December 31, 2012. Using the last date of Medicare service use, we calculated survival in months and created a dichotomous variable for within one-year mortality (Yes as 1 and No as 0). Total payments from Medicare (inpatient and outpatient, separately) were calculated as reimbursement amount with total pass through amount. For hospital/outpatient utilization variables that were time varying, a unique variable was created for each year and averaged from January 2001 through December 2009. For example, fee-for-service Medicare payments vary by episode, so we created 9 payments for each patient representing an average payment for each of the 9 years and further averaged as a yearly average payment. Not all patients were hospitalized/utilized outpatient services during the entire study time-period; thus hospital utilization variables were coded as missing for those above patients and created indicator variables for those who utilized medical service at least once during entire study time-period. Furthermore, substudies involving patients who were hospitalized (approximately 70%) and patients who utilized outpatient service (approximately 80%) were conducted in adjusted payments to Medicare. All charges/payments were adjusted by 2009 US dollars consumer price index.
Study variablesUsing Part A and B of Medicare enrolment records which had an average longitudinal follow-up of 5 years (IQR = 3 -8) for HCC cases and 8 (5 - 10) for non-cancer patients, we identified and defined our study variables. The following variables were identified: age, gender, race (White, Black, Other), liver transplant recipient status (by ICD-9 diagnosis code V42.7 and ICD-9 procedure codes 505.1, 505.9), Medicare status code (aged, ESRD/ disabled), prior diagnosis of decompensated cirrhosis, prior diagnosis of HCC (ICD-9 diagnosis codes 789.5, 572.2, 456.0, 456.2), modified Charlson comorbidity index (CCI) (0/1, 2/3),24 and tumor stage (localized, regional/distant, unstaged using the PEDSF).
Data analysesDescriptive statistics were used to report patient characteristics, with mean [standard deviation (SD)] for continuous variables and frequencies (percentage (%)) for categorical variables. Pairwise comparisons examined between HCC and No-HCC differences stratified by HBV and HCV, using t tests and χ2 tests. Because of the small sample size of HBV with HCC (n = 518), accumulated three-year temporal trends were examined by Kruskal-Wallis tests for numerical variables and chisquare tests for categorical variables in HBV with HCC and HCV with HCC, separately. We used logistic regression models to estimate the odds ratios (ORs) with 95% confidence intervals (CIs) for one-year mortality, and data were evaluated for HBV and HCV, separately. Further, outcomes inpatient/outpatient service payments by Medicare were found to be skewed to the right in a non-normal distribution and therefore were analyzed using generalized linear model (GLM) with a gamma error distribution and a loglink function. Multivariable regression analyses were used to assess the independent associations of patient clinic-demographics characteristics with outcomes. The adjusted relationship between risk factors and each outcome were estimated using coefficients from these models, which were exponentiated to yield a percentage change in the outcomes associated with each risk factor. SAS, version 9.3 (SAS Institute) was used for all our analyses.
ResultsAfter inclusion and exclusion criteria, we included 518 HBV-related HCC and 2193 HCV-related HCC cases. Additionally, 1321 HBV and 3809 HCV patients without HCC were selected as controls. A summary of demographic and clinical characteristics are summarized in Table 1.
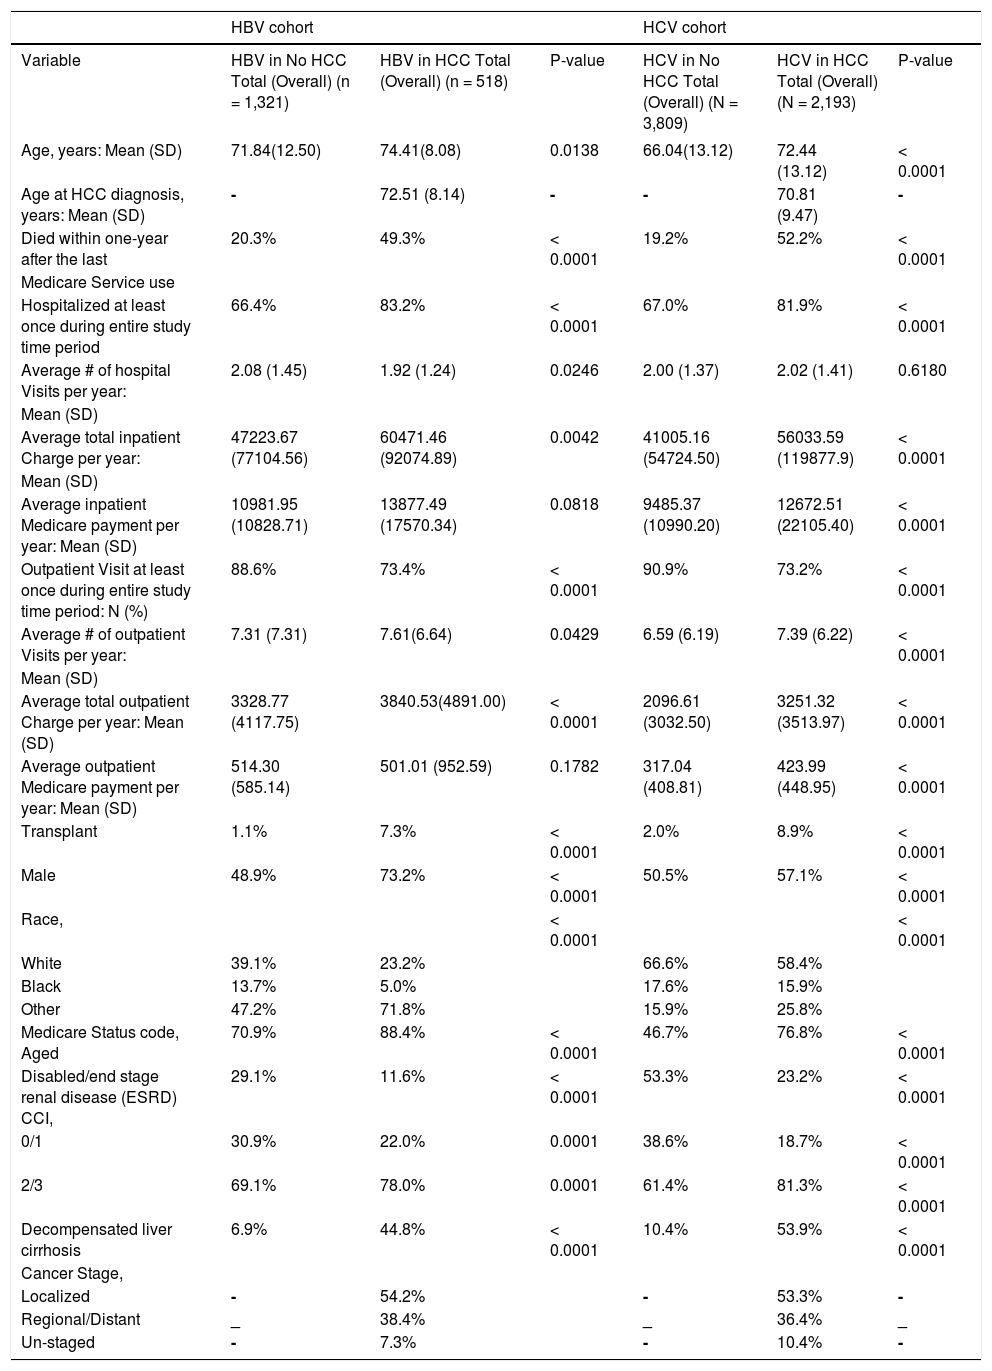
Characteristics of Study by HBV/HCV and HCC Status, SEER-Medicare, 2001 - 2009.
| HBV cohort | HCV cohort | |||||
|---|---|---|---|---|---|---|
| Variable | HBV in No HCC Total (Overall) (n = 1,321) | HBV in HCC Total (Overall) (n = 518) | P-value | HCV in No HCC Total (Overall) (N = 3,809) | HCV in HCC Total (Overall) (N = 2,193) | P-value |
| Age, years: Mean (SD) | 71.84(12.50) | 74.41(8.08) | 0.0138 | 66.04(13.12) | 72.44 (13.12) | < 0.0001 |
| Age at HCC diagnosis, years: Mean (SD) | - | 72.51 (8.14) | - | - | 70.81 (9.47) | - |
| Died within one-year after the last | 20.3% | 49.3% | < 0.0001 | 19.2% | 52.2% | < 0.0001 |
| Medicare Service use | ||||||
| Hospitalized at least once during entire study time period | 66.4% | 83.2% | < 0.0001 | 67.0% | 81.9% | < 0.0001 |
| Average # of hospital Visits per year: | 2.08 (1.45) | 1.92 (1.24) | 0.0246 | 2.00 (1.37) | 2.02 (1.41) | 0.6180 |
| Mean (SD) | ||||||
| Average total inpatient Charge per year: | 47223.67 (77104.56) | 60471.46 (92074.89) | 0.0042 | 41005.16 (54724.50) | 56033.59 (119877.9) | < 0.0001 |
| Mean (SD) | ||||||
| Average inpatient Medicare payment per year: Mean (SD) | 10981.95 (10828.71) | 13877.49 (17570.34) | 0.0818 | 9485.37 (10990.20) | 12672.51 (22105.40) | < 0.0001 |
| Outpatient Visit at least once during entire study time period: N (%) | 88.6% | 73.4% | < 0.0001 | 90.9% | 73.2% | < 0.0001 |
| Average # of outpatient Visits per year: | 7.31 (7.31) | 7.61(6.64) | 0.0429 | 6.59 (6.19) | 7.39 (6.22) | < 0.0001 |
| Mean (SD) | ||||||
| Average total outpatient Charge per year: Mean (SD) | 3328.77 (4117.75) | 3840.53(4891.00) | < 0.0001 | 2096.61 (3032.50) | 3251.32 (3513.97) | < 0.0001 |
| Average outpatient Medicare payment per year: Mean (SD) | 514.30 (585.14) | 501.01 (952.59) | 0.1782 | 317.04 (408.81) | 423.99 (448.95) | < 0.0001 |
| Transplant | 1.1% | 7.3% | < 0.0001 | 2.0% | 8.9% | < 0.0001 |
| Male | 48.9% | 73.2% | < 0.0001 | 50.5% | 57.1% | < 0.0001 |
| Race, | < 0.0001 | < 0.0001 | ||||
| White | 39.1% | 23.2% | 66.6% | 58.4% | ||
| Black | 13.7% | 5.0% | 17.6% | 15.9% | ||
| Other | 47.2% | 71.8% | 15.9% | 25.8% | ||
| Medicare Status code, Aged | 70.9% | 88.4% | < 0.0001 | 46.7% | 76.8% | < 0.0001 |
| Disabled/end stage renal disease (ESRD) CCI, | 29.1% | 11.6% | < 0.0001 | 53.3% | 23.2% | < 0.0001 |
| 0/1 | 30.9% | 22.0% | 0.0001 | 38.6% | 18.7% | < 0.0001 |
| 2/3 | 69.1% | 78.0% | 0.0001 | 61.4% | 81.3% | < 0.0001 |
| Decompensated liver cirrhosis | 6.9% | 44.8% | < 0.0001 | 10.4% | 53.9% | < 0.0001 |
| Cancer Stage, | ||||||
| Localized | - | 54.2% | - | 53.3% | - | |
| Regional/Distant | _ | 38.4% | _ | 36.4% | _ | |
| Un-staged | - | 7.3% | - | 10.4% | - | |
Compared to HBV controls, HBV patients with HCC were significantly older (74.4 vs. 71.8 years). The proportion of patients who died within one-year was significantly higher in HCC group (49.3% vs. 20.3%) than controls. Although the average number of hospital visits for HCC group was lower than controls (1.92 vs. 2.08, p = .02), the average total inpatient charges were significantly higher in patients with HCC ($60,471 vs. $47,223, p = 0.004). Similarly, average total outpatient charges were higher in HCC group than controls ($3,840 vs. $3,328, p = 0.04). As expected, the rate of liver transplantation (7.3% vs. 1.1%, p < 0.0001) and proportion of males (73.2% vs. 48.9%, p < 0.0001) were higher in HCC group. Furthermore, the rate of decompensated cirrhosis was significantly higher in patients with HCC (44.8% vs. 6.9%).
Patients with HCV-related HCCFor HCV cohort, the mean age of the patients with HCC was higher than controls (72.4 vs. 66 years). The proportion of HCV patients who died within one-year was higher in those with HCC (52.2% vs. 19.2%, p < 0.0001). Although both HCC and control groups did not vary in the average number of hospital visits (2.02 vs. 2.00), average total inpatient charges were significantly higher in HCC ($56,033 vs. $41,005, P < 0.0001). Similarly, the average number of outpatient visits (7.39 vs. 6.59) and average total outpatient charges ($3,251 vs. $2,096) were significantly higher in HCC than the controls (all P < 0.0001). Compared to HCV controls, the rate of liver transplantation (8.9% vs. 2.0%), proportion of males (57.1% vs. 50.5%) and the presence of decompensated cirrhosis were higher in the HCC group (53.9% vs. 10.4%, all p < .0001).
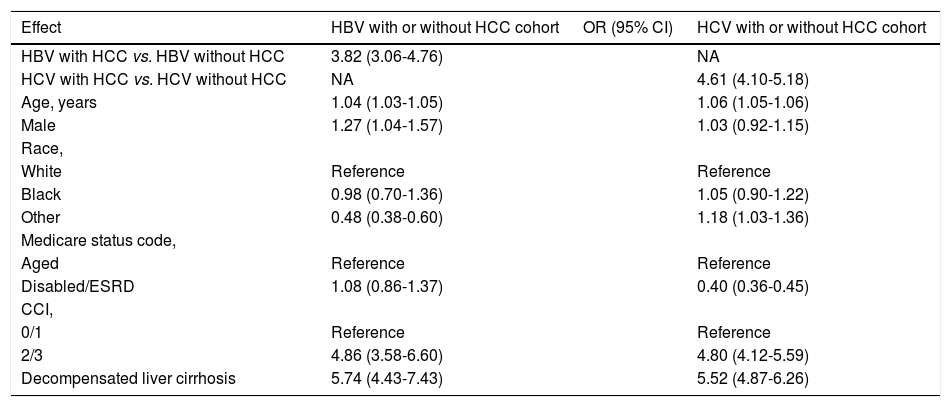
Predictors of Mortality in HBV and HCV-related HCCIn univariate analysis using the data from the HBV cohort, presence of HCC (OR: 3.82 [95% CI, 3.06-4.76]), age (OR: 1.04 [95% CI, 1.03-1.05]), male gender (OR: 1.27 [95% CI, 1.04-1.57]), Charlson comorbidity index 2/3 (OR: 4.86 [95% CI, 3.58-6.60]) and presence of decompensated cirrhosis (OR: 5.74 [95% CI, 4.43-7.43]) were all associated with increased risk of within one-year mortality (Table 2).
Univariate-adjusted odds ratios (OR) with 95% confidence intervals (CIs) for outcome within one-year mortality from the last date of Medicare use in HBV and HCV with or without HCC.
| Effect | HBV with or without HCC cohort | OR (95% CI) | HCV with or without HCC cohort |
|---|---|---|---|
| HBV with HCC vs. HBV without HCC | 3.82 (3.06-4.76) | NA | |
| HCV with HCC vs. HCV without HCC | NA | 4.61 (4.10-5.18) | |
| Age, years | 1.04 (1.03-1.05) | 1.06 (1.05-1.06) | |
| Male | 1.27 (1.04-1.57) | 1.03 (0.92-1.15) | |
| Race, | |||
| White | Reference | Reference | |
| Black | 0.98 (0.70-1.36) | 1.05 (0.90-1.22) | |
| Other | 0.48 (0.38-0.60) | 1.18 (1.03-1.36) | |
| Medicare status code, | |||
| Aged | Reference | Reference | |
| Disabled/ESRD | 1.08 (0.86-1.37) | 0.40 (0.36-0.45) | |
| CCI, | |||
| 0/1 | Reference | Reference | |
| 2/3 | 4.86 (3.58-6.60) | 4.80 (4.12-5.59) | |
| Decompensated liver cirrhosis | 5.74 (4.43-7.43) | 5.52 (4.87-6.26) |
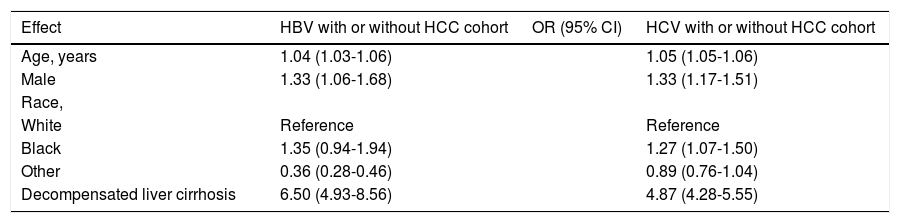
In multivariate analysis for the same group, age (OR: 1.04 [95% CI, 1.03-1.06]), male gender (OR: 1.33 [95% CI, 1.06-1.68]) and presence of decompensated cirrhosis (OR: 6.50 [95% CI, 4.93-8.56]) remained significant (Table 3).
Multivariate-adjusted odds ratios (OR) with 95% confidence intervals (CIs) for outcome within one-year mortality from the last date of Medicare use in HBV and HCV with or without HCC.
| Effect | HBV with or without HCC cohort | OR (95% CI) | HCV with or without HCC cohort |
|---|---|---|---|
| Age, years | 1.04 (1.03-1.06) | 1.05 (1.05-1.06) | |
| Male | 1.33 (1.06-1.68) | 1.33 (1.17-1.51) | |
| Race, | |||
| White | Reference | Reference | |
| Black | 1.35 (0.94-1.94) | 1.27 (1.07-1.50) | |
| Other | 0.36 (0.28-0.46) | 0.89 (0.76-1.04) | |
| Decompensated liver cirrhosis | 6.50 (4.93-8.56) | 4.87 (4.28-5.55) |
In univariate analysis using the data from the HCV cohort, presence of HCC (OR: 4.61 [95% CI, 4.10-5.18]), age (OR: 1.06 [95% CI, 1.05-1.06]), Charlson comorbidity index 2/3 (OR: 4.80 [95% CI, 4.12-5.59]) and presence of decompensated cirrhosis (OR: 5.52 [95% CI, 4.87-6.26]) were associated with increased risk of within one-year mortality (Table 2). In multivariate analysis of the same group, male gender (OR: 1.33 [95% CI, 1.17-1.51]), age (OR: 1.05 [95% CI, 1.05-1.06]) and presence of decompensated cirrhosis (OR: 4.87 [95% CI, 4.28-5.55]) were independent predictors of within one-year mortality (Table 3).
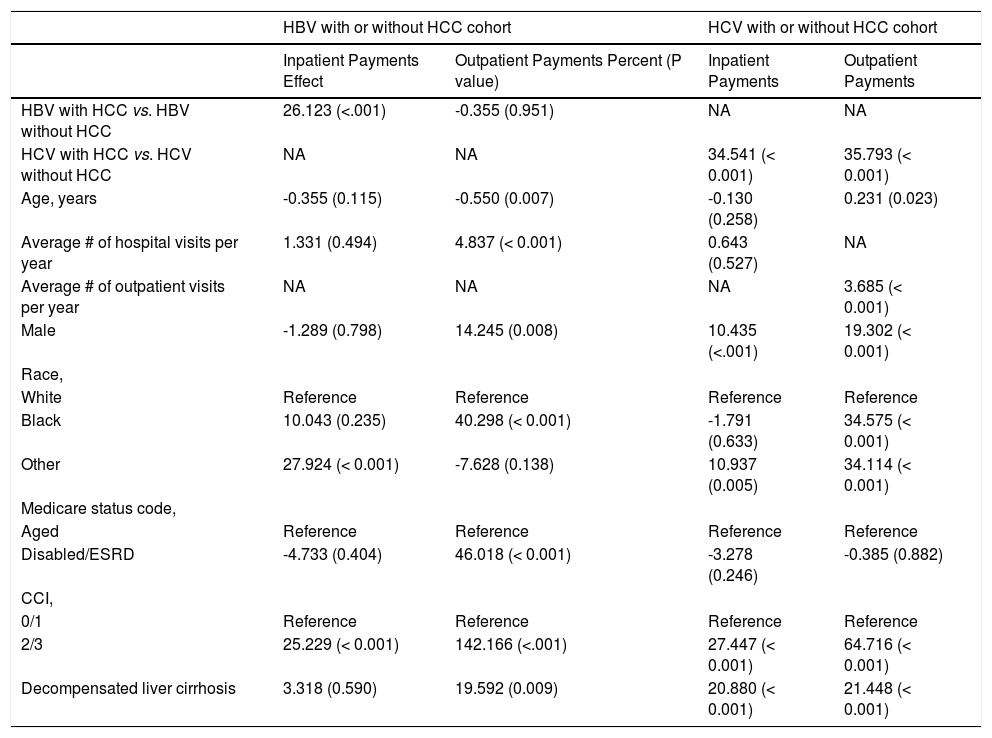
Predictors of resource utilization in HBV and HCV-related HCCUnivariate analysis of HBV cohort revealed that presence of HCC (26%) and having Charlson score of 2/3 (25%) significantly increased inpatient payments. The strongest contributors in outpatient setting were Medicare eligibility due to disability or ESRD (46%) and having a Charlson score of 2/3 (142%) (All P < 0.05) (Table 4).
Univariate-adjusted percent * (P value) for outcomes inpatient/outpatient service payments by Medicare.
| HBV with or without HCC cohort | HCV with or without HCC cohort | |||
|---|---|---|---|---|
| Inpatient Payments Effect | Outpatient Payments Percent (P value) | Inpatient Payments | Outpatient Payments | |
| HBV with HCC vs. HBV without HCC | 26.123 (<.001) | -0.355 (0.951) | NA | NA |
| HCV with HCC vs. HCV without HCC | NA | NA | 34.541 (< 0.001) | 35.793 (< 0.001) |
| Age, years | -0.355 (0.115) | -0.550 (0.007) | -0.130 (0.258) | 0.231 (0.023) |
| Average # of hospital visits per year | 1.331 (0.494) | 4.837 (< 0.001) | 0.643 (0.527) | NA |
| Average # of outpatient visits per year | NA | NA | NA | 3.685 (< 0.001) |
| Male | -1.289 (0.798) | 14.245 (0.008) | 10.435 (<.001) | 19.302 (< 0.001) |
| Race, | ||||
| White | Reference | Reference | Reference | Reference |
| Black | 10.043 (0.235) | 40.298 (< 0.001) | -1.791 (0.633) | 34.575 (< 0.001) |
| Other | 27.924 (< 0.001) | -7.628 (0.138) | 10.937 (0.005) | 34.114 (< 0.001) |
| Medicare status code, | ||||
| Aged | Reference | Reference | Reference | Reference |
| Disabled/ESRD | -4.733 (0.404) | 46.018 (< 0.001) | -3.278 (0.246) | -0.385 (0.882) |
| CCI, | ||||
| 0/1 | Reference | Reference | Reference | Reference |
| 2/3 | 25.229 (< 0.001) | 142.166 (<.001) | 27.447 (< 0.001) | 64.716 (< 0.001) |
| Decompensated liver cirrhosis | 3.318 (0.590) | 19.592 (0.009) | 20.880 (< 0.001) | 21.448 (< 0.001) |
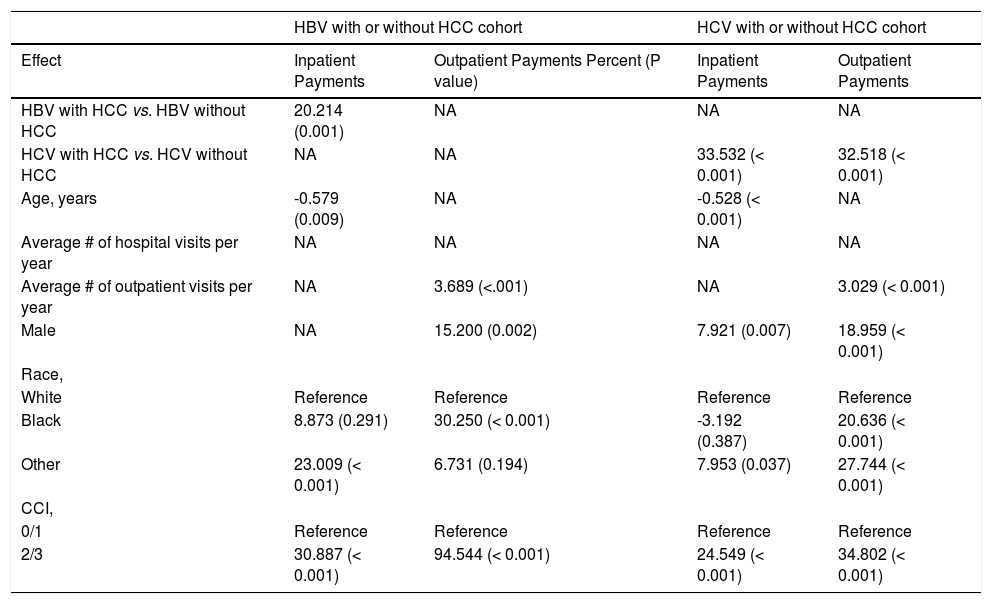
In multivariate analysis, presence of HCC (20%) and having a Charlson score of 2/3 (31%) remained significant for inpatients, while male gender (15%), being Black (30%) and having a Charlson score of 2/3 (95%) remained significant for outpatients (All P < 0.05) (Table 5).
Multivariate-adjusted percent * (P value) for outcomes inpatient/outpatient service payments by Medicare.
| HBV with or without HCC cohort | HCV with or without HCC cohort | |||
|---|---|---|---|---|
| Effect | Inpatient Payments | Outpatient Payments Percent (P value) | Inpatient Payments | Outpatient Payments |
| HBV with HCC vs. HBV without HCC | 20.214 (0.001) | NA | NA | NA |
| HCV with HCC vs. HCV without HCC | NA | NA | 33.532 (< 0.001) | 32.518 (< 0.001) |
| Age, years | -0.579 (0.009) | NA | -0.528 (< 0.001) | NA |
| Average # of hospital visits per year | NA | NA | NA | NA |
| Average # of outpatient visits per year | NA | 3.689 (<.001) | NA | 3.029 (< 0.001) |
| Male | NA | 15.200 (0.002) | 7.921 (0.007) | 18.959 (< 0.001) |
| Race, | ||||
| White | Reference | Reference | Reference | Reference |
| Black | 8.873 (0.291) | 30.250 (< 0.001) | -3.192 (0.387) | 20.636 (< 0.001) |
| Other | 23.009 (< 0.001) | 6.731 (0.194) | 7.953 (0.037) | 27.744 (< 0.001) |
| CCI, | ||||
| 0/1 | Reference | Reference | Reference | Reference |
| 2/3 | 30.887 (< 0.001) | 94.544 (< 0.001) | 24.549 (< 0.001) | 34.802 (< 0.001) |
In univariate analysis of HCV cohort, presence of HCC (35%, 36%), male gender (10%, 19%), having a Charlson score of 2/3 (27%, 65%) and the presence of decompensated cirrhosis (21%, 21%) were associated with increased inpatient and outpatient payments (All P < .05) (Table 4). In multivariate analysis, presence of HCC (34%, 33%), male gender (8%, 19%) and having a Charlson score of 2/3 (25%, 35%) remained significant for both inpatients and outpatients, respectively (All P < .05) (Table 5).
DiscussionThis is a long-term study of Medicare recipients with HBV and HCV who developed HCC in the reported SEER database. Our data showed that for both HBV and HCV groups, compared to non-HCC patients, HCC patients were older, more likely to be male, more likely to be hospitalized, had decompensated cirrhosis and die within one-year. All of these findings are consistent with previous reports.25-28
One of the findings of our study was that one-year mortality was higher in patients with HCC than patients with-out HCC. One-year mortality was slightly higher in HCV group as 52% of HCV patients with HCC died within one-year while this ratio was 49% in HBV patients with HCC. In a retrospective study among hepatitis-related HCC, Cantarini, et al. reported that within one-year mortality was 33% for patients with HBV and HCC and 17% for patients with HCV and HCC, but the difference was not significant. Moreover, when they stratified patients according to sex, age or Child-Pugh class, survival did not differ between groups. Only in patients with advanced HCC, one-year mortality was significantly higher in HBV group, but this difference was mostly due to the treatment modalities, as most HBV patients underwent palliative therapy whereas HCV patients received transplantation.29 Similarly, Shiratori, et al. reported a higher within one-year mortality rate among HBV patients with HCC (24%) than HCV patients with HCC (17%).The reason for these different rates may have been due to differences in tumor stage and the primary etiologic factors in the study populations, as well as the treatment options the patients received.30 In fact, depending on the underlying etiology, there were also some differences between HBV and HCV patients in our study. The most important predictor of one-year mortality, the presence of decompensated cirrhosis, was more common in patients with HCV and HCC. This finding is especially important regarding the fact that approximately 3% of patients with compensated cirrhosis with HBV or HCV infection develop HCC per year.31 A study by Yang, et al. revealed that the prevalence of histologic cirrhosis was 88% among patients with HBV infection and 93% among patients with HCV infection, and when the most inclusive criteria were applied, the rates increased to 94% for HBV patients and 97% for HCV patients.14 In our study, the prevalence of decompensated cirrhosis was in accordance with this study, as 54% of HCV patients with HCC and 45% of HBV patients with HCC had decompensated cirrhosis. Furthermore, 81% of HCV patients with HCC and 78% of HBV patients with HCC had more comorbidities as indicated by a Charlson comorbidity index of 2/3.
Age and gender are two well-known risk factors for liver cancer development. Previous studies clearly showed that compared to females, males had higher liver cancer rates.2,9,32 Parallel to those findings, in our study, being male increased one-year mortality 1.3 times for both HBV and HCV patients. It was also shown previously that older age was a risk factor for HCC.9 In the US, HCC peaks around 70-75 years of age, which was also found in our study.
Another important finding of our study was related to resource utilization. In fact, both inpatient and outpatient charges in HCC group were significantly higher than non-HCC, both for HBV and HCV cohorts. In patients with HBV, the presence of HCC increased inpatient charges 1.27 times and outpatient charges 1.15 times. For HCV patients, these numbers were 1.36 and 1.55, respectively. Multivariate analysis revealed that beside the presence of HCC, male gender, race (non-White non-Black) and having a Charlson index of 2/3 were also associated with increased resource utilization in both HBV and HCV cohorts. Indeed, the increase in hospital charges in the US has also been reported by Kim, et al., stating that the estimated total charges for HCC hospitalizations increased from $241 million in 1988 to $509 million in 2000, after inflation adjustment. It was also noted that the increase in inpatient service utilization was in part due to utilization of highly resource-intensive activities such as liver transplantation, local ablative therapy or embolization.33,34 In a more recent study, Mishra, et al. investigated the economic burden of HCC between 2005 and 2009 using data from the Nationwide Inpatient Sample. It was revealed that although inpatient mortality decreased and length of stay remained stable, the number of inpatient cases with HCC increased, as well as the inpatient charges associated with HCC. There was a 2-fold increase in total inpatient charges, starting from $1 billion in 2005 and reaching up to $2 billion in 2009.21 In another study by Menzin, et al. among HCV patients utilizing Florida Medicaid program, it was found that HCV patients with advanced liver disease diagnosis (decompensated cirrhosis, HCC, or transplantation) had significantly higher all-cause resource use and costs compared to HCV patients without an advanced liver dis-ease diagnosis. The mean all-cause cost of HCV patients with advanced liver disease was $4,956, whereas this cost was $1,735 for HCV patients without advanced disease.35 A study by McAdam-Marx, et al. also revealed that healthcare charges showed significant increase in patients with HCV infection in the presence of advanced liver disease. While mean all-cause charge was $14,917 for HCV infected patients without advanced disease, this number increased to $27,000 for decompensated cirrhosis, $58,529 for HCC and $113,116 for patients that undergone liver transplantation.36 In the light of these examples, it is highly likely that the reason of HCC to cause higher cost and charges were increased utilization of imaging modalities, expensive treatment options and increased hospitalization costs.
There have been tremendous changes in HCV management since the beginning of this decade, with the development of highly effective new antiviral medications. As boceprevir and telaprevir were approved in 2011 and simeprevir and sofosbuvir in 2013, successful treatment of chronic HCV infection will definitely cause a significant reduction in the burden of chronic HCV infection in the US and will decrease the incidence of HCC. However, it is still early to see this projected change in HCV and it can take several years to manifest.
This study is not free of limitations. First, the distribution of HBV and HCV is not uniform among Americans. Contrary to some other parts of the world, like Africa and Asia, the most common viral etiology for HCC in the US is HCV,25 and the number of HBV cases with or without HCC was lower than HCV in our study. Furthermore, transplantation rates of HBV and HCV cohorts were different in our study and we were not able to assess other treatment modalities (surgical resection or transarterial chemoembolization) these two groups received, which may possibly had an effect on within one-year mortality rates.
In conclusion, the rate of HCC related to viral hepatitis is increasing. Mortality and resource utilization related to HBV and HCV-related HCC is substantial.
Abbreviations- •
AASLD: American Association for the Study of Liver Diseases.
- •
ESRD: end-stage renal disease.
- •
HBV: hepatitis B viruses.
- •
HCC: hepatocellular carcinoma.
- •
HCV: hepatitis C viruses.
- •
NAFLD: nonalcoholic fatty liver disease.
The authors have nothing to disclose. This study was internally funded without any external fund.
AcknowledgementsThe authors would like to thank Deena Hallaji, Manirath Srishord and Brian Lam, PA-C, for their great support during the formation of the manuscript.


